Distributed Fiber Optic Sensing Market Analysis North America, Europe, APAC, Middle East and Africa, South America - US, China, Canada, UK, Germany - Size and Forecast 2024-2028

Distributed Fiber Optic Sensing Market Analysis North America, Europe, APAC, Middle East and Africa, South America - US, China, Canada, UK, Germany - Size and Forecast 2024-2028

Published: Jul 2024 173 Pages SKU: IRTNTR74182

Market Overview at a Glance

$489.9 Mn
Market Opportunity
7.08%
CAGR
6.49
YoY growth 2023-2024(%)

Distributed Fiber Optic Sensing Market Size 2024-2028 

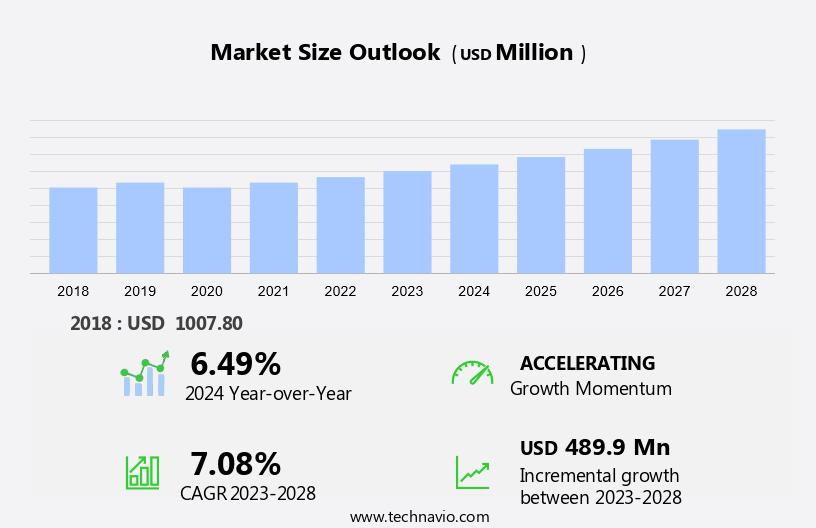
The distributed fiber optic sensing market size is forecast to increase by USD 489.9 million at a CAGR of 7.08% between 2023 and 2028. The market is experiencing significant growth, driven by the surging demand for infrastructure development in sectors such as Oil & Gas, Power and Utilities, Infrastructure, and Environmental Monitoring. The increasing focus on structural health monitoring and civil infrastructure safety is further fueling market expansion. Additionally, the growing need for real-time data analysis and improved efficiency in various industries is leading to increased adoption of distributed fiber optic sensing systems. However, the high cost of these advanced sensor systems remains a major challenge for market growth. The Energy Information Administration anticipates military expansion to be a major growth driver for the optic sensing market, further boosting the demand for distributed temperature sensing in various sectors. Despite this, the market is expected to continue expanding due to its ability to provide accurate, reliable, and cost-effective solutions for various applications, including pipeline monitoring, bridge health assessment, and power system protection.

Distributed Fiber Optic Sensing Market Size

 Request Free Sample

The market is experiencing significant growth due to its application in numerous industries, including oil & gas, infrastructure, power and utilities, environmental monitoring, civil infrastructure, automotive, aerospace, military equipment, border security, medical, renewable energy, and nuclear energy sectors. This technology utilizes optical fiber, specifically the Raman scattering effect and Rayleigh effect-based sensing, to provide real-time data analysis. In the oil & gas industry, fiber optic sensing is used for pipeline monitoring, ensuring safety and efficiency. Infrastructure industries benefit from structural health monitoring, while the power and utilities sector relies on it for grid monitoring and fault detection.

Environmental monitoring applications include water quality analysis and pollution detection. Civil sectors, such as transportation and construction, use fiber optic sensing for condition monitoring of bridges, roads, and tunnels. The automotive sector integrates this technology for safety systems and autonomous vehicles. Aerospace applications include structural health monitoring and fuel leak detection. Military equipment and border security utilize fiber optic sensing for intrusion detection and threat assessment. The medical industry uses it for patient monitoring and diagnostics. Renewable energy and nuclear energy industries employ this technology for power generation monitoring and safety. Overall, distributed fiber optic sensing is revolutionizing industries with its ability to provide real-time data analysis, ensuring safety, efficiency, and reliability.

Market Segmentation

The market research report provides comprehensive data (region-wise segment analysis), with forecasts and estimates in "USD Million" for the period 2024-2028, as well as historical data from 2018-2022 for the following segments.

  • Application
    • Temperature sensing
    • Acoustic sensing
    • Other
  • End-user
    • Oil and gas
    • Power and utility
    • Civil engineering
    • Industrial
    • Safety and security
  • Geography
    • North America
      • Canada
      • US
    • Europe
      • Germany
      • UK
    • APAC
      • China
    • Middle East and Africa
    • South America

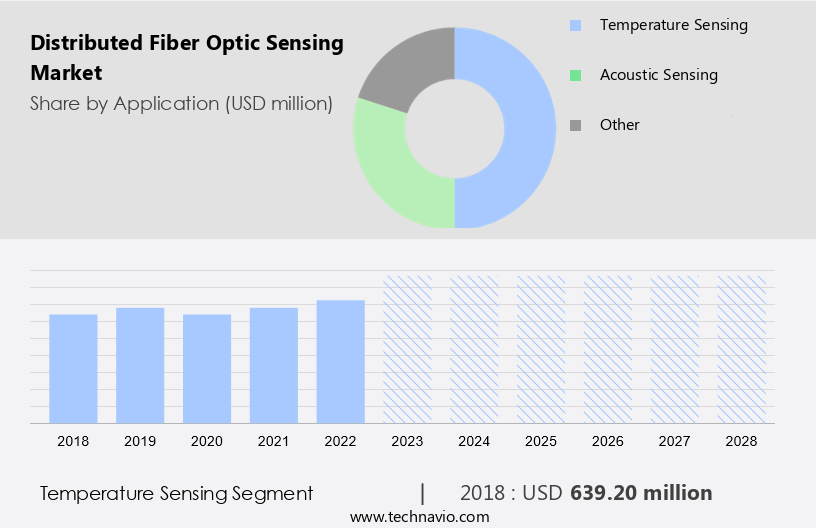
By Application Insights

The temperature sensing segment is estimated to witness significant growth during the forecast period. The distributed temperature sensing segment of the optic sensing market is projected to experience significant growth over the upcoming years. Distributed temperature sensing is a crucial application of optical fiber technology, which is employed in various sectors including oil and gas, manufacturing, infrastructural monitoring, and environmental monitoring. The primary reason for the widespread adoption of this technology is its capability to be multiplexed along the entire length of an optical fiber cable, providing excellent spatial resolution and resistance to attenuation. The increasing utilization of distributed temperature sensing is poised to drive the growth of this segment. Key features and applications of this technology include pipeline monitoring, a sensing range of up to 100 km per channel, short acquisition and response times, and the ability to measure temperature, strain, and pressure.

Furthermore, these sensors are non-sensitive to hydrogen and changing fiber attenuation, thereby enhancing refinery efficiency, minimizing downtime, and ensuring safety levels. Despite being used in limited applications currently, the adoption of distributed temperature sensing is expected to expand significantly during the forecast period due to its numerous advantages.

Distributed Fiber Optic Sensing Market Size

Get a glance at the market share of various segments Request Free Sample

The temperature sensing segment was valued at USD 639.20 million in 2018 and showed a gradual increase during the forecast period.

Regional Insights

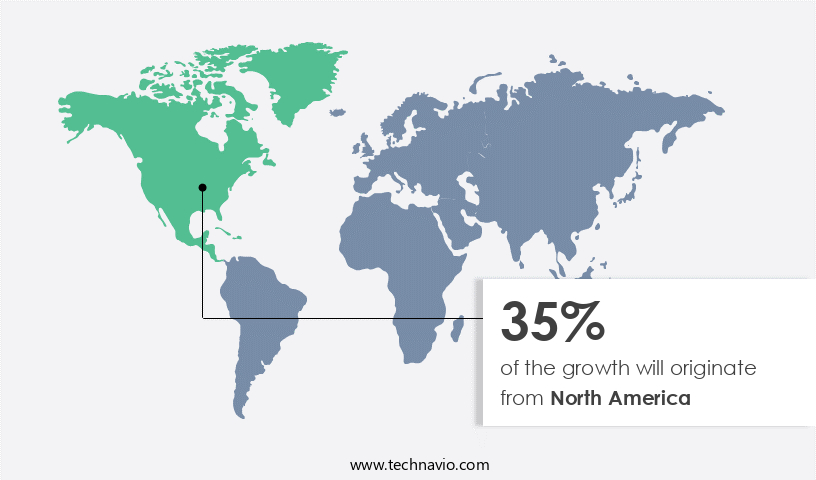
North America is estimated to contribute 35% to the growth of the global market during the forecast period. Technavio's analysts have elaborately explained the regional trends and drivers that shape the market during the forecast period.

Distributed Fiber Optic Sensing Market Share by Geography

For more insights on the market share of various regions Request Free Sample

In North America, the market holds the largest share globally, driven by the widespread adoption of these sensors in various industries. The technology relies on the unique scattering properties of laser light as it traverses an optical fiber, detecting temperature and strain changes along its length. Real-time monitoring of temperatures and strain is achievable on every meter or less of the 18.5-mile-long fiber optic cable. This technology's popularity in North America can be attributed to its extensive use in sectors like food and beverage, oil and gas, and automotive manufacturing. The Energy Information Administration's data indicates that these industries account for a significant portion of the region's economic activity, necessitating advanced monitoring solutions for operational efficiency and safety. The military sector is also expanding its use of distributed fiber optic sensing for defense applications, further fueling market growth.

Our researchers analyzed the data with 2023 as the base year, along with the key drivers, trends, and challenges. A holistic analysis of drivers will help companies refine their marketing strategies to gain a competitive advantage.

Market Driver

Surging demand for the infrastructure sector is the key driver of the market. In the infrastructure sector, including the Oil & Gas Industry and Power and Utilities, distributed fiber optic sensing technology is gaining significant traction, particularly for Structural Health Monitoring (SHM). This technology enables infrastructure managers to assess the structural condition of assets such as pipelines, bridges, dams, and geotechnical structures in a cost-effective and efficient manner. The primary advantage of next-generation distributed sensors is their ability to monitor strain, temperature, or pressure at multiple sites simultaneously. The increasing demand for real-time monitoring and the ability to deploy sensors in challenging environments are key factors driving the adoption of distributed sensing in the infrastructure sector. Environmental Monitoring is another area where this technology is being increasingly utilized to ensure the safety and integrity of civil infrastructure.

Market Trends

Growing demand for data analysis is the upcoming trend in the market. Distributed fiber optic sensing is a cutting-edge technology that gathers data through optical fibers, providing valuable insights for various industries, including Oil & Gas, Infrastructure, Power and Utilities, and Environmental Monitoring. The technology employs light scattering to detect changes in temperature, strain, vibration, or pressure at any point along the fiber length. With the massive amounts of data generated, advanced analytical tools are essential for assessing the information. Data engineers use these tools to extract patterns, decipher insights, and inform data-driven decision-making and strategies. In Civil Infrastructure and Structural Health Monitoring, this technology aids in maintaining optimal performance and ensuring safety. The data is presented in a graphical format, allowing for easy interpretation and effective decision-making.

Market Challenge

The high cost of distributed fiber optic sensor systems is a key challenge affecting the market growth. Distributed fiber optic sensing technology is gaining traction in various industries, including Oil & Gas, Infrastructure, Power and Utilities, and Environmental Monitoring. This technology enables companies to collect highly accurate real-time data from challenging working conditions. The benefits of distributed fiber optic sensors are numerous, including their precision and reliability. However, the high cost of implementing these systems remains a significant barrier to entry for many businesses. The expense is influenced by factors such as the applications, the type of cable used, and the operating conditions. Moreover, since the entire fiber optic cable functions as a sensing element, any defect or fault in the cable can cause significant issues, making it difficult to identify and address these problems, particularly in difficult terrain and environmental conditions.

Exclusive Customer Landscape

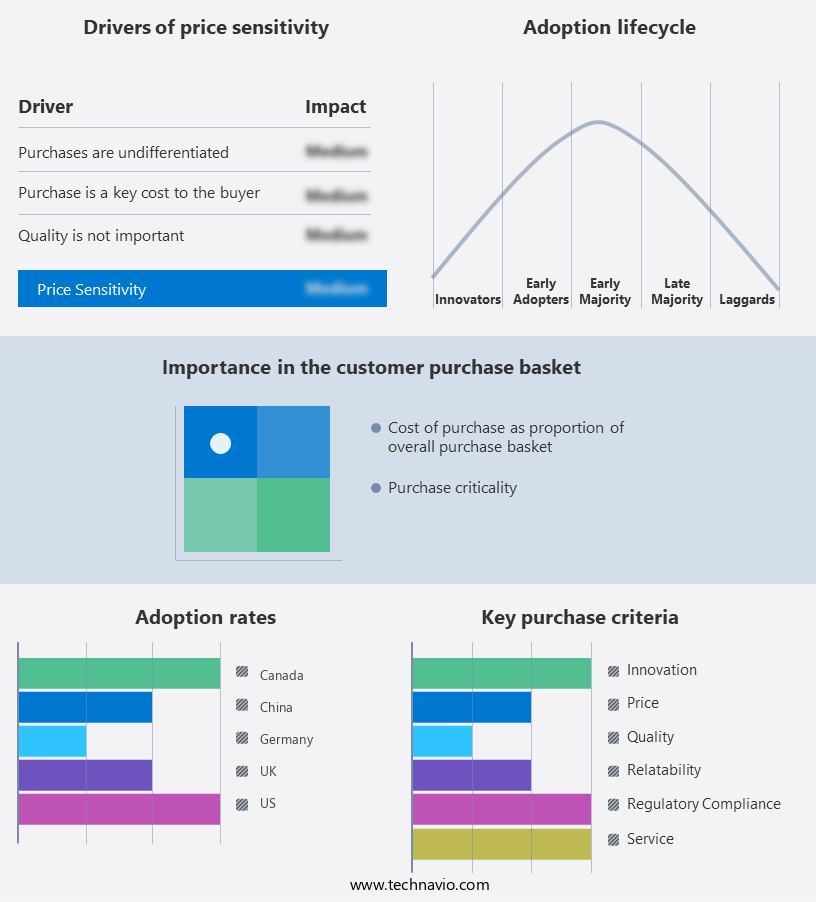
The market forecasting report includes the adoption lifecycle of the market, covering from the innovator's stage to the laggard's stage. It focuses on adoption rates in different regions based on penetration. Furthermore, the report also includes key purchase criteria and drivers of price sensitivity to help companies evaluate and develop their market growth analysis strategies.

Distributed Fiber Optic Sensing Market Share by Geography

 Customer Landscape

Key Companies & Market Insights

Companies are implementing various strategies, such as strategic alliances, partnerships, mergers and acquisitions, geographical expansion, and product/service launches, to enhance their presence in the market.

AFL Telecommunications GmbH - The company offers distributed fiber optic sensing solutions that are suitable for a wide variety of applications that would monitor for temperature, strain, acoustics and pressure.

The market research and growth report includes detailed analyses of the competitive landscape of the market and information about key companies, including:

  • AP Sensing GmbH
  • Bandweaver
  • Brugg Kabel AG
  • Corning Inc.
  • DarkPulse Inc
  • Halliburton Co.
  • Intelligent Fiber Optic Systems Corp.
  • Luna Innovations Inc.
  • Makai Ocean Engineering Inc.
  • NP Photonics
  • OFS Fitel LLC
  • Omnisens SA
  • QinetiQ Ltd.
  • Schlumberger Ltd.
  • Silixa Ltd.
  • Sumitomo Electric Industries Ltd.
  • wenglor sensoric electronic devices GmbH
  • Yokogawa Electric Corp.
  • Ziebel

Qualitative and quantitative analysis of companies has been conducted to help clients understand the wider business environment as well as the strengths and weaknesses of key market players. Data is qualitatively analyzed to categorize companies as pure play, category-focused, industry-focused, and diversified; it is quantitatively analyzed to categorize companies as dominant, leading, strong, tentative, and weak.

Research Analyst Overview

The market is experiencing significant growth due to its increasing adoption in various industries, including oil & gas, infrastructure, power and utilities, environmental monitoring, civil infrastructure, and the energy sector. This technology leverages the Raman scattering effect and Brillouin scattering to provide real-time thermal rating, temperature sensing, acoustic sensing, and vibration sensing. In the oil & gas industry, distributed fiber optic sensing is used for condition monitoring in crude oil pipelines, enabling early detection of leaks and reducing maintenance costs. In the infrastructure sector, it is employed for structural health monitoring, ensuring the safety and durability of bridges, tunnels, and buildings. The power and utilities sector benefits from fiber optic sensing for temperature monitoring and condition assessment of power lines and transformers, improving efficiency and reducing downtime. In the environmental monitoring sector, it is used for real-time monitoring of air and water quality, ensuring regulatory compliance and public safety.

Additionally, the military expansion and the automotive and aerospace sectors are also adopting fiber optic sensing for various applications, such as military equipment and border security, and in the automotive industry for tire pressure monitoring and vehicle health assessment. The medical industry, renewable energy industry, nuclear energy industry, and civil sector are other potential markets for this technology. Fiber optic sensing technology's ability to provide accurate, real-time data makes it an essential tool for various industries, driving its market growth. The use of Raman effect technology and Rayleigh effect technology further enhances its capabilities, enabling applications in distributed acoustic sensors, steam-assisted gravity drainage, cyclic steam stimulation, and more.

Moreover, the infrastructure industry is increasingly leveraging advanced technologies like intelligent distributed acoustic sensors and Raman-based sensing for enhanced monitoring and safety. In the aerospace sector, optics sensing and fiber optics technology are vital for structural integrity assessments and environmental monitoring. Distributed temperature sensing systems and distributed fiber optic acoustic sensors are particularly useful in utility and substation settings, enabling real-time data collection and analysis. Additionally, vibration sensing technology plays a crucial role in the upstream oil and gas industry, helping detect anomalies and optimize operations. By integrating these innovative sensing solutions, organizations can significantly improve their infrastructure management and response to potential threats, ensuring reliability and efficiency across various sectors.

Market Scope

Report Coverage

Details

Page number

173

Base year

2023

Historic period

2018-2022

Forecast period

2024-2028

Growth momentum & CAGR

Accelerate at a CAGR of 7.08%

Market Growth 2024-2028

USD 489.9 million

Market structure

Fragmented

YoY growth 2023-2024(%)

6.49

Regional analysis

North America, Europe, APAC, Middle East and Africa, and South America

Performing market contribution

North America at 35%

Key countries

US, China, Canada, UK, and Germany

Competitive landscape

Leading Companies, Market Positioning of Companies, Competitive Strategies, and Industry Risks

Key companies profiled

AFL Telecommunications GmbH, AP Sensing GmbH, Bandweaver, Brugg Kabel AG, Corning Inc., DarkPulse Inc, Halliburton Co., Intelligent Fiber Optic Systems Corp., Luna Innovations Inc., Makai Ocean Engineering Inc., NP Photonics, OFS Fitel LLC, Omnisens SA, QinetiQ Ltd., Schlumberger Ltd., Silixa Ltd., Sumitomo Electric Industries Ltd., wenglor sensoric electronic devices GmbH, Yokogawa Electric Corp., and Ziebel

Market dynamics

Parent market analysis, market growth inducers and obstacles, market forecast, fast-growing and slow-growing segment analysis, COVID-19 impact and recovery analysis and future consumer dynamics, market condition analysis for the forecast period

Customization purview

If our market report has not included the data that you are looking for, you can reach out to our analysts and get segments customized.

Request Free Sample

What are the Key Data Covered in this Market Research and Growth Report?

  • CAGR of the market during the forecast period
  • Detailed information on factors that will drive the market growth and forecasting between 2024 and 2028
  • Precise estimation of the size of the market  and its contribution of the market in focus to the parent market
  • Accurate predictions about upcoming market growth and trends and changes in consumer behaviour
  • Growth of the market across North America, Europe, APAC, Middle East and Africa, and South America
  • Thorough analysis of the market's competitive landscape and detailed information about companies
  • Comprehensive analysis of factors that will challenge the growth of market companies

We can help! Our analysts can customize this market research report to meet your requirements. Get in touch

1 Executive Summary

  • 1.1 Market overview
    • Executive Summary - Chart on Market Overview
    • Executive Summary - Data Table on Market Overview
    • Executive Summary - Chart on Global Market Characteristics
    • Executive Summary - Chart on Market by Geography
    • Executive Summary - Chart on Market Segmentation by Application
    • Executive Summary - Chart on Market Segmentation by End-user
    • Executive Summary - Chart on Incremental Growth
    • Executive Summary - Data Table on Incremental Growth
    • Executive Summary - Chart on Company Market Positioning

2 Market Landscape

  • 2.1 Market ecosystem
    • Parent Market
    • Data Table on - Parent Market
  • 2.2 Market characteristics
    • Market characteristics analysis
  • 2.3 Value chain analysis
    • Value Chain Analysis

3 Market Sizing

  • 3.1 Market definition
    • Offerings of companies included in the market definition
  • 3.2 Market segment analysis
    • Market segments
  • 3.3 Market size 2023
    • 3.4 Market outlook: Forecast for 2023-2028
      • Chart on Global - Market size and forecast 2023-2028 ($ million)
      • Data Table on Global - Market size and forecast 2023-2028 ($ million)
      • Chart on Global Market: Year-over-year growth 2023-2028 (%)
      • Data Table on Global Market: Year-over-year growth 2023-2028 (%)

    4 Historic Market Size

    • 4.1 Global Distributed Fiber Optic Sensing Market 2018 - 2022
      • Historic Market Size - Data Table on Global Distributed Fiber Optic Sensing Market 2018 - 2022 ($ million)
    • 4.2 Application segment analysis 2018 - 2022
      • Historic Market Size - Application Segment 2018 - 2022 ($ million)
    • 4.3 End-user segment analysis 2018 - 2022
      • Historic Market Size - End-user Segment 2018 - 2022 ($ million)
    • 4.4 Geography segment analysis 2018 - 2022
      • Historic Market Size - Geography Segment 2018 - 2022 ($ million)
    • 4.5 Country segment analysis 2018 - 2022
      • Historic Market Size - Country Segment 2018 - 2022 ($ million)

    5 Five Forces Analysis

    • 5.1 Five forces summary
      • Five forces analysis - Comparison between 2023 and 2028
    • 5.2 Bargaining power of buyers
      • Bargaining power of buyers - Impact of key factors 2023 and 2028
    • 5.3 Bargaining power of suppliers
      • Bargaining power of suppliers - Impact of key factors in 2023 and 2028
    • 5.4 Threat of new entrants
      • Threat of new entrants - Impact of key factors in 2023 and 2028
    • 5.5 Threat of substitutes
      • Threat of substitutes - Impact of key factors in 2023 and 2028
    • 5.6 Threat of rivalry
      • Threat of rivalry - Impact of key factors in 2023 and 2028
    • 5.7 Market condition
      • Chart on Market condition - Five forces 2023 and 2028

    6 Market Segmentation by Application

    • 6.1 Market segments
      • Chart on Application - Market share 2023-2028 (%)
      • Data Table on Application - Market share 2023-2028 (%)
    • 6.2 Comparison by Application
      • Chart on Comparison by Application
      • Data Table on Comparison by Application
    • 6.3 Temperature sensing - Market size and forecast 2023-2028
      • Chart on Temperature sensing - Market size and forecast 2023-2028 ($ million)
      • Data Table on Temperature sensing - Market size and forecast 2023-2028 ($ million)
      • Chart on Temperature sensing - Year-over-year growth 2023-2028 (%)
      • Data Table on Temperature sensing - Year-over-year growth 2023-2028 (%)
    • 6.4 Acoustic sensing - Market size and forecast 2023-2028
      • Chart on Acoustic sensing - Market size and forecast 2023-2028 ($ million)
      • Data Table on Acoustic sensing - Market size and forecast 2023-2028 ($ million)
      • Chart on Acoustic sensing - Year-over-year growth 2023-2028 (%)
      • Data Table on Acoustic sensing - Year-over-year growth 2023-2028 (%)
    • 6.5 Other - Market size and forecast 2023-2028
      • Chart on Other - Market size and forecast 2023-2028 ($ million)
      • Data Table on Other - Market size and forecast 2023-2028 ($ million)
      • Chart on Other - Year-over-year growth 2023-2028 (%)
      • Data Table on Other - Year-over-year growth 2023-2028 (%)
    • 6.6 Market opportunity by Application
      • Market opportunity by Application ($ million)
      • Data Table on Market opportunity by Application ($ million)

    7 Market Segmentation by End-user

    • 7.1 Market segments
      • Chart on End-user - Market share 2023-2028 (%)
      • Data Table on End-user - Market share 2023-2028 (%)
    • 7.2 Comparison by End-user
      • Chart on Comparison by End-user
      • Data Table on Comparison by End-user
    • 7.3 Oil and gas - Market size and forecast 2023-2028
      • Chart on Oil and gas - Market size and forecast 2023-2028 ($ million)
      • Data Table on Oil and gas - Market size and forecast 2023-2028 ($ million)
      • Chart on Oil and gas - Year-over-year growth 2023-2028 (%)
      • Data Table on Oil and gas - Year-over-year growth 2023-2028 (%)
    • 7.4 Power and utility - Market size and forecast 2023-2028
      • Chart on Power and utility - Market size and forecast 2023-2028 ($ million)
      • Data Table on Power and utility - Market size and forecast 2023-2028 ($ million)
      • Chart on Power and utility - Year-over-year growth 2023-2028 (%)
      • Data Table on Power and utility - Year-over-year growth 2023-2028 (%)
    • 7.5 Civil engineering - Market size and forecast 2023-2028
      • Chart on Civil engineering - Market size and forecast 2023-2028 ($ million)
      • Data Table on Civil engineering - Market size and forecast 2023-2028 ($ million)
      • Chart on Civil engineering - Year-over-year growth 2023-2028 (%)
      • Data Table on Civil engineering - Year-over-year growth 2023-2028 (%)
    • 7.6 Industrial - Market size and forecast 2023-2028
      • Chart on Industrial - Market size and forecast 2023-2028 ($ million)
      • Data Table on Industrial - Market size and forecast 2023-2028 ($ million)
      • Chart on Industrial - Year-over-year growth 2023-2028 (%)
      • Data Table on Industrial - Year-over-year growth 2023-2028 (%)
    • 7.7 Safety and security - Market size and forecast 2023-2028
      • Chart on Safety and security - Market size and forecast 2023-2028 ($ million)
      • Data Table on Safety and security - Market size and forecast 2023-2028 ($ million)
      • Chart on Safety and security - Year-over-year growth 2023-2028 (%)
      • Data Table on Safety and security - Year-over-year growth 2023-2028 (%)
    • 7.8 Market opportunity by End-user
      • Market opportunity by End-user ($ million)
      • Data Table on Market opportunity by End-user ($ million)

    8 Customer Landscape

    • 8.1 Customer landscape overview
      • Analysis of price sensitivity, lifecycle, customer purchase basket, adoption rates, and purchase criteria

    9 Geographic Landscape

    • 9.1 Geographic segmentation
      • Chart on Market share by geography 2023-2028 (%)
      • Data Table on Market share by geography 2023-2028 (%)
    • 9.2 Geographic comparison
      • Chart on Geographic comparison
      • Data Table on Geographic comparison
    • 9.3 North America - Market size and forecast 2023-2028
      • Chart on North America - Market size and forecast 2023-2028 ($ million)
      • Data Table on North America - Market size and forecast 2023-2028 ($ million)
      • Chart on North America - Year-over-year growth 2023-2028 (%)
      • Data Table on North America - Year-over-year growth 2023-2028 (%)
    • 9.4 Europe - Market size and forecast 2023-2028
      • Chart on Europe - Market size and forecast 2023-2028 ($ million)
      • Data Table on Europe - Market size and forecast 2023-2028 ($ million)
      • Chart on Europe - Year-over-year growth 2023-2028 (%)
      • Data Table on Europe - Year-over-year growth 2023-2028 (%)
    • 9.5 APAC - Market size and forecast 2023-2028
      • Chart on APAC - Market size and forecast 2023-2028 ($ million)
      • Data Table on APAC - Market size and forecast 2023-2028 ($ million)
      • Chart on APAC - Year-over-year growth 2023-2028 (%)
      • Data Table on APAC - Year-over-year growth 2023-2028 (%)
    • 9.6 Middle East and Africa - Market size and forecast 2023-2028
      • Chart on Middle East and Africa - Market size and forecast 2023-2028 ($ million)
      • Data Table on Middle East and Africa - Market size and forecast 2023-2028 ($ million)
      • Chart on Middle East and Africa - Year-over-year growth 2023-2028 (%)
      • Data Table on Middle East and Africa - Year-over-year growth 2023-2028 (%)
    • 9.7 South America - Market size and forecast 2023-2028
      • Chart on South America - Market size and forecast 2023-2028 ($ million)
      • Data Table on South America - Market size and forecast 2023-2028 ($ million)
      • Chart on South America - Year-over-year growth 2023-2028 (%)
      • Data Table on South America - Year-over-year growth 2023-2028 (%)
    • 9.8 US - Market size and forecast 2023-2028
      • Chart on US - Market size and forecast 2023-2028 ($ million)
      • Data Table on US - Market size and forecast 2023-2028 ($ million)
      • Chart on US - Year-over-year growth 2023-2028 (%)
      • Data Table on US - Year-over-year growth 2023-2028 (%)
    • 9.9 China - Market size and forecast 2023-2028
      • Chart on China - Market size and forecast 2023-2028 ($ million)
      • Data Table on China - Market size and forecast 2023-2028 ($ million)
      • Chart on China - Year-over-year growth 2023-2028 (%)
      • Data Table on China - Year-over-year growth 2023-2028 (%)
    • 9.10 Canada - Market size and forecast 2023-2028
      • Chart on Canada - Market size and forecast 2023-2028 ($ million)
      • Data Table on Canada - Market size and forecast 2023-2028 ($ million)
      • Chart on Canada - Year-over-year growth 2023-2028 (%)
      • Data Table on Canada - Year-over-year growth 2023-2028 (%)
    • 9.11 UK - Market size and forecast 2023-2028
      • Chart on UK - Market size and forecast 2023-2028 ($ million)
      • Data Table on UK - Market size and forecast 2023-2028 ($ million)
      • Chart on UK - Year-over-year growth 2023-2028 (%)
      • Data Table on UK - Year-over-year growth 2023-2028 (%)
    • 9.12 Germany - Market size and forecast 2023-2028
      • Chart on Germany - Market size and forecast 2023-2028 ($ million)
      • Data Table on Germany - Market size and forecast 2023-2028 ($ million)
      • Chart on Germany - Year-over-year growth 2023-2028 (%)
      • Data Table on Germany - Year-over-year growth 2023-2028 (%)
    • 9.13 Market opportunity by geography
      • Market opportunity by geography ($ million)
      • Data Tables on Market opportunity by geography ($ million)

    10 Drivers, Challenges, and Opportunity/Restraints

    • 10.1 Market drivers
      • 10.2 Market challenges
        • 10.3 Impact of drivers and challenges
          • Impact of drivers and challenges in 2023 and 2028
        • 10.4 Market opportunities/restraints

          11 Competitive Landscape

          • 11.1 Overview
            • 11.2 Competitive Landscape
              • Overview on criticality of inputs and factors of differentiation
            • 11.3 Landscape disruption
              • Overview on factors of disruption
            • 11.4 Industry risks
              • Impact of key risks on business

            12 Competitive Analysis

            • 12.1 Companies profiled
              • Companies covered
            • 12.2 Market positioning of companies
              • Matrix on companies position and classification
            • 12.3 AFL Telecommunications GmbH
              • AFL Telecommunications GmbH - Overview
              • AFL Telecommunications GmbH - Product / Service
              • AFL Telecommunications GmbH - Key offerings
            • 12.4 AP Sensing GmbH
              • AP Sensing GmbH - Overview
              • AP Sensing GmbH - Product / Service
              • AP Sensing GmbH - Key offerings
            • 12.5 Bandweaver
              • Bandweaver - Overview
              • Bandweaver - Product / Service
              • Bandweaver - Key offerings
            • 12.6 Halliburton Co.
              • Halliburton Co. - Overview
              • Halliburton Co. - Business segments
              • Halliburton Co. - Key news
              • Halliburton Co. - Key offerings
              • Halliburton Co. - Segment focus
            • 12.7 Luna Innovations Inc.
              • Luna Innovations Inc. - Overview
              • Luna Innovations Inc. - Product / Service
              • Luna Innovations Inc. - Key offerings
            • 12.8 OFS Fitel LLC
              • OFS Fitel LLC - Overview
              • OFS Fitel LLC - Product / Service
              • OFS Fitel LLC - Key offerings
            • 12.9 Omnisens SA
              • Omnisens SA - Overview
              • Omnisens SA - Product / Service
              • Omnisens SA - Key offerings
            • 12.10 QinetiQ Ltd.
              • QinetiQ Ltd. - Overview
              • QinetiQ Ltd. - Business segments
              • QinetiQ Ltd. - Key news
              • QinetiQ Ltd. - Key offerings
              • QinetiQ Ltd. - Segment focus
            • 12.11 Schlumberger Ltd.
              • Schlumberger Ltd. - Overview
              • Schlumberger Ltd. - Business segments
              • Schlumberger Ltd. - Key news
              • Schlumberger Ltd. - Key offerings
              • Schlumberger Ltd. - Segment focus
            • 12.12 Yokogawa Electric Corp.
              • Yokogawa Electric Corp. - Overview
              • Yokogawa Electric Corp. - Business segments
              • Yokogawa Electric Corp. - Key news
              • Yokogawa Electric Corp. - Key offerings
              • Yokogawa Electric Corp. - Segment focus

            13 Appendix

            • 13.1 Scope of the report
              • 13.2 Inclusions and exclusions checklist
                • Inclusions checklist
                • Exclusions checklist
              • 13.3 Currency conversion rates for US$
                • Currency conversion rates for US$
              • 13.4 Research methodology
                • Research methodology
              • 13.5 Data procurement
                • Information sources
              • 13.6 Data validation
                • Data validation
              • 13.7 Validation techniques employed for market sizing
                • Validation techniques employed for market sizing
              • 13.8 Data synthesis
                • Data synthesis
              • 360 degree market analysis
                • 360 degree market analysis
              • 13.10 List of abbreviations
                • List of abbreviations

              Research Methodology

              Technavio presents a detailed picture of the market by way of study, synthesis, and summation of data from multiple sources. The analysts have presented the various facets of the market with a particular focus on identifying the key industry influencers. The data thus presented is comprehensive, reliable, and the result of extensive research, both primary and secondary.

              INFORMATION SOURCES

              Primary sources

              • Manufacturers and suppliers
              • Channel partners
              • Industry experts
              • Strategic decision makers

              Secondary sources

              • Industry journals and periodicals
              • Government data
              • Financial reports of key industry players
              • Historical data
              • Press releases

              DATA ANALYSIS

              Data Synthesis

              • Collation of data
              • Estimation of key figures
              • Analysis of derived insights

              Data Validation

              • Triangulation with data models
              • Reference against proprietary databases
              • Corroboration with industry experts

              REPORT WRITING

              Qualitative

              • Market drivers
              • Market challenges
              • Market trends
              • Five forces analysis

              Quantitative

              • Market size and forecast
              • Market segmentation
              • Geographical insights
              • Competitive landscape

              Interested in this report?

              Get your sample now to see our research methodology and insights!

              Download Now

              Frequently Asked Questions

              Distributed Fiber Optic Sensing market growth will increase by $ 489.9 mn during 2024-2028.

              The Distributed Fiber Optic Sensing market is expected to grow at a CAGR of 7.08% during 2024-2028.

              Distributed Fiber Optic Sensing market is segmented by Application( Temperature sensing, Acoustic sensing, Other) End-user( Oil and gas, Power and utility, Civil engineering, Industrial, Safety and security)

              AFL Telecommunications GmbH, AP Sensing GmbH, Bandweaver, Brugg Kabel AG, Corning Inc., DarkPulse Inc, Halliburton Co., Intelligent Fiber Optic Systems Corp., Luna Innovations Inc., Makai Ocean Engineering Inc., NP Photonics, OFS Fitel LLC, Omnisens SA, QinetiQ Ltd., Schlumberger Ltd., Silixa Ltd., Sumitomo Electric Industries Ltd., wenglor sensoric electronic devices GmbH, Yokogawa Electric Corp., Ziebel are a few of the key vendors in the Distributed Fiber Optic Sensing market.

              North America will register the highest growth rate of 35% among the other regions. Therefore, the Distributed Fiber Optic Sensing market in North America is expected to garner significant business opportunities for the vendors during the forecast period.

              US, China, Canada, UK, Germany

              • Surging demand for infrastructure sectorDistributed fiber optic sensors are increasingly being used in the infrastructure sector is the driving factor this market.
              • especially for SHM. To gain a better understanding of the structural status and manage the infrastructure in an economically efficient manner is the driving factor this market.
              • distributed sensors are being used more in this industry. Pipelines is the driving factor this market.
              • bridges is the driving factor this market.
              • dams is the driving factor this market.
              • and geotechnical structures are the main areas where SHM is becoming more prevalent in the civil engineering sector. The capacity to simultaneously monitor strain is the driving factor this market.
              • temperature is the driving factor this market.
              • or pressure over a large number of sites is the main benefit of next-generation sensors. The main drivers for the increased use of distributed sensing in the civil engineering sector are the ability to deploy distributed sensors in any type of difficult environment and the capacity to track structural issues in real-time. Such factors contribute to the growth of the global distributed fiber optic sensing market during the forecast period. is the driving factor this market.

              The Distributed Fiber Optic Sensing market vendors should focus on grabbing business opportunities from the Temperature sensing segment as it accounted for the largest market share in the base year.