
Distributed Solar Power Generation Market Size 2025-2029
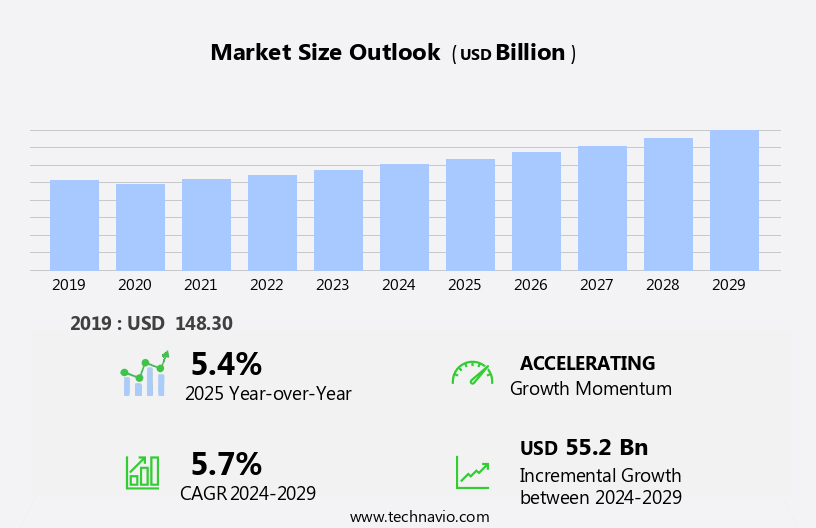
The distributed solar power generation market size is forecast to increase by USD 55.2 billion at a CAGR of 5.7% between 2024 and 2029.
- The market is experiencing significant growth, driven by increasing investments in renewable energy and the expanding adoption of microgrids. This shift towards decentralized energy production is particularly notable in regions with robust solar resources and supportive regulatory frameworks. However, the market is not without complexities. The integration of distributed solar photovoltaic (PV) systems into the grid necessitates careful management of components such as energy storage, inverters, and power electronics. These complexities add to the cost of distributed solar projects and necessitate ongoing operational and maintenance efforts.
- Despite these challenges, companies seeking to capitalize on this market opportunity can benefit from strategic partnerships, technological innovation, and a deep understanding of local regulatory environments. By navigating these complexities effectively, players in the market can position themselves to capitalize on the long-term growth potential of this sector.
What will be the Size of the Distributed Solar Power Generation Market during the forecast period?
- The market encompasses a range of technologies and applications, including solar asset management, building-integrated photovoltaics, solar water pumps, power towers, solar cookers, and photovoltaic thermal. Solar irradiance and resource assessment play crucial roles in optimizing system performance and energy yield. Advancements in solar technology continue to emerge, such as parabolic troughs, solar glazing, and solar agriculture. Blockchain technology is also being explored for peer-to-peer energy trading and energy resilience. Circular economy principles are increasingly being applied to the solar industry through the use of renewable energy certificates and life cycle analysis. Solar thermal power, solar awnings, and energy sharing are other areas of growth.
- Electric vehicle charging, solar reits, and peak shaving are among the applications driving innovation in the market. Energy trading, solar irrigation, and carbon footprint reduction are key considerations for businesses adopting solar power. Energy arbitrage, performance optimization, and solar charging stations are essential components of grid reliability and microgrid management. Flow batteries and ESG investing are also gaining traction in the sector. Solar desalination and solar facades offer solutions for water scarcity and energy efficiency, respectively. Green bonds and system sizing are important financing and planning tools for businesses investing in solar power. Thermal energy storage and grid reliability are critical for ensuring the stability and effectiveness of distributed solar power systems.
- Overall, the market is dynamic and evolving, with numerous opportunities for businesses to reduce their carbon footprint and enhance their energy resilience.
How is this Distributed Solar Power Generation Industry segmented?
The distributed solar power generation industry research report provides comprehensive data (region-wise segment analysis), with forecasts and estimates in "USD billion" for the period 2025-2029, as well as historical data from 2019-2023 for the following segments.
- Installation Sites
- On-grid
- Off-grid
- End-user
- Commercial
- Industrial
- Residential
- Type
- Mono-SI
- p-Si
- A-Si
- CVP
- Location
- Ground mounted
- Roof-top
- Geography
- North America
- US
- Canada
- Europe
- France
- Germany
- UK
- Middle East and Africa
- APAC
- Australia
- China
- India
- Japan
- South Korea
- South America
- Rest of World (ROW)
- North America
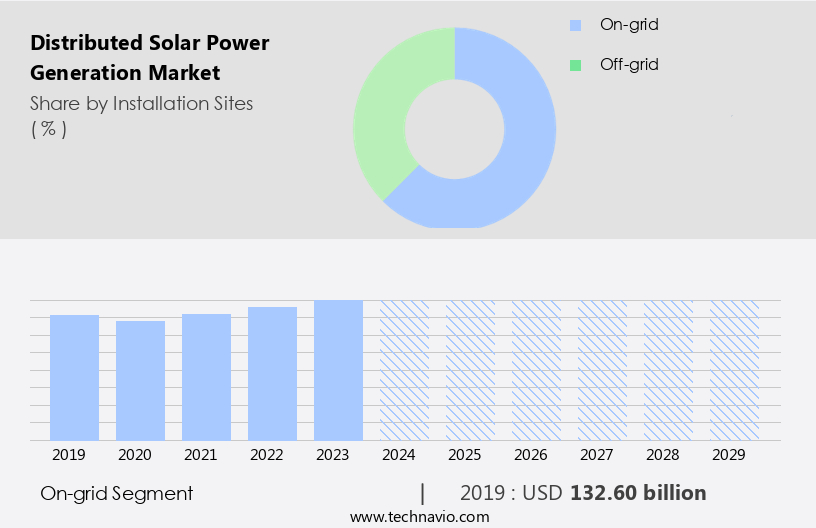
By Installation Sites Insights
The on-grid segment is estimated to witness significant growth during the forecast period.
In the realm of renewable energy, on-grid distributed solar power systems have emerged as a cost-effective solution for residential consumers. These systems, which operate in conjunction with the grid, enable homes to utilize solar energy while remaining connected to the power grid. Solar panels installed in homes are linked to appliances, meters, and the grid, providing substantial cost savings by eliminating the need for batteries and standalone equipment. The installation and maintenance of such equipment add to the overall cost, making on-grid distributed solar systems a more affordable and simpler alternative. Moreover, the integration of advanced technologies, such as machine learning, energy management systems, and data analytics, enhances the efficiency and performance of these systems.
Energy service companies and solar developers are increasingly embracing these technologies to optimize energy production and consumption. The adoption of renewable portfolio standards, net metering, power purchase agreements, and feed-in tariffs further incentivizes the growth of the on-grid distributed solar market. Grid modernization and the integration of distributed energy resources, such as virtual power plants, hybrid systems, and community solar, are also driving the market forward. In the commercial sector, the implementation of on-grid distributed solar systems is gaining traction due to their ability to reduce energy costs and promote energy independence. Industrial solar, solar thermal, and concentrated solar power are some of the popular applications in this segment.
The integration of the Internet of Things, energy storage, and demand response systems is revolutionizing the on-grid distributed solar market by enabling better energy management and grid stability. The future of renewable energy lies in the seamless integration of these advanced technologies with on-grid distributed solar systems.
Get a glance at the market report of share of various segments Request Free Sample
The On-grid segment was valued at USD 132.60 billion in 2019 and showed a gradual increase during the forecast period.
Regional Analysis
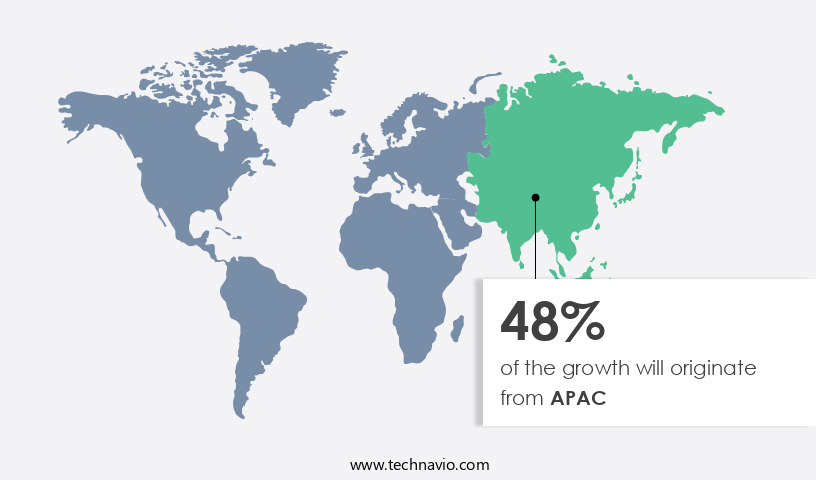
APAC is estimated to contribute 48% to the growth of the global market during the forecast period.Technavio’s analysts have elaborately explained the regional trends and drivers that shape the market during the forecast period.
For more insights on the market size of various regions, Request Free Sample
In the dynamic energy landscape, distributed solar power generation in Asia Pacific (APAC) is experiencing significant growth. China, Japan, and India are key contributors to this market expansion. The lack of dependable grid infrastructure in the region has led to the increasing adoption of off-grid and microgrids, which supply electricity for residential and industrial use in remote areas through renewable energy sources like solar photovoltaics (PV). Moreover, the rising carbon emissions in China and India have spurred these countries to prioritize renewables for power generation. Solar PV is increasingly being utilized in off-grid and microgrid systems to reduce reliance on traditional energy sources and decrease carbon footprints.
Grid modernization initiatives and the implementation of net metering, power purchase agreements, and feed-in tariffs have further bolstered the market's growth. Energy efficiency, energy management, and data analytics play crucial roles in optimizing the performance of these distributed solar power systems. Renewable energy sources, including solar, are becoming increasingly integral to the energy transition, with solar water heating, solar consultants, and solar trackers contributing to the sector's advancement. Solar panels, solar inverters, and community solar projects are also gaining traction, as are industrial solar installations and solar cooperatives. The integration of smart grids, artificial intelligence, energy storage, and demand response systems is enhancing the overall efficiency and reliability of distributed solar power generation.
The Internet of Things (IoT) and energy security are also essential considerations in the development of these systems. In summary, the market in APAC is poised for substantial growth, driven by the adoption of renewable energy sources in off-grid and microgrid systems, government initiatives, and advancements in technology.
Market Dynamics
Our researchers analyzed the data with 2024 as the base year, along with the key drivers, trends, and challenges. A holistic analysis of drivers will help companies refine their marketing strategies to gain a competitive advantage.
What are the key market drivers leading to the rise in the adoption of Distributed Solar Power Generation Industry?
- Increasing investments in renewable energy is the key driver of the market.
- The global energy landscape has undergone significant transformation over the past two decades, with energy efficiency playing a pivotal role in maintaining a balance between supply and demand. The market is experiencing substantial growth, driven primarily by increased investments in renewable energy. In 2024, global energy investment is projected to surpass USD3 trillion for the first time, with approximately USD2 trillion allocated to clean energy technologies and infrastructure. This investment surge is primarily due to the growing spending on renewable power, grids, and storage, which now surpasses total spending on oil, gas, and coal.
- These substantial financial commitments are enabling the expansion and enhancement of distributed solar power systems, making them more efficient and accessible. The market's growth is a testament to the global shift towards cleaner, renewable energy sources.
What are the market trends shaping the Distributed Solar Power Generation Industry?
- Growing adoption of microgrids is the upcoming market trend.
- Microgrids, which are small-scale power systems with defined boundaries, play a significant role in ensuring power continuity in areas with unstable power grids. These systems can operate independently or collaboratively with other microgrids, and they can connect and disconnect from the main power grid to function in grid-connected and island modes. In island mode, microgrids rely on their own generation and storage resources, making them crucial during power outages. Microgrids' importance is heightened in regions where power instability is common.
- These systems can be integrated with the main power grid to form hybrid microgrids, enhancing overall grid stability and reliability. Microgrids' ability to operate independently or collaboratively, and their capacity to shift between grid-connected and island modes, make them valuable assets in maintaining power supply and ensuring business continuity.
What challenges does the Distributed Solar Power Generation Industry face during its growth?
- Complexities associated with distributed solar PV system components is a key challenge affecting the industry growth.
- Distributed solar power generation involves the use of solar photovoltaic (PV) systems to generate electricity at the point of consumption. However, the reliability of these systems can be compromised due to the failure of various components, including solar PV modules and inverters. Exposure to harsh climatic conditions can lead to the degradation of distributed solar PV modules, resulting in downtime and reduced power generation. The back sheet of these modules is particularly susceptible to risks such as chalking and cracking, which can significantly impact their performance.
- The quality of components used in the manufacture of distributed solar PV modules is crucial in mitigating these risks. Poor durability, use of low-quality materials, and external damage are some factors that can contribute to component failure. As a professional assistant, it is important to emphasize the significance of utilizing high-quality components in distributed solar PV systems to ensure optimal performance and longevity.
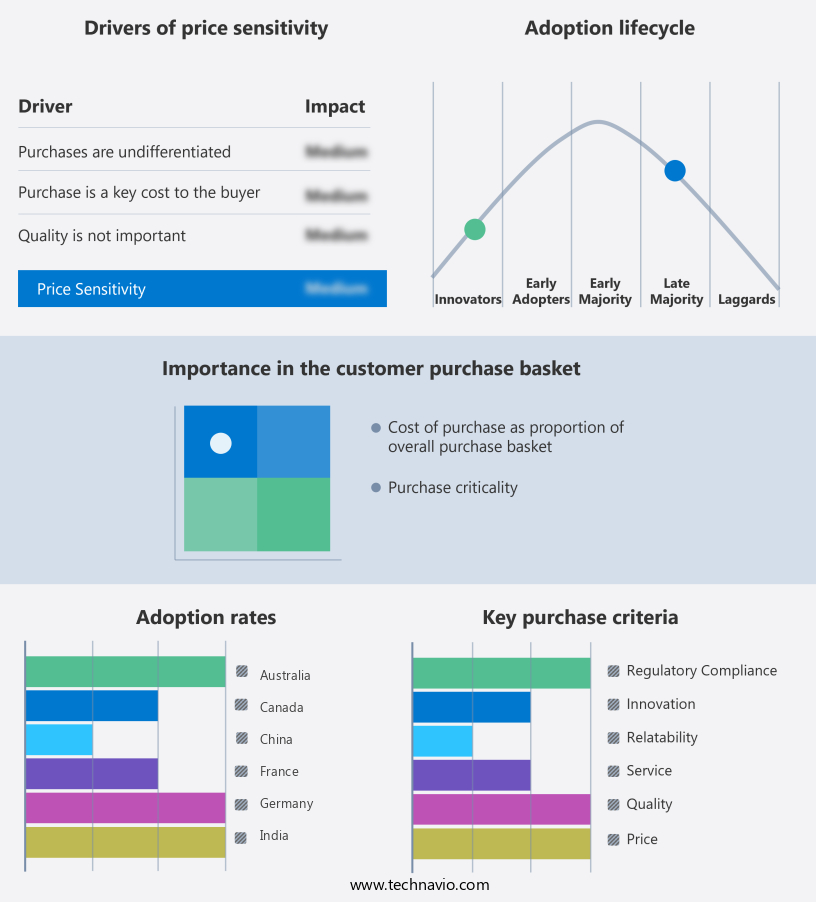
Exclusive Customer Landscape
The distributed solar power generation market forecasting report includes the adoption lifecycle of the market, covering from the innovator’s stage to the laggard’s stage. It focuses on adoption rates in different regions based on penetration. Furthermore, the distributed solar power generation market report also includes key purchase criteria and drivers of price sensitivity to help companies evaluate and develop their market growth analysis strategies.
Customer Landscape
Key Companies & Market Insights
Companies are implementing various strategies, such as strategic alliances, distributed solar power generation market forecast, partnerships, mergers and acquisitions, geographical expansion, and product/service launches, to enhance their presence in the industry.
AUXIN SOLAR Inc. - The company specializes in distributed solar power generation, providing innovative solutions through product offerings such as the AXN 10M perc mono series, AXN 10B Bifacial series, and AXN 6M perc mono series. These advanced solar panels deliver optimal energy efficiency and reliability, contributing significantly to the global transition towards renewable energy sources. With a commitment to technological innovation and sustainability, the company continues to expand its product portfolio, driving progress in the solar energy sector.
The industry research and growth report includes detailed analyses of the competitive landscape of the market and information about key companies, including:
- AUXIN SOLAR Inc.
- Canadian Solar Inc.
- E Solar
- Enphase Energy Inc.
- Freedom Solar LLC
- General Electric Co.
- Hanwha Corp.
- LG Corp.
- Panasonic Holdings Corp.
- Schneider Electric SE
- Sharp Corp.
- Silfab Solar Inc.
- Solar Panels Plus LLC
- Sungevity Inc.
- Sunnova Energy International Inc.
- Sunrun Inc.
- Tesla Inc.
- TotalEnergies SE
- Trina Solar Co. Ltd.
- Trinity Solar Inc.
Qualitative and quantitative analysis of companies has been conducted to help clients understand the wider business environment as well as the strengths and weaknesses of key industry players. Data is qualitatively analyzed to categorize companies as pure play, category-focused, industry-focused, and diversified; it is quantitatively analyzed to categorize companies as dominant, leading, strong, tentative, and weak.
Research Analyst Overview
Distributed solar power generation has emerged as a significant contributor to the global energy landscape, driven by various market dynamics and technological advancements. Carbon pricing and renewable portfolio standards have increased the demand for solar projects, as businesses and individuals seek to reduce their carbon emissions and transition to cleaner energy sources. Solar installers have responded by offering energy audits and power purchase agreements to help customers assess their energy needs and make the shift to solar more affordable. Grid modernization has also played a role in the growth of distributed solar, as utilities seek to integrate more renewable energy sources into their grids and improve energy efficiency.
Commercial and residential solar installations have become increasingly popular, with virtual power plants and hybrid systems providing solutions for larger energy demands. Solar farms, solar thermal, and concentrated solar power have also gained traction in the market, offering diverse options for businesses and individuals looking to generate their own power. Energy service companies have entered the scene, providing financing and consulting services to help solar projects get off the ground. Utility-scale solar and distributed energy resources have become key areas of focus, with machine learning and data analytics playing a crucial role in optimizing energy production and management.
Solar water heating and solar inverters have also gained popularity, as energy management and remote monitoring become increasingly important. The photovoltaic market has seen significant growth, with industrial solar and community solar projects becoming more common. Solar cooperatives and shared solar have emerged as innovative solutions for bringing solar power to a wider audience. Smart grids and the Internet of Things have enabled more efficient energy storage and demand response, enhancing the overall performance of distributed solar systems. Artificial intelligence and power electronics have also made their mark in the distributed solar market, improving system performance and reducing maintenance costs.
Energy security and energy independence have become key drivers for businesses and individuals seeking to generate their own power, particularly in regions with unreliable power grids. In conclusion, the market is dynamic and evolving, with various market forces and technological advancements shaping its growth. From carbon pricing and renewable portfolio standards to grid modernization and energy storage, the market is poised for continued expansion as businesses and individuals seek to reduce their carbon footprint and improve energy security.
|
Market Scope |
|
|
Report Coverage |
Details |
|
Page number |
237 |
|
Base year |
2024 |
|
Historic period |
2019-2023 |
|
Forecast period |
2025-2029 |
|
Growth momentum & CAGR |
Accelerate at a CAGR of 5.7% |
|
Market growth 2025-2029 |
USD 55.2 billion |
|
Market structure |
Fragmented |
|
YoY growth 2024-2025(%) |
5.4 |
|
Key countries |
China, Japan, India, US, South Korea, Germany, Canada, UK, Australia, and France |
|
Competitive landscape |
Leading Companies, Market Positioning of Companies, Competitive Strategies, and Industry Risks |
What are the Key Data Covered in this Distributed Solar Power Generation Market Research and Growth Report?
- CAGR of the Distributed Solar Power Generation industry during the forecast period
- Detailed information on factors that will drive the growth and forecasting between 2025 and 2029
- Precise estimation of the size of the market and its contribution of the industry in focus to the parent market
- Accurate predictions about upcoming growth and trends and changes in consumer behaviour
- Growth of the market across APAC, Europe, North America, South America, and Middle East and Africa
- Thorough analysis of the market’s competitive landscape and detailed information about companies
- Comprehensive analysis of factors that will challenge the distributed solar power generation market growth of industry companies
We can help! Our analysts can customize this distributed solar power generation market research report to meet your requirements.
 RIA -
RIA - 
