
Drag Reducing Agent Market Size 2026-2030
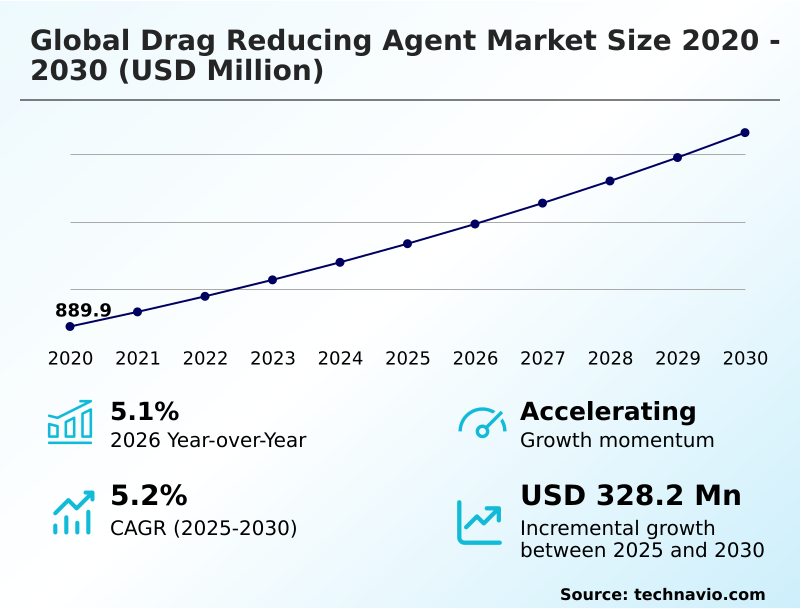
The drag reducing agent market size is valued to increase by USD 328.2 million, at a CAGR of 5.2% from 2025 to 2030. Expansion of global pipeline infrastructure and capacity enhancement will drive the drag reducing agent market.
Major Market Trends & Insights
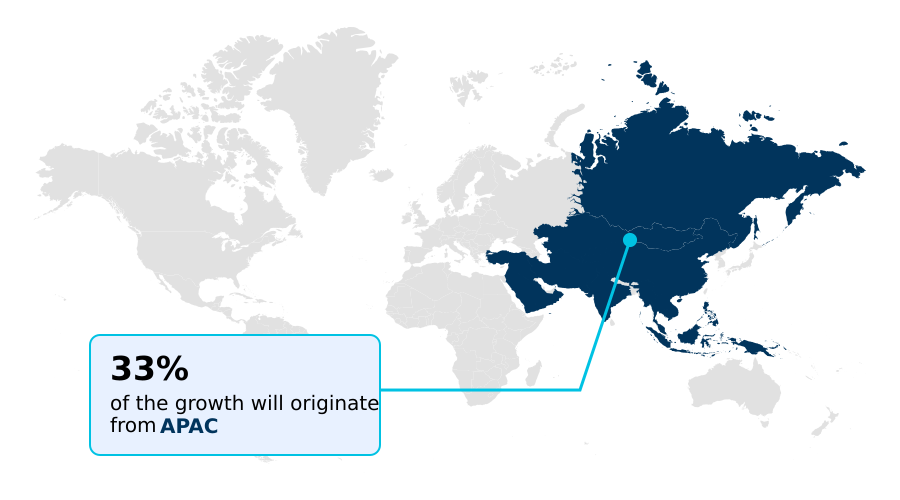
- APAC dominated the market and accounted for a 33.4% growth during the forecast period.
- By Application - Crude oil segment was valued at USD 632 million in 2024
- By Product - Polymer segment accounted for the largest market revenue share in 2024
Market Size & Forecast
- Market Opportunities: USD 572.8 million
- Market Future Opportunities: USD 328.2 million
- CAGR from 2025 to 2030 : 5.2%
Market Summary
- The drag reducing agent market is defined by the critical need to enhance fluid transport efficiency within aging and capacity-constrained pipeline infrastructure. These specialized additives, primarily high-molecular-weight polymers, are instrumental in managing frictional pressure drop, allowing operators to increase throughput without prohibitive capital expenditure.
- Key drivers include the global expansion of pipeline networks and the persistent focus on reducing operational costs, particularly pumping energy. A primary trend is the integration of digital monitoring and automated injection systems for real-time dosage optimization, improving both performance and cost-effectiveness.
- However, the market faces challenges from the mechanical degradation of polymers under high shear stress and stricter environmental regulations demanding more sustainable formulations.
- For example, a midstream operator facing penalties for delivery delays on a key route must weigh the long-term cost of installing a new pumping station against the immediate, flexible opex of a drag reducer program to boost capacity and meet contractual obligations. The industry's trajectory is toward smarter, more resilient, and environmentally-conscious flow assurance solutions.
What will be the Size of the Drag Reducing Agent Market during the forecast period?
Get Key Insights on Market Forecast (PDF) Get Free Sample
How is the Drag Reducing Agent Market Segmented?
The drag reducing agent industry research report provides comprehensive data (region-wise segment analysis), with forecasts and estimates in "USD million" for the period 2026-2030, as well as historical data from 2020-2024 for the following segments.
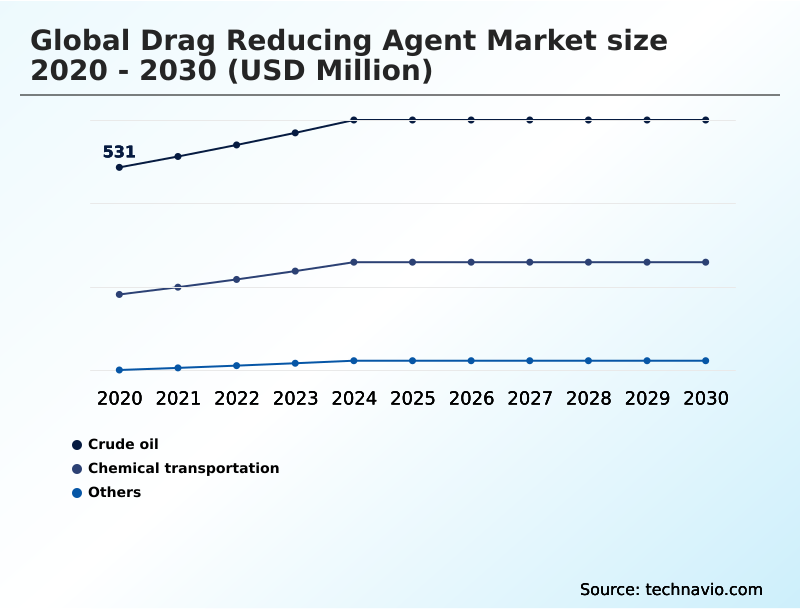
- Application
- Crude oil
- Chemical transportation
- Others
- Product
- Polymer
- Surfactant
- Others
- End-user
- Petrochemicals
- Industrial manufacturing
- Mining
- Agriculture
- Geography
- North America
- US
- Canada
- Mexico
- APAC
- China
- India
- Japan
- Europe
- Germany
- UK
- France
- Middle East and Africa
- Saudi Arabia
- UAE
- Turkey
- South America
- Brazil
- Colombia
- Argentina
- Rest of World (ROW)
- North America
By Application Insights
The crude oil segment is estimated to witness significant growth during the forecast period.
The crude oil segment is central to the drag reducing agent market, where managing frictional pressure drop is critical for operational economics.
These agents are essential for suppressing turbulent flow in pipelines, enabling the transport of higher volumes without requiring capital-intensive infrastructure expansion. Advanced formulations, including nanoparticle-enhanced additives and agents for rheology modification, are improving performance.
For instance, operators have documented throughput increases of up to 70% in certain applications, directly impacting revenue and asset utilization.
This chemical optimization strategy helps companies meet industrial decarbonization goals by reducing the energy intensity of petrochemical feedstock transport, supporting the broader push toward achieving net-zero emissions targets.
Effective solutions also streamline remote pump station management while ensuring product quality specification is maintained across long-distance networks.
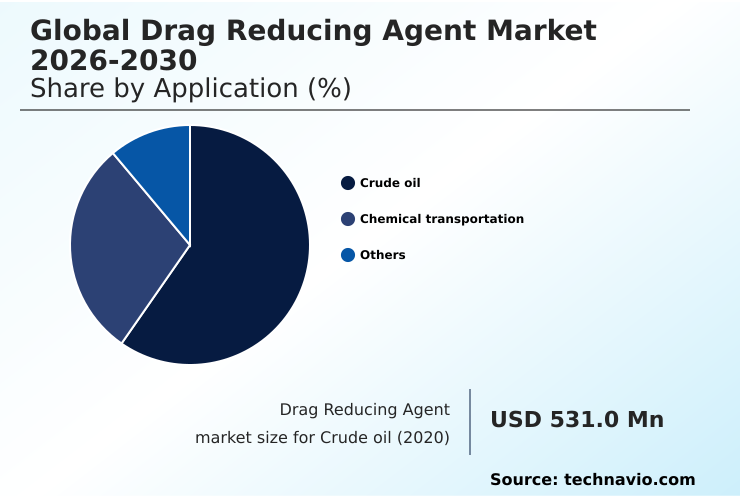
The Crude oil segment was valued at USD 632 million in 2024 and showed a gradual increase during the forecast period.
Regional Analysis
APAC is estimated to contribute 33.4% to the growth of the global market during the forecast period.Technavio’s analysts have elaborately explained the regional trends and drivers that shape the market during the forecast period.
See How Drag Reducing Agent Market Demand is Rising in APAC Get Free Sample
The geographic landscape of the drag reducing agent market is led by North America, which commands approximately 39% of the market, largely due to unconventional oil extraction and an extensive pipeline network requiring constant optimization.
This region's maturity drives innovation in low-temperature flow improvers and automated chemical injection systems. Concurrently, the APAC region is the fastest-growing, with a 6.3% growth rate, fueled by new infrastructure projects.
Drag reducing agents are also finding diverse applications globally, including in wastewater treatment flow management and enhancing firefighting water stream reach. This diversification is critical for fluid transport economics.
Success in this market depends on addressing both high-volume hydrocarbon transport, such as in subsea production tie-backs, and niche industrial needs, all while ensuring stringent process safety management and pipeline integrity management.
Market Dynamics
Our researchers analyzed the data with 2025 as the base year, along with the key drivers, trends, and challenges. A holistic analysis of drivers will help companies refine their marketing strategies to gain a competitive advantage.
- Strategic decision-making in the drag reducing agent market increasingly involves nuanced analysis beyond basic cost-per-gallon, focusing on total cost of ownership. Key considerations include the economic benefits of drag reducers in optimizing throughput with polymer additives, especially for challenging applications like heavy crude pipelines and multiphase flow.
- A critical technical debate centers on surfactant vs polymer drag reducers, with surfactants offering reusable properties in closed-loop systems, whereas polymers provide higher efficiency in single-pass pipelines.
- The move toward automation is a defining trend, with automated DRA injection system benefits including reduced chemical waste and improved performance consistency; some operators report that such systems reduce excess chemical usage by over 15% compared to manual-dosing schedules. This directly contributes to reducing energy costs in pipelines, a primary value proposition.
- The market is also expanding to address drag reduction for non-hydrocarbon fluids and improving the environmental impact of polymer DRAs, driven by a holistic approach to pipeline lifecycle management.
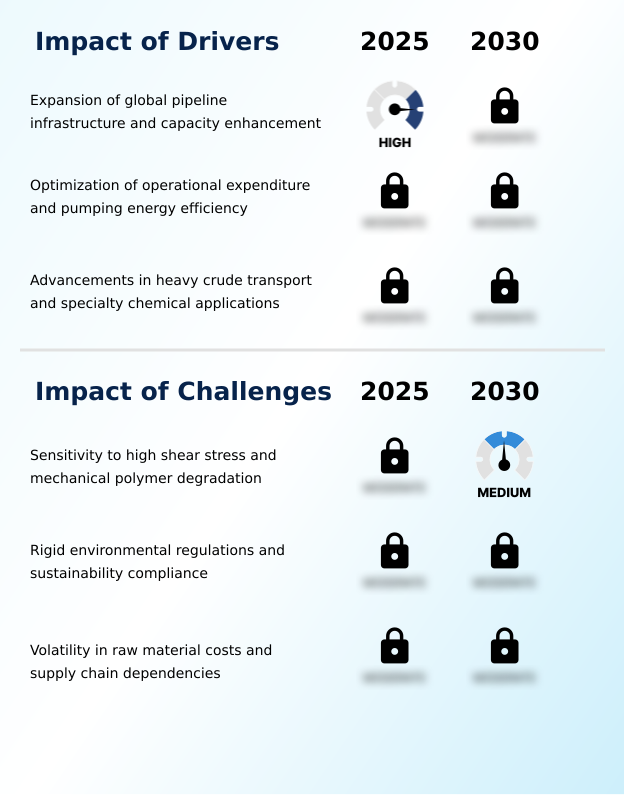
What are the key market drivers leading to the rise in the adoption of Drag Reducing Agent Industry?
- The primary market driver is the expansion of global pipeline infrastructure and the concurrent need for capacity enhancement to meet rising energy and chemical transport demands.
- Market growth is fundamentally driven by the need for pipeline capacity optimization and operational expenditure reduction. With pumping energy representing up to 40% of a pipeline's operating costs, technologies that enhance pumping energy efficiency are critical.
- Drag reducing agents facilitate significant pipeline throughput enhancement, directly supporting asset utilization maximization and deferring costly new construction of midstream infrastructure assets.
- This chemical-based flow assurance technology is pivotal for achieving a lower carbon footprint, contributing to greenhouse gas emissions reduction goals.
- The market's expansion into non-hydrocarbon fluid logistics, including slurry transportation aid in mining, liquid fertilizer distribution, and improving industrial cooling loop efficiency, demonstrates its growing versatility and economic impact across multiple sectors.
What are the market trends shaping the Drag Reducing Agent Industry?
- A key market trend is the integration of real-time digital monitoring with automated injection systems. This shift enables precise, data-driven optimization of chemical dosages for maximum efficiency.
- Key trends are reshaping the drag reducing agent market, driven by digitalization and sustainability mandates. The integration of digital twin modeling and real-time dosage optimization allows operators to enhance flow assurance, with some systems improving chemical efficiency by over 15%.
- This shift toward precision is complemented by a strong push for sustainable chemical solutions that align with environmental, social, and governance criteria. As a result, development is accelerating for eco-friendly polymer formulations and biodegradable drag reducers suitable for applications beyond oil and gas, such as in precision agriculture techniques.
- Innovations in surfactant micellar structures are also providing reusable alternatives for closed-loop systems, supporting circular economy initiatives and the broader energy transition. These advancements enable superior performance in challenging applications like heavy crude oil transport and multiphase flow dynamics.
What challenges does the Drag Reducing Agent Industry face during its growth?
- A significant market challenge stems from the inherent sensitivity of high-molecular-weight polymers to high shear stress, which can cause mechanical degradation and reduce effectiveness.
- The market faces significant technical and economic challenges, primarily the shear stress degradation of high-molecular-weight polymers. This issue of polymer shear stability can cause a performance drop of 25%–40% in a single pass through a pump, necessitating reinjection and increasing costs. Formulating products with effective asphaltene inhibitor additives or for paraffin deposition control adds complexity.
- Furthermore, the reliance on long-chain synthetic polymers raises concerns about supply chain resilience planning due to raw material cost volatility. Stricter environmental regulations increase regulatory compliance costs and create hurdles for downstream refinery processing.
- These factors compel a focus on improving equipment lifespan extension and maintenance cost reduction to prove value, especially for applications like refined product drag reduction where purity is paramount.
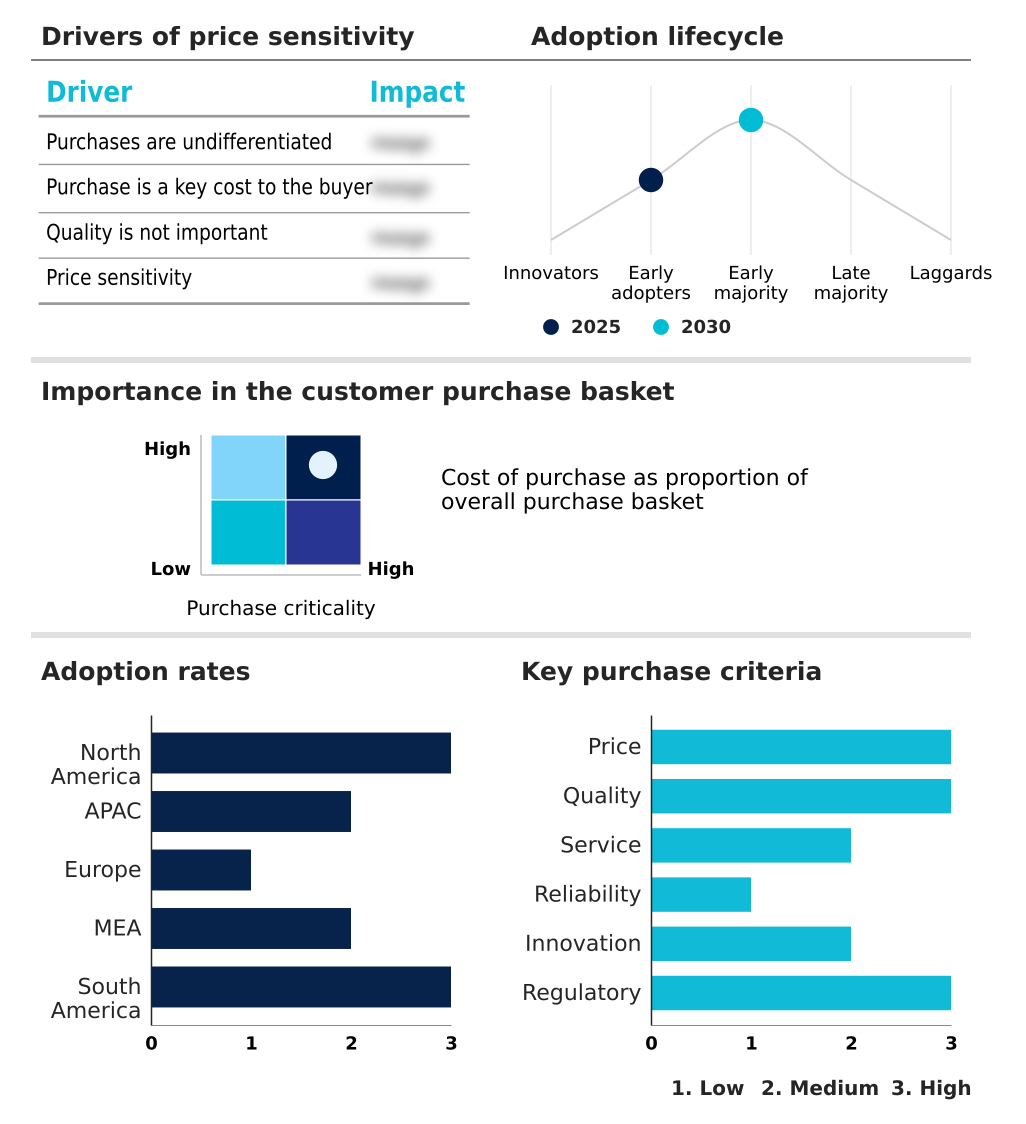
Exclusive Technavio Analysis on Customer Landscape
The drag reducing agent market forecasting report includes the adoption lifecycle of the market, covering from the innovator’s stage to the laggard’s stage. It focuses on adoption rates in different regions based on penetration. Furthermore, the drag reducing agent market report also includes key purchase criteria and drivers of price sensitivity to help companies evaluate and develop their market growth analysis strategies.
Customer Landscape of Drag Reducing Agent Industry
Competitive Landscape
Companies are implementing various strategies, such as strategic alliances, drag reducing agent market forecast, partnerships, mergers and acquisitions, geographical expansion, and product/service launches, to enhance their presence in the industry.
Arkema Group - Offers advanced polymer and multiphase drag reducers, including oil pipeline flow improvers, to enhance fluid transport efficiency in critical industrial applications.
The industry research and growth report includes detailed analyses of the competitive landscape of the market and information about key companies, including:
- Arkema Group
- Baker Hughes Co.
- BASF SE
- China National Petroleum Corp.
- Clariant International Ltd.
- Deshi Energy Technology Group
- Dorf Ketal Chemicals Ltd.
- Evonik Industries AG
- Flowchem
- Halliburton Co.
- Imperial Chemicals Pvt. Ltd.
- Indian Oil Corp. Ltd.
- Infineum International Ltd.
- Innospec Inc.
- Kemira Oyj
- LiquidPower Specialty Products
- NuGenTec
- Oil Flux Americas LLC
- Schlumberger Ltd.
- SNF Group
- The Lubrizol Corp.
Qualitative and quantitative analysis of companies has been conducted to help clients understand the wider business environment as well as the strengths and weaknesses of key industry players. Data is qualitatively analyzed to categorize companies as pure play, category-focused, industry-focused, and diversified; it is quantitatively analyzed to categorize companies as dominant, leading, strong, tentative, and weak.
Recent Development and News in Drag reducing agent market
- In March 2025, SNF announced a strategic industrial collaboration with Mitsubishi Chemical Corporation to develop and produce N-vinylformamide (NVF), an advanced monomer used in high-performance polymers for applications including enhancing the recyclability of paper products.
- In March 2025, Innospec Inc. announced an expansion of its proprietary drag-reducing agent (DRA) production capacity at its Pleasanton, Texas facility to meet rising midstream demand for flow assurance solutions in crude oil and refined products pipelines.
- In December 2024, the state-of-the-art N-vinylformamide (NVF) production facility from the SNF and Mitsubishi Chemical Corporation partnership became operational at SNF's site in Dunkirk, France, with full ramp-up expected by mid-2025.
- In April 2025, Baker Hughes Co. announced the successful pilot deployment of its Leucipa automated chemical injection technology across select North American pipelines, enhancing real-time dosage optimization for its drag-reducing agent product lines.
Dive into Technavio’s robust research methodology, blending expert interviews, extensive data synthesis, and validated models for unparalleled Drag Reducing Agent Market insights. See full methodology.
| Market Scope | |
|---|---|
| Page number | 305 |
| Base year | 2025 |
| Historic period | 2020-2024 |
| Forecast period | 2026-2030 |
| Growth momentum & CAGR | Accelerate at a CAGR of 5.2% |
| Market growth 2026-2030 | USD 328.2 million |
| Market structure | Fragmented |
| YoY growth 2025-2026(%) | 5.1% |
| Key countries | US, Canada, Mexico, China, India, Japan, South Korea, Australia, Germany, UK, France, Italy, Russia, Saudi Arabia, UAE, Iraq, Turkey, Qatar, Brazil, Colombia, Argentina, Chile and Peru |
| Competitive landscape | Leading Companies, Market Positioning of Companies, Competitive Strategies, and Industry Risks |
Research Analyst Overview
- The drag reducing agent market is driven by the core need for pipeline throughput enhancement and improved pumping energy efficiency. The technology, centered on high-molecular-weight polymers and advanced flow assurance technology, enables operators to maximize existing assets. Formulations like crude oil flow improvers and solutions for refined product drag reduction are critical.
- However, performance is constrained by shear stress degradation and polymer shear stability issues, where efficiency can drop by up to 40% after a single pass through a high-shear pump. A boardroom-level decision may involve balancing short-term costs against long-term ESG commitments, such as choosing between a standard long-chain synthetic polymer and a premium biodegradable drag reducer.
- Innovations in automated chemical injection and real-time dosage optimization are shifting the competitive landscape, while new applications in heavy crude oil transport and multiphase flow dynamics are expanding the addressable market. Surfactant micellar structures and nanoparticle-enhanced additives represent emerging frontiers in overcoming traditional performance limitations.
What are the Key Data Covered in this Drag Reducing Agent Market Research and Growth Report?
-
What is the expected growth of the Drag Reducing Agent Market between 2026 and 2030?
-
USD 328.2 million, at a CAGR of 5.2%
-
-
What segmentation does the market report cover?
-
The report is segmented by Application (Crude oil, Chemical transportation, and Others), Product (Polymer, Surfactant, and Others), End-user (Petrochemicals, Industrial manufacturing, Mining, and Agriculture) and Geography (North America, APAC, Europe, Middle East and Africa, South America)
-
-
Which regions are analyzed in the report?
-
North America, APAC, Europe, Middle East and Africa and South America
-
-
What are the key growth drivers and market challenges?
-
Expansion of global pipeline infrastructure and capacity enhancement, Sensitivity to high shear stress and mechanical polymer degradation
-
-
Who are the major players in the Drag Reducing Agent Market?
-
Arkema Group, Baker Hughes Co., BASF SE, China National Petroleum Corp., Clariant International Ltd., Deshi Energy Technology Group, Dorf Ketal Chemicals Ltd., Evonik Industries AG, Flowchem, Halliburton Co., Imperial Chemicals Pvt. Ltd., Indian Oil Corp. Ltd., Infineum International Ltd., Innospec Inc., Kemira Oyj, LiquidPower Specialty Products, NuGenTec, Oil Flux Americas LLC, Schlumberger Ltd., SNF Group and The Lubrizol Corp.
-
Market Research Insights
- The drag reducing agent market is shaped by a strong focus on operational expenditure reduction and supply chain resilience planning. With pumping energy accounting for up to 40% of pipeline operating costs, the adoption of these chemicals directly impacts profitability. Effective implementation can increase pipeline capacity by as much as 70%, deferring significant capital investment.
- The strategic shift toward sustainable chemical solutions is also gaining momentum, as operators align with net-zero emissions targets. For instance, the market's incremental growth is heavily influenced by regions like APAC, which contributes over 33% of the new demand, driven by rapid infrastructure development.
- This dynamic underscores the importance of asset utilization maximization and real-time performance monitoring to maintain a competitive edge.
We can help! Our analysts can customize this drag reducing agent market research report to meet your requirements.
 RIA -
RIA - 
