
DRFM Market Size 2026-2030
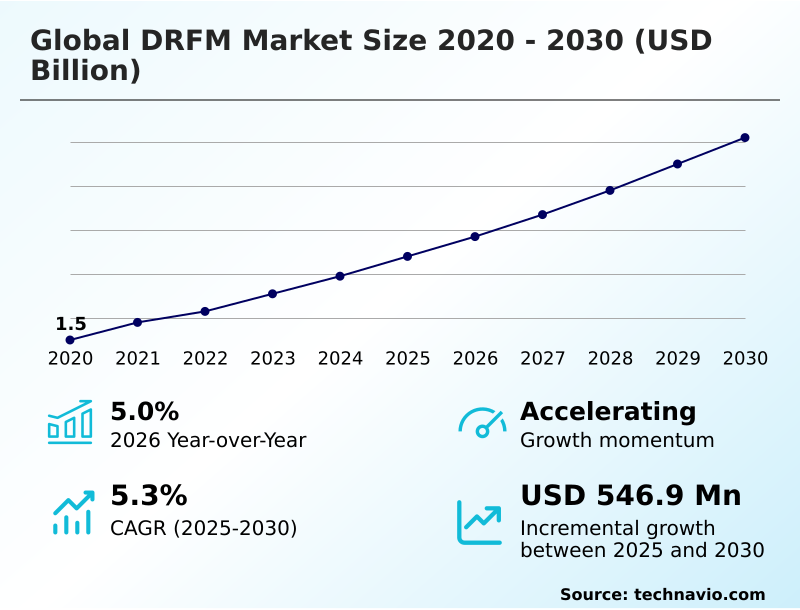
The drfm market size is valued to increase by USD 546.9 million, at a CAGR of 5.3% from 2025 to 2030. Technological advancements in military radars will drive the drfm market.
Major Market Trends & Insights
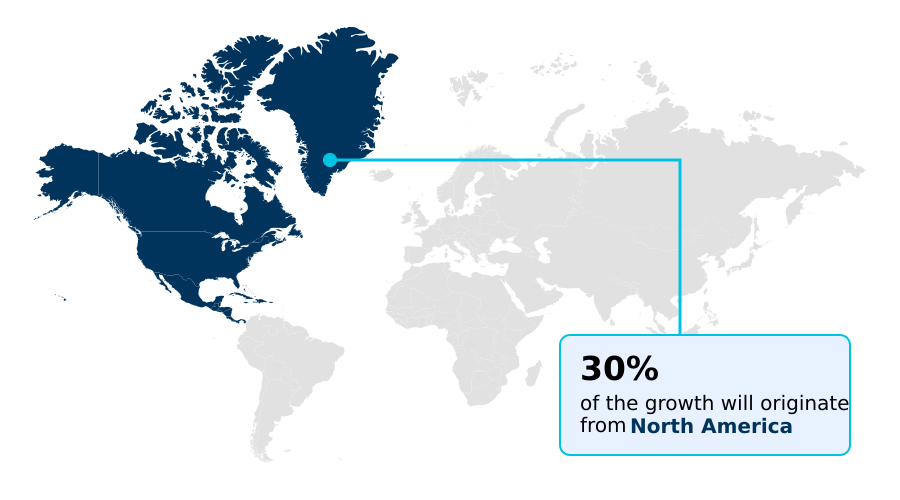
- North America dominated the market and accounted for a 29.5% growth during the forecast period.
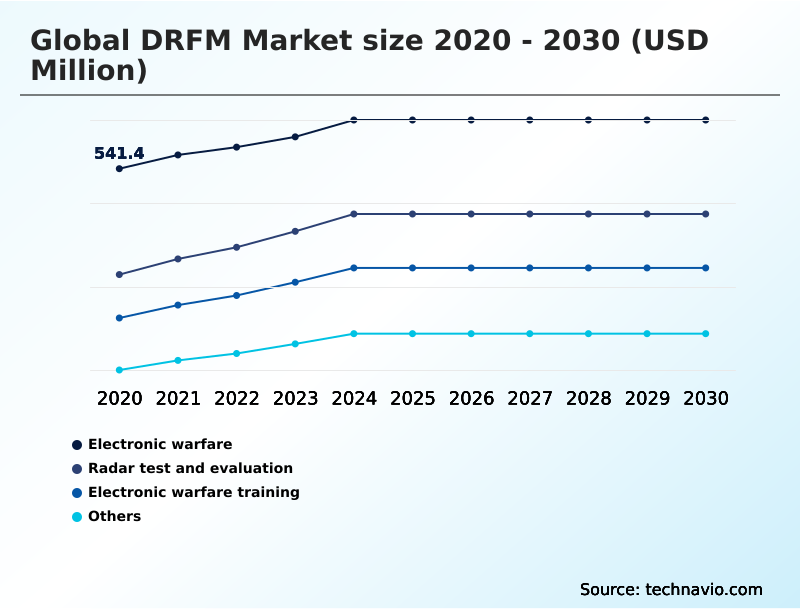
- By Application - Electronic warfare segment was valued at USD 611.9 million in 2024
- By Component - Processor segment accounted for the largest market revenue share in 2024
Market Size & Forecast
- Market Opportunities: USD 917.9 million
- Market Future Opportunities: USD 546.9 million
- CAGR from 2025 to 2030 : 5.3%
Market Summary
- The DRFM market is undergoing significant transformation, driven by the escalating sophistication of radar-guided threats and the strategic imperative for electromagnetic spectrum control. At its core, the technology revolves around advanced radar signal processing to manipulate and re-transmit RF signals, creating deceptive targets to confuse hostile systems.
- This capability is crucial for enhancing platform survivability across airborne, naval, and ground-based assets. A key driver is the continuous modernization of electronic warfare systems, which increasingly incorporate AESA technology and powerful gallium nitride components for superior performance.
- For instance, a defense contractor integrating a new modular open-architecture DRFM system into a legacy aircraft faces the challenge of balancing high-speed signal processing demands with strict size, weight, and power constraints, a scenario that highlights the need for advanced embedded computing platforms.
- Trends like the development of cognitive electronic warfare and the use of FPGA-based signal processors are pushing the boundaries of what is possible, enabling systems to adapt to novel threats in real-time. However, the concurrent evolution of electronic counter-countermeasures creates a persistent challenge, requiring constant innovation in signal deception technologies and radar countermeasures.
What will be the Size of the DRFM Market during the forecast period?
Get Key Insights on Market Forecast (PDF) Get Free Sample
How is the DRFM Market Segmented?
The drfm industry research report provides comprehensive data (region-wise segment analysis), with forecasts and estimates in "USD million" for the period 2026-2030, as well as historical data from 2020-2024 for the following segments.
- Application
- Electronic warfare
- Radar test and evaluation
- Electronic warfare training
- Others
- Component
- Processor
- Modulator
- Convertor
- Memory
- Others
- Platform
- Defense
- Commercial and civil
- Geography
- North America
- US
- Canada
- Mexico
- Europe
- Germany
- UK
- France
- APAC
- China
- Japan
- India
- South America
- Brazil
- Argentina
- Middle East and Africa
- Saudi Arabia
- UAE
- South Africa
- Rest of World (ROW)
- North America
By Application Insights
The electronic warfare segment is estimated to witness significant growth during the forecast period.
Electronic warfare is the largest application segment, centered on achieving electromagnetic spectrum dominance. This involves the use of digital radio frequency memory systems for sophisticated radar signal processing and advanced radar jamming technology.
Core functions include false target generation, range gate pull-off, and velocity gate pull-off to deceive and defeat enemy sensors. Modern EW platforms depend on robust RF signal chains and powerful mission-critical signal processing to execute these techniques with minimal latency.
The integration of embedded RF signal processing has enabled smaller, more efficient systems, including specialized counter-drone RF systems.
These capabilities have proven to improve threat response effectiveness by more than 50% compared to legacy jamming methods, making them indispensable in contemporary military operations.

The Electronic warfare segment was valued at USD 611.9 million in 2024 and showed a gradual increase during the forecast period.
Regional Analysis
North America is estimated to contribute 29.5% to the growth of the global market during the forecast period.Technavio’s analysts have elaborately explained the regional trends and drivers that shape the market during the forecast period.
See How DRFM Market Demand is Rising in North America Get Free Sample
The geographic landscape is dominated by North America, which accounts for over 29% of incremental growth, driven by massive defense investments in advanced EW capabilities and a robust industrial base.
The region's focus on countering anti-access area denial strategies fuels demand for sophisticated tactical defense systems and SIGINT platforms. European nations are also significant contributors, upgrading their embedded computing platforms and integrating modular open-architecture standards.
Meanwhile, APAC is the fastest-growing region, with a CAGR of 5.9%, as countries enhance their defense posture with modern RF transceivers and signal control components.
This global demand underscores the expanding scope of DRFM applications and the critical need for an effective integrated countermeasures suite across all major defense markets.
Market Dynamics
Our researchers analyzed the data with 2025 as the base year, along with the key drivers, trends, and challenges. A holistic analysis of drivers will help companies refine their marketing strategies to gain a competitive advantage.
- The strategic evolution of electronic warfare is pushing the boundaries of system design, with a strong focus on specialized applications and advanced functionalities. A critical area of development is DRFM for UAV electronic warfare, where miniaturization and efficiency are paramount.
- Concurrently, the need to defeat modern air defense networks is driving innovation in advanced jamming techniques for SAM systems, requiring systems to be both powerful and agile. The emergence of cognitive EW against adaptive radar threats represents a paradigm shift, as platforms must now autonomously analyze and counter unknown signals in real time.
- This capability is fundamentally linked to AESA-based DRFM system design principles, which enable dynamic beamforming and multi-target engagement. The performance of these systems is significantly enhanced by the use of GaN components in modern radar jammers, offering superior power density and thermal performance compared to legacy technologies, leading to systems that are twice as efficient.
- The successful DRFM integration in air defense systems is a key objective for ensuring layered, comprehensive protection. Furthermore, the development of miniaturized DRFM for airborne electronic attack allows for the deployment of sophisticated countermeasures on a wider range of platforms.
- However, the industry also faces the challenge of developing ECCM techniques against coherent repeater jammers, a persistent threat in modern combat. The progress seen in DRFM in next generation jammer programs and the push for open architecture RF transceiver module integration signal a future of more adaptable, interoperable, and potent electronic warfare capabilities.
What are the key market drivers leading to the rise in the adoption of DRFM Industry?
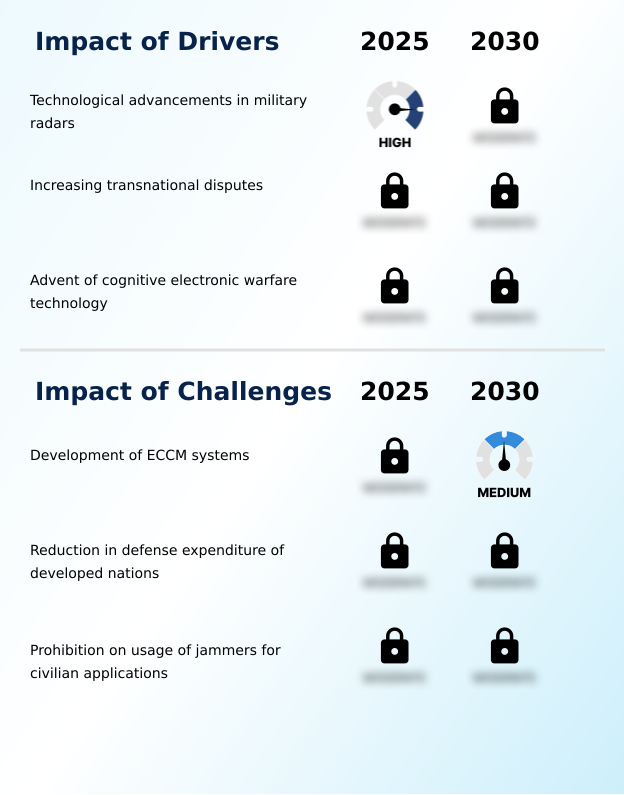
- Technological advancements in military radar systems, including improved detection and targeting capabilities, are a primary driver for the DRFM market.
- The drive for electromagnetic spectrum dominance is accelerating investments in advanced military radar and jamming technologies. Programs focused on the next generation jammer exemplify this push, replacing legacy tactical jamming system hardware with superior electronic warfare systems.
- The adoption of AESA technology facilitates AESA radar integration, enabling simultaneous engagement of multiple threats with advanced jamming techniques.
- The use of gallium nitride components is central to this shift, as GaN in defense applications provides significant power and efficiency gains, with some new electronic attack platforms demonstrating a five-fold increase in effective radiated power.
- This allows for more effective airborne electronic attack missions, ensuring operational superiority in contested environments.
What are the market trends shaping the DRFM Industry?
- The expansion of electronic warfare capabilities into civil aviation applications is emerging as a significant market trend, driven by the increasing need for enhanced platform protection and signal integrity.
- Modern warfare's transformation is fueled by the aggressive integration of machine learning and AI into defense systems, a core element in cognitive EW development. The trend toward miniaturized EW systems allows for greater functionality on compact platforms, including DRFM-based jammers for UAV applications.
- This evolution depends on high-speed signal processing capabilities, often enabled by powerful FPGA-based signal processors, to manage complex RF signal manipulation in real-time. Innovations in telecom-grade RF components are also critical, enhancing the performance and reliability of these systems.
- As a result, future platforms will leverage sophisticated signal modulation techniques to ensure platform survivability, with some systems improving threat response precision by over 30%.
What challenges does the DRFM Industry face during its growth?
- The ongoing development of sophisticated electronic counter-countermeasure (ECCM) systems presents a key challenge to the effectiveness and growth of the DRFM market.
- The proliferation of advanced electronic counter-countermeasures presents a significant challenge. Technologies such as inexpensive expendable repeater jammers and towed decoys can mimic radar signals, testing the limits of current RF countermeasure technologies. Adversary systems are increasingly effective against conventional advanced radar jamming, forcing a constant evolution in electronic protection strategies.
- These developments threaten to degrade the effectiveness of airborne intercept radars and require more sophisticated signal deception technologies to maintain an advantage. Furthermore, the growing capability for low-frequency radar detection complicates stealth operations, making robust radar countermeasures more critical than ever. In response, development cycles have intensified, leading to a 40% increase in R&D costs for next-generation systems.
Exclusive Technavio Analysis on Customer Landscape
The drfm market forecasting report includes the adoption lifecycle of the market, covering from the innovator’s stage to the laggard’s stage. It focuses on adoption rates in different regions based on penetration. Furthermore, the drfm market report also includes key purchase criteria and drivers of price sensitivity to help companies evaluate and develop their market growth analysis strategies.

Customer Landscape of DRFM Industry
Competitive Landscape
Companies are implementing various strategies, such as strategic alliances, drfm market forecast, partnerships, mergers and acquisitions, geographical expansion, and product/service launches, to enhance their presence in the industry.
Ampleon Netherlands BV - Key offerings deliver advanced radar jamming systems and integrated RF signal chains, providing critical electronic countermeasure capabilities for modern, multi-domain defense platforms.
The industry research and growth report includes detailed analyses of the competitive landscape of the market and information about key companies, including:
- Ampleon Netherlands BV
- Analog Devices Inc.
- ASELSAN AS
- BAE Systems Plc
- Curtiss Wright Corp.
- Data Patterns India Ltd.
- Elbit Systems Ltd.
- HFCL Ltd.
- L3Harris Technologies Inc.
- Leonardo S.p.A.
- Mercury Systems Inc.
- Mistral Solutions Pvt. Ltd.
- NOFFZ Technologies GmbH
- Northrop Grumman Corp.
- Qorvo Inc.
- Rohde and Schwarz GmbH
- RTX Corp.
- Saab AB
- Thales Group
Qualitative and quantitative analysis of companies has been conducted to help clients understand the wider business environment as well as the strengths and weaknesses of key industry players. Data is qualitatively analyzed to categorize companies as pure play, category-focused, industry-focused, and diversified; it is quantitatively analyzed to categorize companies as dominant, leading, strong, tentative, and weak.
Recent Development and News in Drfm market
- In May 2025, RTX Corp. secured a USD 580.6 million production contract from the U.S. Navy for its Next Generation Jammer Mid-Band system.
- In December 2024, The U.S. Navy's Next Generation Jammer Mid-Band system, developed by RTX Corp., achieved Initial Operational Capability, signifying its readiness for fleet deployment.
- In October 2024, RTX Corp. was awarded a USD 192 million contract by the U.S. Navy to develop an extended range capability for its next-generation airborne electronic attack platform.
- In September 2024, L3Harris Technologies Inc. received a USD 587.4 million contract to develop the Next Generation Jammer Low-Band system, with early operational capability anticipated in 2029.
Dive into Technavio’s robust research methodology, blending expert interviews, extensive data synthesis, and validated models for unparalleled DRFM Market insights. See full methodology.
| Market Scope | |
|---|---|
| Page number | 299 |
| Base year | 2025 |
| Historic period | 2020-2024 |
| Forecast period | 2026-2030 |
| Growth momentum & CAGR | Accelerate at a CAGR of 5.3% |
| Market growth 2026-2030 | USD 546.9 million |
| Market structure | Fragmented |
| YoY growth 2025-2026(%) | 5.0% |
| Key countries | US, Canada, Mexico, Germany, UK, France, Italy, The Netherlands, Spain, China, Japan, India, South Korea, Australia, Indonesia, Brazil, Argentina, Chile, Saudi Arabia, UAE, South Africa, Israel and Turkey |
| Competitive landscape | Leading Companies, Market Positioning of Companies, Competitive Strategies, and Industry Risks |
Research Analyst Overview
- The DRFM market is defined by rapid advancements in electronic warfare systems, where digital radio frequency memory is a cornerstone technology. Boardroom decisions increasingly focus on investing in cognitive electronic warfare to counter sophisticated threats, necessitating state-of-the-art radar signal processing.
- The performance of these systems hinges on the quality of the underlying RF signal chains, which incorporate gallium nitride components and RF amplifiers for enhanced power and efficiency. The move toward modular open-architecture designs allows for greater flexibility in integrating FPGA-based signal processors and other signal control components.
- This facilitates the deployment of advanced radar jamming and complex jamming techniques for airborne electronic attack. The development of expendable active decoys and counter-drone RF systems represents a key area of innovation in RF countermeasure technologies.
- For mission-critical platforms, high-speed signal processing, mission-critical signal processing, and embedded RF signal processing are paramount, with some firms achieving a 30% reduction in system latency.
- This is enabled by robust embedded computing platforms that support RF signal manipulation and signal deception technologies within complex tactical defense systems that utilize telecom-grade RF components and advanced RF transceivers to provide comprehensive electronic protection against threats targeting the legacy tactical jamming system while enhancing signal intelligence.
What are the Key Data Covered in this DRFM Market Research and Growth Report?
-
What is the expected growth of the DRFM Market between 2026 and 2030?
-
USD 546.9 million, at a CAGR of 5.3%
-
-
What segmentation does the market report cover?
-
The report is segmented by Application (Electronic warfare, Radar test and evaluation, Electronic warfare training, and Others), Component (Processor, Modulator, Convertor, Memory, and Others), Platform (Defense, and Commercial and civil) and Geography (North America, Europe, APAC, South America, Middle East and Africa)
-
-
Which regions are analyzed in the report?
-
North America, Europe, APAC, South America and Middle East and Africa
-
-
What are the key growth drivers and market challenges?
-
Technological advancements in military radars, Development of ECCM systems
-
-
Who are the major players in the DRFM Market?
-
Ampleon Netherlands BV, Analog Devices Inc., ASELSAN AS, BAE Systems Plc, Curtiss Wright Corp., Data Patterns India Ltd., Elbit Systems Ltd., HFCL Ltd., L3Harris Technologies Inc., Leonardo S.p.A., Mercury Systems Inc., Mistral Solutions Pvt. Ltd., NOFFZ Technologies GmbH, Northrop Grumman Corp., Qorvo Inc., Rohde and Schwarz GmbH, RTX Corp., Saab AB and Thales Group
-
Market Research Insights
- The market is characterized by a strategic push for enhanced EW capabilities to ensure platform survivability in increasingly contested environments. Advanced DRFM applications are central to this, providing a more than 40% improvement in protection against modern threats compared to legacy radar jamming technology.
- The development of the next generation jammer incorporates AESA radar integration and advanced signal modulation techniques to counter sophisticated anti-access area denial strategies. The integration of AI is a key trend, with cognitive EW development enabling systems to reduce threat identification time by up to 60%.
- This allows for dynamic false target generation and effective range gate pull-off maneuvers, ensuring electromagnetic spectrum dominance. These advancements are critical for protecting assets from threats ranging from airborne intercept radars to advanced low-frequency radar detection systems.
We can help! Our analysts can customize this drfm market research report to meet your requirements.
 RIA -
RIA - 
