Drone Sensor Market Size 2025-2029
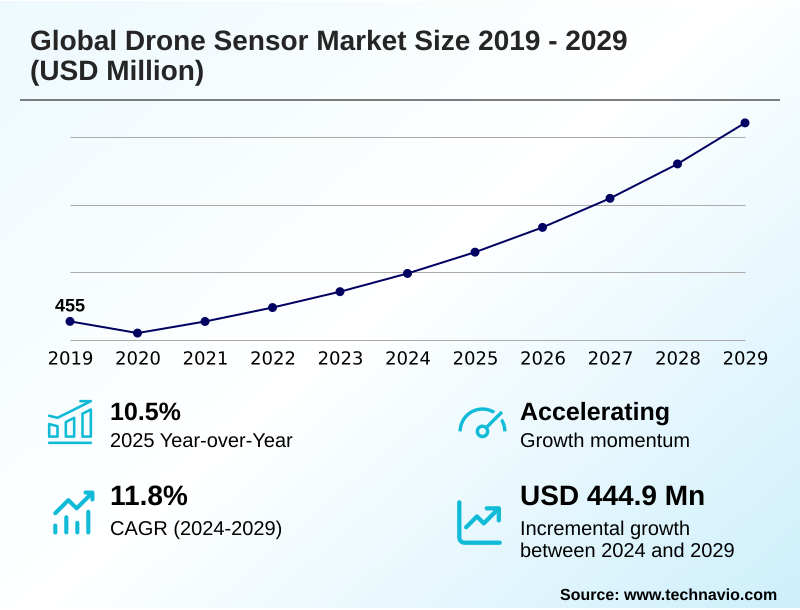
The drone sensor market size is valued to increase by USD 444.9 million, at a CAGR of 11.8% from 2024 to 2029. Advancement in sensors and emergence of low-cost drones will drive the drone sensor market.
Major Market Trends & Insights
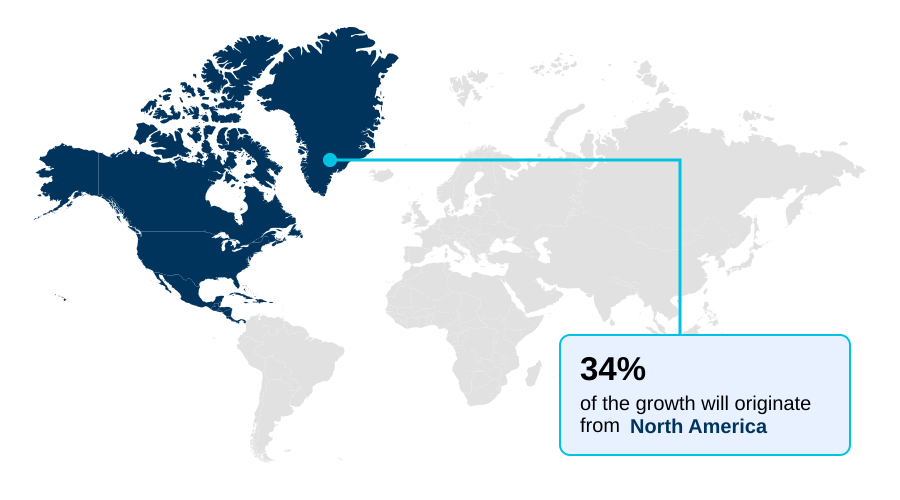
- North America dominated the market and accounted for a 34.1% growth during the forecast period.
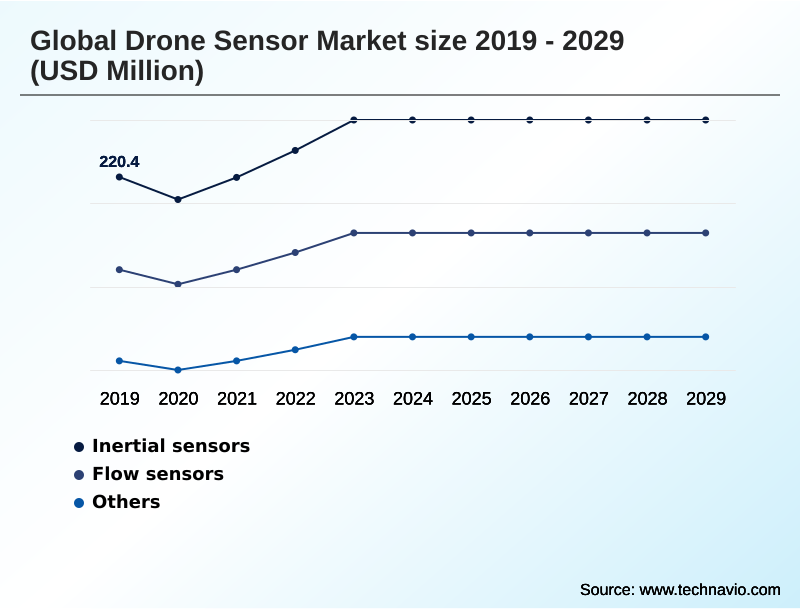
- By Type - Inertial sensors segment was valued at USD 262.9 million in 2023
- By Application - Data acquisition segment accounted for the largest market revenue share in 2023
Market Size & Forecast
- Market Opportunities: USD 586.5 million
- Market Future Opportunities: USD 444.9 million
- CAGR from 2024 to 2029 : 11.8%
Market Summary
- The drone sensor market is undergoing rapid evolution, driven by the expanding application of unmanned aerial vehicles (UAVs) across commercial, civil, and defense sectors. The core of this market lies in the miniaturization and enhanced capabilities of various sensor types, which transform drones from simple remote-controlled aircraft into sophisticated data collection platforms.
- Key technologies include LiDAR for creating precise 3D terrain maps, multispectral sensors for precision agriculture, and high-resolution thermal imagers for infrastructure inspection and public safety operations. The integration of artificial intelligence and machine learning is a significant force, enabling real-time data analysis and autonomous functionality.
- For instance, in infrastructure management, a UAV equipped with a sensor fusion suite can autonomously inspect a bridge, using AI to identify potential structural defects like cracks or corrosion in real-time, thereby improving safety and reducing inspection costs compared to traditional manual methods.
- As regulatory frameworks mature to accommodate more complex operations, the demand for more advanced, reliable, and integrated sensor solutions is set to increase, solidifying their role as essential tools for modern data-driven industries. This dynamic environment is fostered by continuous innovation in sensor design and data processing.
What will be the Size of the Drone Sensor Market during the forecast period?
Get Key Insights on Market Forecast (PDF) Get Free Sample
How is the Drone Sensor Market Segmented?
The drone sensor industry research report provides comprehensive data (region-wise segment analysis), with forecasts and estimates in "USD million" for the period 2025-2029, as well as historical data from 2019-2023 for the following segments.
- Type
- Inertial sensors
- Flow sensors
- Others
- Application
- Data acquisition
- Collision detection and avoidance
- Navigation
- Motion detection
- Air pressure measurement
- Component
- VTOL
- Fixed-wing
- Hybrid
- Geography
- North America
- US
- Canada
- Mexico
- APAC
- China
- India
- Japan
- Europe
- Germany
- UK
- The Netherlands
- Middle East and Africa
- Saudi Arabia
- UAE
- South Africa
- South America
- Brazil
- Argentina
- Colombia
- Rest of World (ROW)
- North America
By Type Insights
The inertial sensors segment is estimated to witness significant growth during the forecast period.
The inertial sensors segment is foundational to the market, with the inertial measurement unit (IMU) being a critical drone sensor payload. These systems integrate MEMS gyroscope and MEMS accelerometer components to provide essential attitude and heading data.
Advanced sensor fusion algorithm techniques combine this data with inputs from other sensors, enhancing the reliability of the autonomous navigation sensor array.
This UAV sensor integration is pivotal for stable flight and precise geospatial data collection, especially when paired with a gimbal stabilization system.
The adoption of high-fidelity IMUs improves positional accuracy by over 15% in environments where satellite signals are compromised, enabling complex missions.
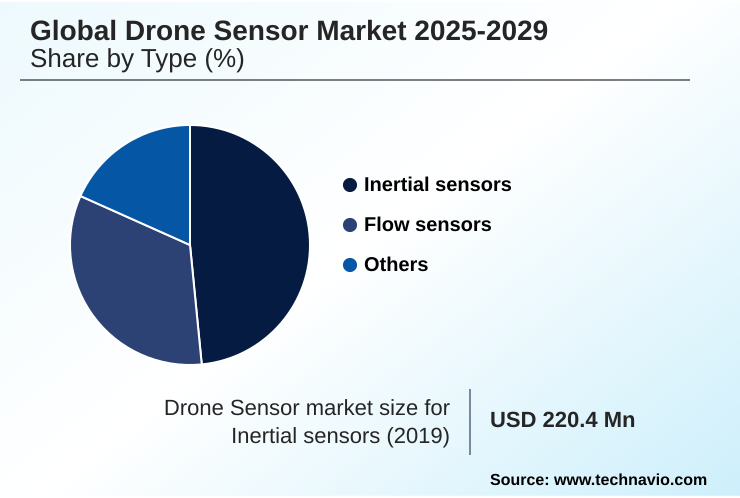
The Inertial sensors segment was valued at USD 262.9 million in 2023 and showed a gradual increase during the forecast period.
Regional Analysis
North America is estimated to contribute 34.1% to the growth of the global market during the forecast period.Technavio’s analysts have elaborately explained the regional trends and drivers that shape the market during the forecast period.
See How Drone Sensor Market Demand is Rising in North America Get Free Sample
The market's geographic landscape is led by North America, which accounts for over 34% of the market opportunity, driven by strong defense investment and commercial adoption.
This region shows significant demand for advanced ISR drone sensor suite technologies, including synthetic aperture radar (SAR) and signals intelligence (SIGINT) payload systems.
APAC is the fastest-growing region, contributing nearly 32% of the incremental growth, fueled by manufacturing and infrastructure development leveraging LiDAR sensor technology for aerial mapping sensor payload applications.
Europe focuses on stringent regulatory frameworks, driving innovation in public safety drone payload systems. Demand in the Middle East is growing for specialized systems like the chemical biological radiological nuclear (CBRN) detector and sensors for attritable drone platforms.
Market Dynamics
Our researchers analyzed the data with 2024 as the base year, along with the key drivers, trends, and challenges. A holistic analysis of drivers will help companies refine their marketing strategies to gain a competitive advantage.
- Strategic decision-making in the drone sensor market increasingly hinges on specific use-case requirements and return on investment calculations. For instance, selecting the best LiDAR sensor for UAV mapping depends on the required point cloud density and accuracy, with top-tier systems offering superior performance for large-scale topographical surveys.
- In agriculture, the initial cost of multispectral sensors for agriculture is weighed against long-term gains in yield and resource efficiency. Similarly, the deployment of a thermal camera drone for building inspection is justified by significant reductions in labor costs and improved safety, with some operators reporting a decrease of over 40% in person-hours compared to traditional methods.
- The technical decision of integrating RTK GNSS with drone sensors is critical for achieving survey-grade accuracy without extensive ground control points. At a component level, the performance of MEMS inertial sensors for drone stabilization is fundamental to data quality across all applications.
- As the industry evolves, drone sensor requirements for BVLOS operations are becoming more stringent, mandating redundant and highly reliable sensor suites to ensure safe integration into controlled airspace. The market for high-resolution CMOS image sensors for drones continues to be competitive, with advancements in low-light performance and dynamic range being key differentiators.
What are the key market drivers leading to the rise in the adoption of Drone Sensor Industry?
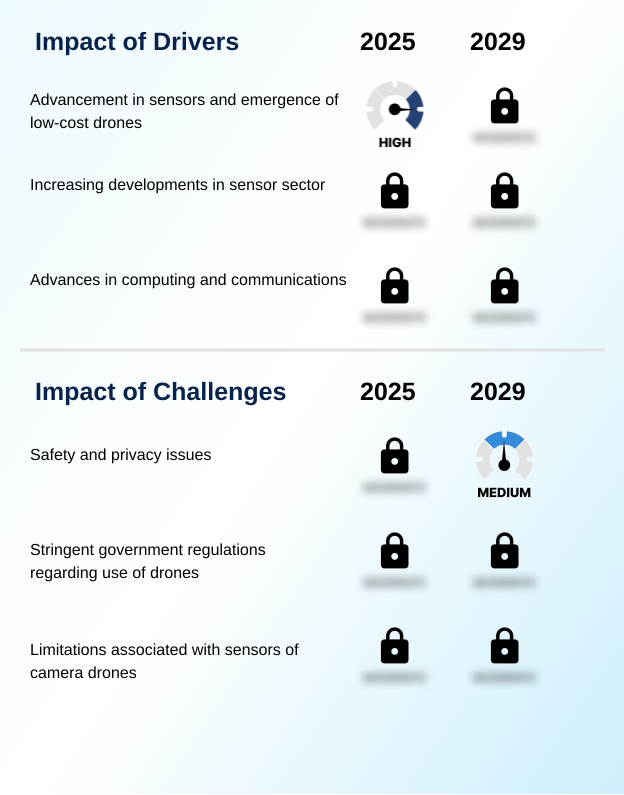
- Advancements in sensor technology, coupled with the emergence of low-cost drones, are key drivers propelling market growth.
- A primary market driver is the continuous advancement and cost reduction of core sensor technologies.
- The integration of a high-precision GNSS receiver with real-time kinematic (RTK) positioning has become standard in professional drone surveying equipment, reducing survey-grade mapping project times by up to 30%.
- The proliferation of affordable yet effective obstacle detection sensor arrays, often combining an ultrasonic sensor with vision-based systems, enhances operational safety.
- Furthermore, the miniaturization of components like the barometric pressure sensor has led to the development of the SWaP-optimized sensor, expanding the capabilities of smaller drone data acquisition platforms used for tasks like infrastructure inspection.
What are the market trends shaping the Drone Sensor Industry?
- Improvements in photogrammetry and thermal imaging are an emerging market trend. This is driving demand for higher-resolution sensors and advanced data processing capabilities.
- Market trends are increasingly shaped by advancements in imaging technologies, with improved photogrammetry software enabling the creation of high-fidelity 3D models with 99.5% geometric accuracy. The adoption of the radiometric thermal camera is expanding, providing precise temperature data critical for industrial inspections.
- In agriculture, the precision agriculture sensor suite now commonly includes a multispectral imaging sensor for crop health monitoring technology. The emergence of more accessible hyperspectral imaging sensor systems, often part of a remote sensing drone payload, is unlocking new applications in environmental monitoring.
- This evolution is also seen in the development of dual electro-optical/infrared (EO/IR) sensor systems for versatile day-night operations.
What challenges does the Drone Sensor Industry face during its growth?
- Significant safety and privacy issues present a key challenge to the drone sensor market's growth.
- Key market challenges revolve around safety, security, and regulatory compliance. The reliability of a sophisticated collision avoidance system is a prerequisite for widespread beyond visual line of sight (BVLOS) operation, with regulators scrutinizing the performance of any detect and avoid (DAA) system.
- Security vulnerabilities in unmanned aerial system (UAS) sensors, including the potential for hijacking a non-encrypted CMOS image sensor feed or tampering with a frequency-hopping sensor, pose significant risks for over 60% of enterprise users.
- These concerns can impede the adoption of technologies like optical gas imaging (OGI) for critical infrastructure monitoring and complicate workflows that rely on post-processed kinematic (PPK) data for accurate 3D point cloud generation.
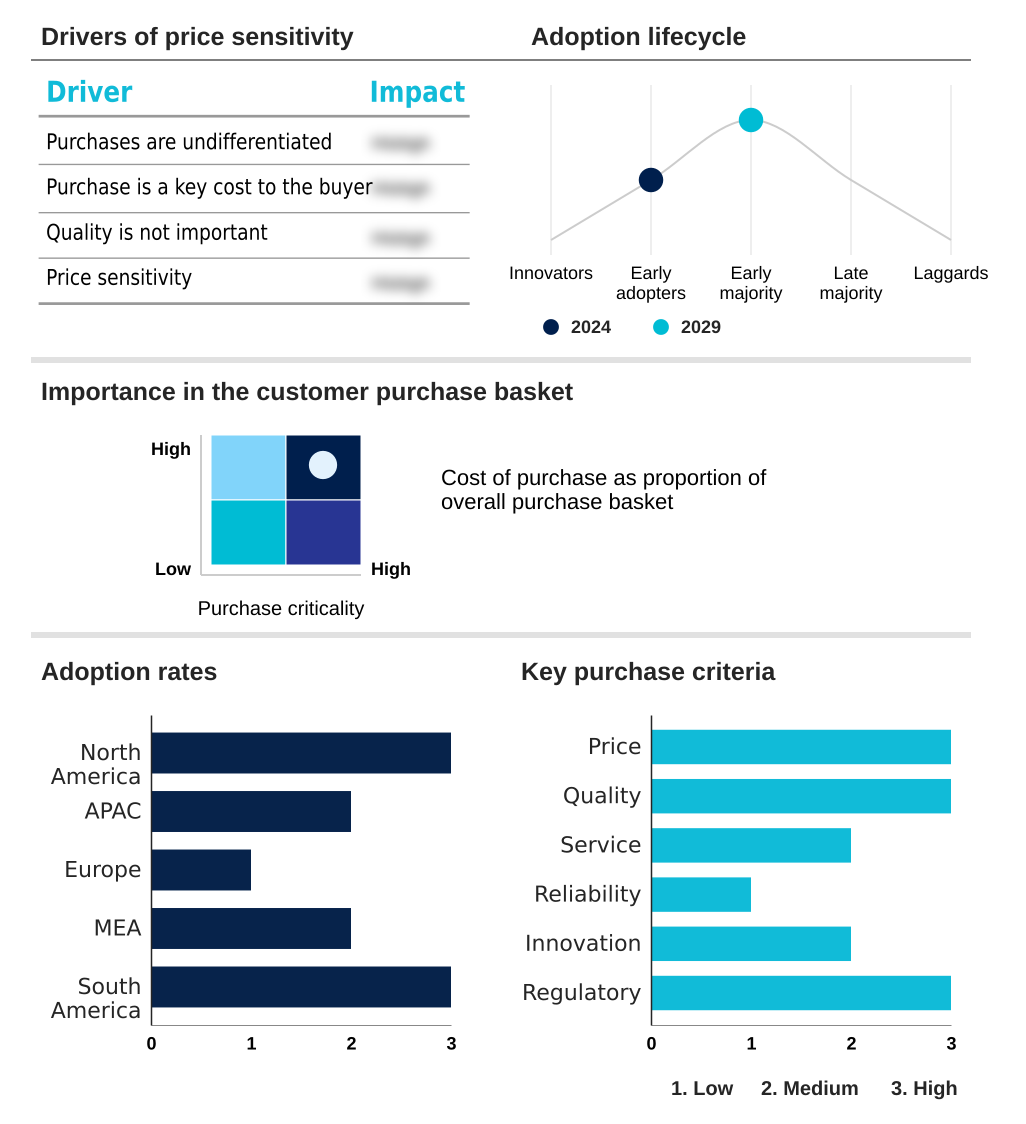
Exclusive Technavio Analysis on Customer Landscape
The drone sensor market forecasting report includes the adoption lifecycle of the market, covering from the innovator’s stage to the laggard’s stage. It focuses on adoption rates in different regions based on penetration. Furthermore, the drone sensor market report also includes key purchase criteria and drivers of price sensitivity to help companies evaluate and develop their market growth analysis strategies.
Customer Landscape of Drone Sensor Industry
Competitive Landscape
Companies are implementing various strategies, such as strategic alliances, drone sensor market forecast, partnerships, mergers and acquisitions, geographical expansion, and product/service launches, to enhance their presence in the industry.
ams OSRAM AG - Offerings focus on designing compact, low-power, and high-sensitivity sensors that enable advanced multi-sensor applications, including precise distance measurement for 3D mapping and imaging.
The industry research and growth report includes detailed analyses of the competitive landscape of the market and information about key companies, including:
- ams OSRAM AG
- DELAIR SAS
- DroneDeploy Inc.
- Emcore Corp.
- GEOSYSTEMS France SAS
- Hesai Technology Co. Ltd.
- Parker Hannifin Corp.
- Robert Bosch GmbH
- RTX Corp.
- SBG Systems SAS
- Sensirion AG
- Sentera Inc.
- SlantRange Inc.
- Sony Group Corp.
- Swift Navigation Inc.
- TDK Corp.
- TE Connectivity Ltd.
- Teledyne Technologies Inc.
- Trimble Inc.
- Velodyne Lidar Inc.
Qualitative and quantitative analysis of companies has been conducted to help clients understand the wider business environment as well as the strengths and weaknesses of key industry players. Data is qualitatively analyzed to categorize companies as pure play, category-focused, industry-focused, and diversified; it is quantitatively analyzed to categorize companies as dominant, leading, strong, tentative, and weak.
Recent Development and News in Drone sensor market
- In September 2024, the European Union Aviation Safety Agency (EASA) issued new standardized regulations for beyond visual line of sight (BVLOS) operations, mandating certified detect and avoid (DAA) systems that incorporate advanced sensor fusion algorithms.
- In November 2024, DroneDeploy Inc. formed a strategic partnership with a leading construction software provider to fully integrate 3D point cloud data from LiDAR sensors into building information modeling (BIM) workflows.
- In January 2025, a prominent private equity firm announced a significant growth investment in Swift Navigation Inc. to accelerate the development of their centimeter-accurate real-time kinematic (RTK) GNSS receivers for autonomous navigation systems.
- In March 2025, Teledyne Technologies Inc. launched its next-generation Hadron 700 series, a compact dual thermal-visible module featuring enhanced radiometric capabilities and onboard AI for superior object detection in SWaP-constrained UAVs.
Dive into Technavio’s robust research methodology, blending expert interviews, extensive data synthesis, and validated models for unparalleled Drone Sensor Market insights. See full methodology.
| Market Scope | |
|---|---|
| Page number | 298 |
| Base year | 2024 |
| Historic period | 2019-2023 |
| Forecast period | 2025-2029 |
| Growth momentum & CAGR | Accelerate at a CAGR of 11.8% |
| Market growth 2025-2029 | USD 444.9 million |
| Market structure | Fragmented |
| YoY growth 2024-2025(%) | 10.5% |
| Key countries | US, Canada, Mexico, China, India, Japan, South Korea, Australia, Indonesia, Germany, UK, The Netherlands, France, Italy, Spain, Saudi Arabia, UAE, South Africa, Israel, Turkey, Brazil, Argentina and Colombia |
| Competitive landscape | Leading Companies, Market Positioning of Companies, Competitive Strategies, and Industry Risks |
Research Analyst Overview
- The drone sensor market is characterized by rapid innovation, driven by the dual pressures of miniaturization and functional integration. An inertial measurement unit (IMU) is now a standard component, but differentiation comes from the sophistication of the sensor fusion algorithm that combines its data with inputs from a GNSS receiver and other sensors.
- Key advancements in LiDAR sensor technology and the development of the radiometric thermal camera are opening new industrial applications. In the defense sector, the focus is on advanced electro-optical/infrared (EO/IR) sensor systems and specialized signals intelligence (SIGINT) payload and chemical biological radiological nuclear (CBRN) detector technologies.
- For commercial applications, the integration of a multispectral imaging sensor and hyperspectral imaging sensor is transforming precision agriculture. Onboard photogrammetry software and processing capabilities, such as real-time kinematic (RTK) positioning and post-processed kinematic (PPK), are becoming critical. Component-level innovations in the MEMS gyroscope, MEMS accelerometer, and barometric pressure sensor are enabling more stable and reliable platforms.
- Safety is addressed through the ultrasonic sensor and sophisticated obstacle detection sensor arrays within a broader collision avoidance system. From a strategic standpoint, boardroom decisions are increasingly focused on balancing the high R&D cost of developing a proprietary optical gas imaging (OGI) sensor or a specialized frequency-hopping sensor against the time-to-market advantages of sourcing off-the-shelf solutions.
- This is evident as onboard processing reduces post-mission data analysis time by up to 25%.
What are the Key Data Covered in this Drone Sensor Market Research and Growth Report?
-
What is the expected growth of the Drone Sensor Market between 2025 and 2029?
-
USD 444.9 million, at a CAGR of 11.8%
-
-
What segmentation does the market report cover?
-
The report is segmented by Type (Inertial sensors, Flow sensors, and Others), Application (Data acquisition, Collision detection and avoidance, Navigation, Motion detection, and Air pressure measurement), Component (VTOL, Fixed-wing, and Hybrid) and Geography (North America, APAC, Europe, Middle East and Africa, South America)
-
-
Which regions are analyzed in the report?
-
North America, APAC, Europe, Middle East and Africa and South America
-
-
What are the key growth drivers and market challenges?
-
Advancement in sensors and emergence of low-cost drones, Safety and privacy issues
-
-
Who are the major players in the Drone Sensor Market?
-
ams OSRAM AG, DELAIR SAS, DroneDeploy Inc., Emcore Corp., GEOSYSTEMS France SAS, Hesai Technology Co. Ltd., Parker Hannifin Corp., Robert Bosch GmbH, RTX Corp., SBG Systems SAS, Sensirion AG, Sentera Inc., SlantRange Inc., Sony Group Corp., Swift Navigation Inc., TDK Corp., TE Connectivity Ltd., Teledyne Technologies Inc., Trimble Inc. and Velodyne Lidar Inc.
-
Market Research Insights
- The dynamics of the drone sensor market are increasingly influenced by the need for actionable, high-fidelity data across industries. The adoption of sophisticated drone sensor payloads is driving significant operational efficiencies; for example, the use of advanced UAV sensor integration in industrial settings has been shown to reduce inspection times by over 30%.
- In precision agriculture, sensor suites enable crop yield increases of up to 15% through optimized resource management. This value proposition is accelerating the demand for specialized aerial mapping sensor payloads and robust detect and avoid (DAA) systems.
- As the industry moves toward normalizing beyond visual line of sight (BVLOS) operations, the reliability of these sensors becomes paramount, creating a competitive landscape focused on performance, miniaturization, and intelligent data processing.
We can help! Our analysts can customize this drone sensor market research report to meet your requirements.
 RIA -
RIA - 
