Drug Repurposing Market Analysis North America, Europe, Asia, Rest of World (ROW) - US, China, Germany, UK, India, France, Japan, Canada, Australia, Brazil - Size and Forecast 2024-2028

Drug Repurposing Market Analysis North America, Europe, Asia, Rest of World (ROW) - US, China, Germany, UK, India, France, Japan, Canada, Australia, Brazil - Size and Forecast 2024-2028

Published: Oct 2024 198 Pages SKU: IRTNTR80220

Market Overview at a Glance

$8.58 B
Market Opportunity
4.3%
CAGR
4.0
YoY growth 2023-2024(%)

Drug Repurposing Market Size 2024-2028 

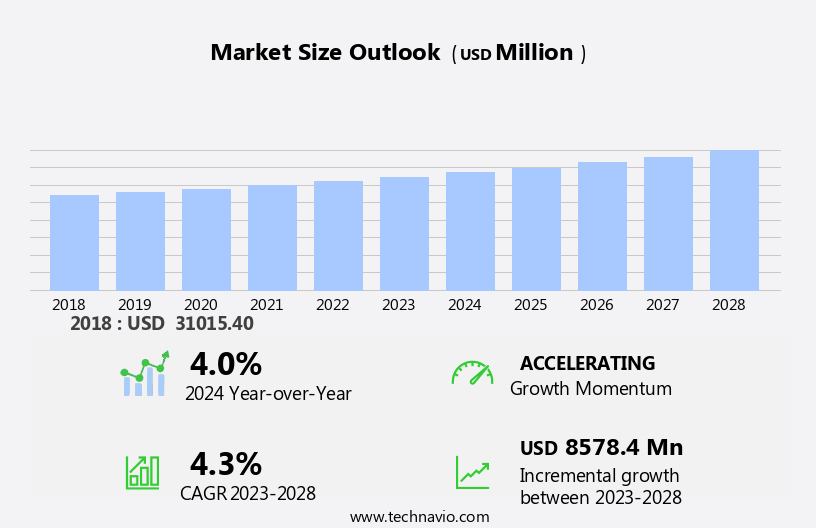
The drug repurposing market size is forecast to increase by USD 8.58 billion at a CAGR of 4.3% between 2023 and 2028. The market is experiencing significant growth due to the increasing application of this approach in therapeutic purposes, particularly in the field of cancer treatment. Investment in this area is surging as researchers seek to unlock the potential of existing drugs for new uses. However, regulatory challenges remain a barrier to success, requiring careful dosage prediction and adherence to stringent safety and efficacy standards. Additionally, the repurposing of antimicrobials for broad-spectrum therapeutics is gaining traction, offering potential solutions to emerging drug discovery outsourcing. Overall, the market holds immense promise for advancing healthcare and improving patient outcomes.

What will be the Size of the Market During the Forecast Period?

Drug Repurposing Market Size

 Request Free Sample

The market holds significant potential in addressing unmet medical requirements and mitigating drug shortages. This approach, also known as medication or drug repositioning, involves the exploration of new therapeutic uses for existing drugs. By repositioning approved drugs for different therapeutic areas, healthcare providers can expand their therapy choices and offer life-saving pharmaceuticals to patients. The drug discovery process is typically disease-centric, target-centric, and drug-centric. However, drug repurposing adopts a more holistic approach by considering the drug's properties and potential applications beyond its initial intended use. A computer model exploring the reuse of biologic molecules in treating neglected tropical diseases (NTDs) could offer new insights into drug class for chronic lymphocytic leukemia (CLL) therapies. The drug development process for repurposed drugs is often disease-centric, target-centric, or drug-centric, depending on the approach used. Therapeutic areas such as cancer, cardiovascular diseases, and neurological disorders are major focus areas for drug repurposing. Artificial intelligence (AI) and Machine Learning (ML) and computer models are increasingly being used to predict the therapeutic efficacy of candidate drugs by analyzing their interactions with cancer cells.

Market Segmentation

The market research report provides comprehensive data (region-wise segment analysis), with forecasts and estimates in "USD million" for the period 2024-2028, as well as historical data from 2018-2022 for the following segments.

  • Type
    • Drug-centric
    • Disease-centric
    • Target-centric
  • Product Type
    • Small molecules
    • Biologics
  • Geography
    • North America
      • Canada
      • US
    • Europe
      • Germany
      • UK
      • France
    • Asia
      • China
      • India
      • Japan
    • Rest of World (ROW)

By Type Insights

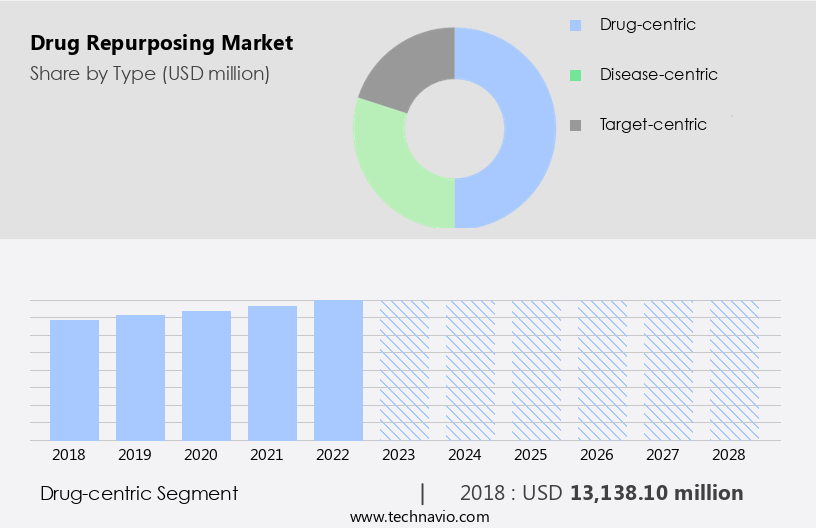
The drug-centric segment is estimated to witness significant growth during the forecast period. Drug-centric drug repurposing is an innovative strategy in the pharmaceutical industry that explores the potential of approved medications to treat new therapeutic areas based on their inherent properties and mechanisms. This approach leverages the known pharmacological profiles of existing drugs to uncover novel applications. For instance, aspirin (ASA), initially developed for its analgesic, antipyretic, and anti-inflammatory properties, has been successfully repurposed for cardiovascular disorders. Its antiplatelet effects make it a cornerstone in preventing and treating heart attacks and strokes. This drug repurposing strategy is gaining significant attention due to its potential to reduce the time and cost associated with bringing new drugs to market.

The market is expected to grow significantly due to the advantages it offers over traditional drug discovery methods. Therapeutic recycling, also known as drug repurposing, reduces the time and cost associated with clinical trials, as the safety and efficacy data for the repurposed drug are already available. In conclusion, drug-centric drug repurposing is an innovative strategy that offers significant potential for the pharmaceutical industry. By leveraging the known properties and mechanisms of existing drugs, researchers and pharmaceutical companies can uncover novel applications and address new therapeutic areas, reducing the time and cost associated with bringing new drugs to market. The use of Network Biology, Human Genomics, and Chemoproteomics is driving the growth of the market, particularly in the oncology sector.

Drug Repurposing Market Size

Get a glance at the market share of various segments Request Free Sample

The Drug-centric segment accounted for USD 13.14 billion in 2018 and showed a gradual increase during the forecast period.

Regional Insights

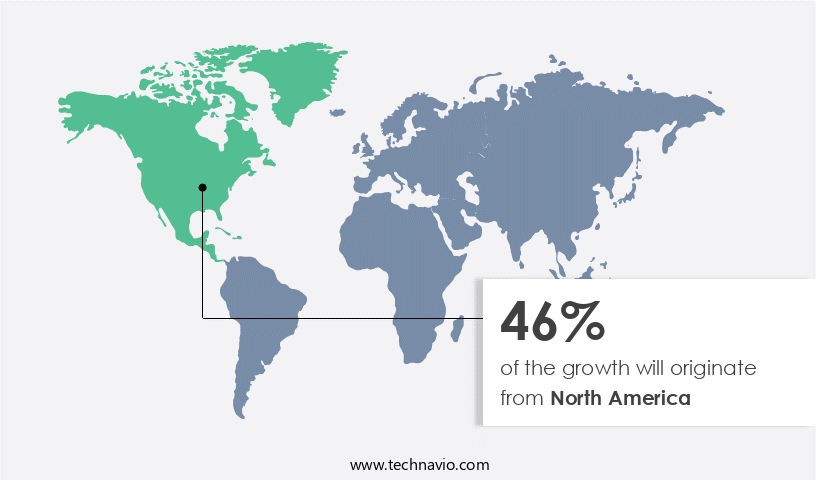
North America is estimated to contribute 46% to the growth of the global market during the forecast period. Technavio's analysts have elaborately explained the regional trends and drivers that shape the market during the forecast period.

Drug Repurposing Market Share by Geography

For more insights on the market share of various regions Request Free Sample

In North America, the market holds significant potential due to escalating healthcare demands and a well-developed pharmaceutical industry. The prevalence of chronic conditions such as heart disease and cancer necessitates innovative treatment options. The US Advanced Research Projects Agency for Health (ARPA-H) recognized this need and awarded a USD48.3 million contract to Every Cure in February 2024. This investment aims to discover new therapeutic uses for existing drugs, addressing unmet medical requirements and potentially saving countless lives. North America's advanced research infrastructure and established pharmaceutical sector create an ideal environment for drug repurposing initiatives. This market trend is expected to continue, as the need for efficient and cost-effective solutions to address unmet medical needs remains a priority.

Our researchers analyzed the data with 2023 as the base year, along with the key drivers, trends, and challenges. A holistic analysis of drivers will help companies refine their marketing strategies to gain a competitive advantage.

Market Driver

The growing use of drug repurposing for cancer treatment is the key driver of the market. The market in the United States is witnessing significant growth, particularly in the therapeutic area of cancer treatment. Traditional methods of discovering new drug applications have relied on serendipitous findings. However, leading research institutions like the Broad Institute and Dana-Farber Cancer Institute are adopting a more deliberate approach. They employ systematic methodologies to identify potential targets for drug repurposing, with a focus on developing new cancer therapies. This strategic shift offers several advantages. It streamlines the drug discovery process by allowing researchers to bypass the initial safety testing hurdles. Furthermore, it reduces the time and resources required to bring new drugs to market.

Biologics and small molecules are both subject to this repurposing trend, as the therapeutic potential of existing medications is explored in greater depth. This systematic approach is a game-changer in the drug development landscape.

Market Trends

Investment in drug repurposing is the upcoming trend in the market. The market in the United States is experiencing significant growth, driven by increased investment and government support. Every Cure, a leading player in this field, recently secured a three-year contract worth USD48.3 million from the US Advanced Research Projects Agency for Health (ARPA-H). This investment underscores the importance of drug repurposing in the pharmaceutical industry and the potential for innovative discoveries. To accelerate the discovery process, a collaborative approach is being adopted. A portal has been established to facilitate contributions from various stakeholders, including researchers, healthcare providers, and patients. This collective expertise and insights are expected to expedite the identification of new therapeutic applications, ultimately benefiting those with unmet medical needs.

Artificial Intelligence (AI) plays a crucial role in drug repurposing by aiding in dosage prediction and identifying potential applications for existing drugs. Antimicrobials and broad-spectrum therapeutics are among the therapeutic areas that have seen success through drug repurposing. The market for drug repurposing is anticipated to expand further, offering opportunities for companies and researchers to make a significant impact on healthcare. Investing in drug repurposing is considered a cost-effective and less risky alternative to traditional drug development. As the market continues to grow, it is essential to stay informed about the latest developments and trends.

Market Challenge

Regulatory challenges associated with drug repurposing is a key challenge affecting the market growth. Biotechnology advancements have led to an increased focus on drug repurposing as a cost-effective and efficient alternative to traditional drug development. Drug repurposing involves reusing existing medications for new indications, including the treatment of tumors. While this approach offers several advantages, such as a known safety profile and established human use, securing marketing authorization from regulatory bodies like the FDA, EMA, and MHRA remains a challenge. Regulatory agencies mandate rigorous clinical trials to evaluate the safety and efficacy of repurposed medications for new indications. These trials can involve extensive preclinical and clinical phases, similar to the development process for novel drugs.

Although the existing drugs' known safety profile can streamline the approval process, hurdles remain. Unlike traditional drug development, repurposing projects typically bypass preclinical testing. Healthcare providers and researchers are increasingly turning to computer models and advanced analytics to predict the potential efficacy and safety of repurposed drugs, streamlining the development process and reducing costs. In conclusion, drug repurposing offers a promising avenue for the discovery of new treatments for various diseases, including tumors. However, securing regulatory approval for repurposed drugs presents significant challenges. Regulatory bodies require comprehensive clinical trials to evaluate safety and efficacy, which can involve extensive preclinical and clinical phases. Despite these challenges, the use of computer models and advanced analytics is helping to streamline the development process and reduce costs.

Exclusive Customer Landscape

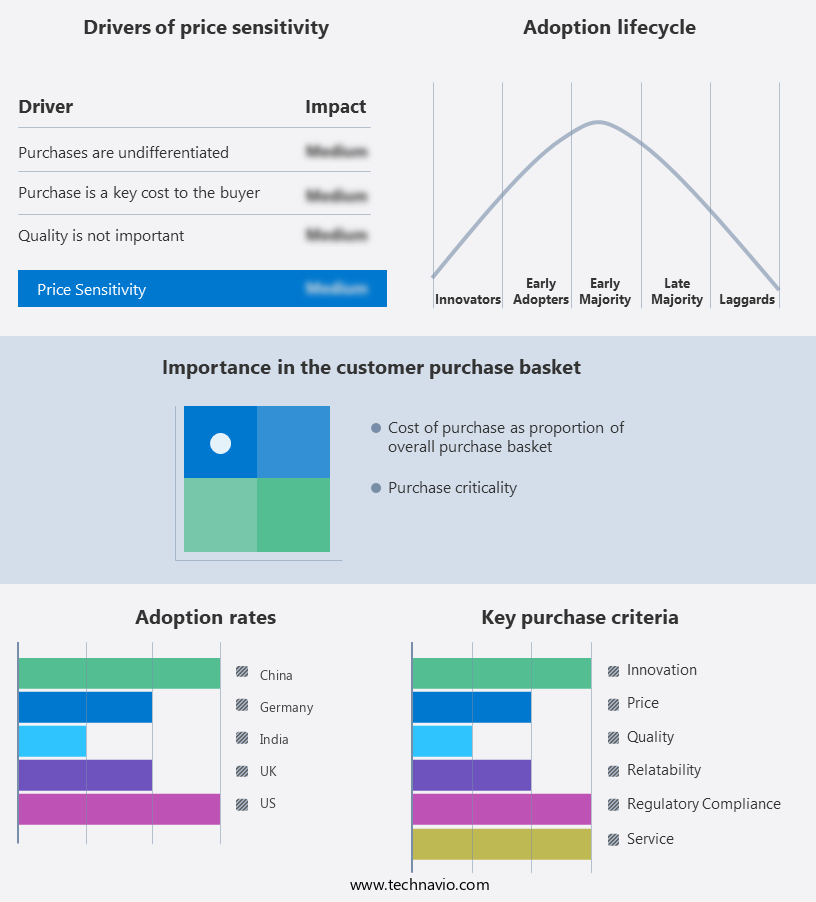
The market forecasting report includes the adoption lifecycle of the market, covering from the innovator's stage to the laggard's stage. It focuses on adoption rates in different regions based on penetration. Furthermore, the report also includes key purchase criteria and drivers of price sensitivity to help companies evaluate and develop their market growth analysis strategies.

Drug Repurposing Market Share by Geography

 Customer Landscape

Key Companies & Market Insights

Companies are implementing various strategies, such as strategic alliances, partnerships, mergers and acquisitions, geographical expansion, and product/service launches, to enhance their presence in the market.

AbbVie Inc: The company offers a repurposed drug called Ritonavir -Norvir, which was initially an HIV protease inhibitor, and is now used to boost other HIV medications.

The market research and growth report includes detailed analyses of the competitive landscape of the market and information about key companies, including:

  • Amgen Inc.
  • AstraZeneca Plc
  • Biogen Inc.
  • Bristol Myers Squibb Co.
  • Eli Lilly and Co.
  • Gilead Sciences Inc.
  • Johnson and Johnson Services Inc.
  • Merck and Co. Inc.
  • Novartis AG
  • Pfizer Inc.
  • Regeneron Pharmaceuticals Inc.
  • Teva Pharmaceutical Industries Ltd.
  • Vertex Pharmaceuticals Inc.

Qualitative and quantitative analysis of companies has been conducted to help clients understand the wider business environment as well as the strengths and weaknesses of key market players. Data is qualitatively analyzed to categorize companies as pure play, category-focused, industry-focused, and diversified; it is quantitatively analyzed to categorize companies as dominant, leading, strong, tentative, and weak.

Research Analyst Overview

The market is witnessing significant growth due to the unmet medical requirements and drug shortages in various therapeutic areas. Medication repurposing, also known as drug repositioning, involves the use of existing drugs for therapeutic purposes in new indications. This approach can help expand the therapeutic options for healthcare providers and patients, especially in cases where life-saving pharmaceuticals are scarce. Biotechnology advancements, including network biology, human genomics, chemoproteomics, and artificial intelligence (AI), are playing a crucial role in drug discovery and repurposing. These technologies enable the identification of new therapeutic uses for drug compounds through the analysis of disease-centric, target-centric, and drug-centric data.

Cancer and chronic diseases, such as oncology and multiple sclerosis (MS), are some of the therapeutic areas that have seen significant progress in drug repurposing. For instance, small molecule drugs initially developed for tumor treatment have been repurposed for antimicrobial therapy, demonstrating the potential of broad-spectrum therapeutics. Clinical evaluation and clinical trials are essential steps in the drug development process for both new indications and repurposed drugs. Consultancy services and collaborations between biotech companies and big pharma are also driving the market forward. The success bar for drug repurposing is high, with a significant number of candidate drugs failing in clinical trials due to lack of therapeutic efficacy.

However, the potential benefits of drug repurposing make it an attractive area for investment and innovation.

Market Scope

Report Coverage

Details

Page number

198

Base year

2023

Historic period

2018-2022

Forecast period

2024-2028

Growth momentum & CAGR

Accelerate at a CAGR of 4.3%

Market growth 2024-2028

USD 8.58 billion

Market structure

Concentrated

YoY growth 2023-2024(%)

4.0

Regional analysis

North America, Europe, Asia, and Rest of World (ROW)

Performing market contribution

North America at 46%

Key countries

US, China, Germany, UK, India, France, Japan, Canada, Australia, and Brazil

Competitive landscape

Leading Companies, Market Positioning of Companies, Competitive Strategies, and Industry Risks

Key companies profiled

AbbVie Inc., Amgen Inc., AstraZeneca Plc, Biogen Inc., Bristol Myers Squibb Co., Eli Lilly and Co., Gilead Sciences Inc., Johnson and Johnson Services Inc., Merck and Co. Inc., Novartis AG, Pfizer Inc., Regeneron Pharmaceuticals Inc., Teva Pharmaceutical Industries Ltd., and Vertex Pharmaceuticals Inc.

Market dynamics

Parent market analysis, market growth inducers and obstacles, market forecast, fast-growing and slow-growing segment analysis, COVID-19 impact and recovery analysis and future consumer dynamics, market condition analysis for the forecast period

Customization purview

If our market report has not included the data that you are looking for, you can reach out to our analysts and get segments customized.

Request Free Sample

What are the Key Data Covered in this Market Research and Growth Report?

  • CAGR of the market during the forecast period
  • Detailed information on factors that will drive the market growth and forecasting between 2024 and 2028
  • Precise estimation of the size of the market  and its contribution of the market in focus to the parent market
  • Accurate predictions about upcoming market growth and trends and changes in consumer behaviour
  • Growth of the market across North America, Europe, Asia, and Rest of World (ROW)
  • Thorough analysis of the market's competitive landscape and detailed information about companies
  • Comprehensive analysis of factors that will challenge the growth of market companies

We can help! Our analysts can customize this market research report to meet your requirements. Get in touch

1 Executive Summary

  • 1.1 Market overview
    • Executive Summary - Chart on Market Overview
    • Executive Summary - Data Table on Market Overview
    • Executive Summary - Chart on Global Market Characteristics
    • Executive Summary - Chart on Market by Geography
    • Executive Summary - Chart on Market Segmentation by Type
    • Executive Summary - Chart on Market Segmentation by Product Type
    • Executive Summary - Chart on Incremental Growth
    • Executive Summary - Data Table on Incremental Growth
    • Executive Summary - Chart on Company Market Positioning

2 Technavio Analysis

  • 2.1 Analysis of price sensitivity, lifecycle, customer purchase basket, adoption rates, and purchase criteria
    • Analysis of price sensitivity, lifecycle, customer purchase basket, adoption rates, and purchase criteria
  • 2.2 Criticality of inputs and Factors of differentiation
    • Overview on criticality of inputs and factors of differentiation
  • 2.3 Factors of disruption
    • Overview on factors of disruption
  • 2.4 Impact of drivers and challenges
    • Impact of drivers and challenges in 2023 and 2028

3 Market Landscape

  • 3.1 Market ecosystem
    • Parent Market
    • Data Table on - Parent Market
  • 3.2 Market characteristics
    • Market characteristics analysis
  • 3.3 Value chain analysis
    • Value Chain Analysis

4 Market Sizing

  • 4.1 Market definition
    • Offerings of companies included in the market definition
  • 4.2 Market segment analysis
    • Market segments
  • 4.3 Market size 2023
    • 4.4 Market outlook: Forecast for 2023-2028
      • Chart on Global - Market size and forecast 2023-2028 ($ million)
      • Data Table on Global - Market size and forecast 2023-2028 ($ million)
      • Chart on Global Market: Year-over-year growth 2023-2028 (%)
      • Data Table on Global Market: Year-over-year growth 2023-2028 (%)

    5 Historic Market Size

    • 5.1 Global Drug Repurposing Market 2018 - 2022
      • Historic Market Size - Data Table on Global Drug Repurposing Market 2018 - 2022 ($ million)
    • 5.2 Type segment analysis 2018 - 2022
      • Historic Market Size - Type Segment 2018 - 2022 ($ million)
    • 5.3 Product Type segment analysis 2018 - 2022
      • Historic Market Size - Product Type Segment 2018 - 2022 ($ million)
    • 5.4 Geography segment analysis 2018 - 2022
      • Historic Market Size - Geography Segment 2018 - 2022 ($ million)
    • 5.5 Country segment analysis 2018 - 2022
      • Historic Market Size - Country Segment 2018 - 2022 ($ million)

    6 Qualitative Analysis

    • 6.1 Impact of AI on Global Drug Repurposing Market

      7 Five Forces Analysis

      • 7.1 Five forces summary
        • Five forces analysis - Comparison between 2023 and 2028
      • 7.2 Bargaining power of buyers
        • Bargaining power of buyers - Impact of key factors 2023 and 2028
      • 7.3 Bargaining power of suppliers
        • Bargaining power of suppliers - Impact of key factors in 2023 and 2028
      • 7.4 Threat of new entrants
        • Threat of new entrants - Impact of key factors in 2023 and 2028
      • 7.5 Threat of substitutes
        • Threat of substitutes - Impact of key factors in 2023 and 2028
      • 7.6 Threat of rivalry
        • Threat of rivalry - Impact of key factors in 2023 and 2028
      • 7.7 Market condition
        • Chart on Market condition - Five forces 2023 and 2028

      8 Market Segmentation by Type

      • 8.1 Market segments
        • Chart on Type - Market share 2023-2028 (%)
        • Data Table on Type - Market share 2023-2028 (%)
      • 8.2 Comparison by Type
        • Chart on Comparison by Type
        • Data Table on Comparison by Type
      • 8.3 Drug-centric - Market size and forecast 2023-2028
        • Chart on Drug-centric - Market size and forecast 2023-2028 ($ million)
        • Data Table on Drug-centric - Market size and forecast 2023-2028 ($ million)
        • Chart on Drug-centric - Year-over-year growth 2023-2028 (%)
        • Data Table on Drug-centric - Year-over-year growth 2023-2028 (%)
      • 8.4 Disease-centric - Market size and forecast 2023-2028
        • Chart on Disease-centric - Market size and forecast 2023-2028 ($ million)
        • Data Table on Disease-centric - Market size and forecast 2023-2028 ($ million)
        • Chart on Disease-centric - Year-over-year growth 2023-2028 (%)
        • Data Table on Disease-centric - Year-over-year growth 2023-2028 (%)
      • 8.5 Target-centric - Market size and forecast 2023-2028
        • Chart on Target-centric - Market size and forecast 2023-2028 ($ million)
        • Data Table on Target-centric - Market size and forecast 2023-2028 ($ million)
        • Chart on Target-centric - Year-over-year growth 2023-2028 (%)
        • Data Table on Target-centric - Year-over-year growth 2023-2028 (%)
      • 8.6 Market opportunity by Type
        • Market opportunity by Type ($ million)
        • Data Table on Market opportunity by Type ($ million)

      9 Market Segmentation by Product Type

      • 9.1 Market segments
        • Chart on Product Type - Market share 2023-2028 (%)
        • Data Table on Product Type - Market share 2023-2028 (%)
      • 9.2 Comparison by Product Type
        • Chart on Comparison by Product Type
        • Data Table on Comparison by Product Type
      • 9.3 Small molecules - Market size and forecast 2023-2028
        • Chart on Small molecules - Market size and forecast 2023-2028 ($ million)
        • Data Table on Small molecules - Market size and forecast 2023-2028 ($ million)
        • Chart on Small molecules - Year-over-year growth 2023-2028 (%)
        • Data Table on Small molecules - Year-over-year growth 2023-2028 (%)
      • 9.4 Biologics - Market size and forecast 2023-2028
        • Chart on Biologics - Market size and forecast 2023-2028 ($ million)
        • Data Table on Biologics - Market size and forecast 2023-2028 ($ million)
        • Chart on Biologics - Year-over-year growth 2023-2028 (%)
        • Data Table on Biologics - Year-over-year growth 2023-2028 (%)
      • 9.5 Market opportunity by Product Type
        • Market opportunity by Product Type ($ million)
        • Data Table on Market opportunity by Product Type ($ million)

      10 Customer Landscape

      • 10.1 Customer landscape overview
        • Analysis of price sensitivity, lifecycle, customer purchase basket, adoption rates, and purchase criteria

      11 Geographic Landscape

      • 11.1 Geographic segmentation
        • Chart on Market share by geography 2023-2028 (%)
        • Data Table on Market share by geography 2023-2028 (%)
      • 11.2 Geographic comparison
        • Chart on Geographic comparison
        • Data Table on Geographic comparison
      • 11.3 North America - Market size and forecast 2023-2028
        • Chart on North America - Market size and forecast 2023-2028 ($ million)
        • Data Table on North America - Market size and forecast 2023-2028 ($ million)
        • Chart on North America - Year-over-year growth 2023-2028 (%)
        • Data Table on North America - Year-over-year growth 2023-2028 (%)
      • 11.4 Europe - Market size and forecast 2023-2028
        • Chart on Europe - Market size and forecast 2023-2028 ($ million)
        • Data Table on Europe - Market size and forecast 2023-2028 ($ million)
        • Chart on Europe - Year-over-year growth 2023-2028 (%)
        • Data Table on Europe - Year-over-year growth 2023-2028 (%)
      • 11.5 Asia - Market size and forecast 2023-2028
        • Chart on Asia - Market size and forecast 2023-2028 ($ million)
        • Data Table on Asia - Market size and forecast 2023-2028 ($ million)
        • Chart on Asia - Year-over-year growth 2023-2028 (%)
        • Data Table on Asia - Year-over-year growth 2023-2028 (%)
      • 11.6 Rest of World (ROW) - Market size and forecast 2023-2028
        • Chart on Rest of World (ROW) - Market size and forecast 2023-2028 ($ million)
        • Data Table on Rest of World (ROW) - Market size and forecast 2023-2028 ($ million)
        • Chart on Rest of World (ROW) - Year-over-year growth 2023-2028 (%)
        • Data Table on Rest of World (ROW) - Year-over-year growth 2023-2028 (%)
      • 11.7 US - Market size and forecast 2023-2028
        • Chart on US - Market size and forecast 2023-2028 ($ million)
        • Data Table on US - Market size and forecast 2023-2028 ($ million)
        • Chart on US - Year-over-year growth 2023-2028 (%)
        • Data Table on US - Year-over-year growth 2023-2028 (%)
      • 11.8 China - Market size and forecast 2023-2028
        • Chart on China - Market size and forecast 2023-2028 ($ million)
        • Data Table on China - Market size and forecast 2023-2028 ($ million)
        • Chart on China - Year-over-year growth 2023-2028 (%)
        • Data Table on China - Year-over-year growth 2023-2028 (%)
      • 11.9 Germany - Market size and forecast 2023-2028
        • Chart on Germany - Market size and forecast 2023-2028 ($ million)
        • Data Table on Germany - Market size and forecast 2023-2028 ($ million)
        • Chart on Germany - Year-over-year growth 2023-2028 (%)
        • Data Table on Germany - Year-over-year growth 2023-2028 (%)
      • 11.10 UK - Market size and forecast 2023-2028
        • Chart on UK - Market size and forecast 2023-2028 ($ million)
        • Data Table on UK - Market size and forecast 2023-2028 ($ million)
        • Chart on UK - Year-over-year growth 2023-2028 (%)
        • Data Table on UK - Year-over-year growth 2023-2028 (%)
      • 11.11 India - Market size and forecast 2023-2028
        • Chart on India - Market size and forecast 2023-2028 ($ million)
        • Data Table on India - Market size and forecast 2023-2028 ($ million)
        • Chart on India - Year-over-year growth 2023-2028 (%)
        • Data Table on India - Year-over-year growth 2023-2028 (%)
      • 11.12 France - Market size and forecast 2023-2028
        • Chart on France - Market size and forecast 2023-2028 ($ million)
        • Data Table on France - Market size and forecast 2023-2028 ($ million)
        • Chart on France - Year-over-year growth 2023-2028 (%)
        • Data Table on France - Year-over-year growth 2023-2028 (%)
      • 11.13 Japan - Market size and forecast 2023-2028
        • Chart on Japan - Market size and forecast 2023-2028 ($ million)
        • Data Table on Japan - Market size and forecast 2023-2028 ($ million)
        • Chart on Japan - Year-over-year growth 2023-2028 (%)
        • Data Table on Japan - Year-over-year growth 2023-2028 (%)
      • 11.14 Canada - Market size and forecast 2023-2028
        • Chart on Canada - Market size and forecast 2023-2028 ($ million)
        • Data Table on Canada - Market size and forecast 2023-2028 ($ million)
        • Chart on Canada - Year-over-year growth 2023-2028 (%)
        • Data Table on Canada - Year-over-year growth 2023-2028 (%)
      • 11.15 Australia - Market size and forecast 2023-2028
        • Chart on Australia - Market size and forecast 2023-2028 ($ million)
        • Data Table on Australia - Market size and forecast 2023-2028 ($ million)
        • Chart on Australia - Year-over-year growth 2023-2028 (%)
        • Data Table on Australia - Year-over-year growth 2023-2028 (%)
      • 11.16 Brazil - Market size and forecast 2023-2028
        • Chart on Brazil - Market size and forecast 2023-2028 ($ million)
        • Data Table on Brazil - Market size and forecast 2023-2028 ($ million)
        • Chart on Brazil - Year-over-year growth 2023-2028 (%)
        • Data Table on Brazil - Year-over-year growth 2023-2028 (%)
      • 11.17 Market opportunity by geography
        • Market opportunity by geography ($ million)
        • Data Tables on Market opportunity by geography ($ million)

      12 Drivers, Challenges, and Opportunity/Restraints

      • 12.1 Market drivers
        • 12.2 Market challenges
          • 12.3 Impact of drivers and challenges
            • Impact of drivers and challenges in 2023 and 2028
          • 12.4 Market opportunities/restraints

            13 Competitive Landscape

            • 13.1 Overview
              • 13.2 Competitive Landscape
                • Overview on criticality of inputs and factors of differentiation
              • 13.3 Landscape disruption
                • Overview on factors of disruption
              • 13.4 Industry risks
                • Impact of key risks on business

              14 Competitive Analysis

              • 14.1 Companies profiled
                • Companies covered
              • 14.2 Company ranking index
                • Company ranking index
              • 14.3 Market positioning of companies
                • Matrix on companies position and classification
              • 14.4 AbbVie Inc.
                • AbbVie Inc. - Overview
                • AbbVie Inc. - Product / Service
                • AbbVie Inc. - Key news
                • AbbVie Inc. - Key offerings
                • SWOT
              • 14.5 Amgen Inc.
                • Amgen Inc. - Overview
                • Amgen Inc. - Product / Service
                • Amgen Inc. - Key news
                • Amgen Inc. - Key offerings
                • SWOT
              • 14.6 AstraZeneca Plc
                • AstraZeneca Plc - Overview
                • AstraZeneca Plc - Product / Service
                • AstraZeneca Plc - Key news
                • AstraZeneca Plc - Key offerings
                • SWOT
              • 14.7 Biogen Inc.
                • Biogen Inc. - Overview
                • Biogen Inc. - Product / Service
                • Biogen Inc. - Key news
                • Biogen Inc. - Key offerings
                • SWOT
              • 14.8 Bristol Myers Squibb Co.
                • Bristol Myers Squibb Co. - Overview
                • Bristol Myers Squibb Co. - Product / Service
                • Bristol Myers Squibb Co. - Key news
                • Bristol Myers Squibb Co. - Key offerings
                • SWOT
              • 14.9 Eli Lilly and Co.
                • Eli Lilly and Co. - Overview
                • Eli Lilly and Co. - Product / Service
                • Eli Lilly and Co. - Key offerings
                • SWOT
              • 14.10 Gilead Sciences Inc.
                • Gilead Sciences Inc. - Overview
                • Gilead Sciences Inc. - Product / Service
                • Gilead Sciences Inc. - Key news
                • Gilead Sciences Inc. - Key offerings
                • SWOT
              • 14.11 Johnson and Johnson Services Inc.
                • Johnson and Johnson Services Inc. - Overview
                • Johnson and Johnson Services Inc. - Business segments
                • Johnson and Johnson Services Inc. - Key news
                • Johnson and Johnson Services Inc. - Key offerings
                • Johnson and Johnson Services Inc. - Segment focus
                • SWOT
              • 14.12 Merck and Co. Inc.
                • Merck and Co. Inc. - Overview
                • Merck and Co. Inc. - Business segments
                • Merck and Co. Inc. - Key news
                • Merck and Co. Inc. - Key offerings
                • Merck and Co. Inc. - Segment focus
                • SWOT
              • 14.13 Novartis AG
                • Novartis AG - Overview
                • Novartis AG - Business segments
                • Novartis AG - Key news
                • Novartis AG - Key offerings
                • Novartis AG - Segment focus
                • SWOT
              • 14.14 Pfizer Inc.
                • Pfizer Inc. - Overview
                • Pfizer Inc. - Product / Service
                • Pfizer Inc. - Key news
                • Pfizer Inc. - Key offerings
                • SWOT
              • 14.15 Regeneron Pharmaceuticals Inc.
                • Regeneron Pharmaceuticals Inc. - Overview
                • Regeneron Pharmaceuticals Inc. - Product / Service
                • Regeneron Pharmaceuticals Inc. - Key offerings
                • SWOT
              • 14.16 Teva Pharmaceutical Industries Ltd.
                • Teva Pharmaceutical Industries Ltd. - Overview
                • Teva Pharmaceutical Industries Ltd. - Business segments
                • Teva Pharmaceutical Industries Ltd. - Key news
                • Teva Pharmaceutical Industries Ltd. - Key offerings
                • Teva Pharmaceutical Industries Ltd. - Segment focus
                • SWOT
              • 14.17 Vertex Pharmaceuticals Inc.
                • Vertex Pharmaceuticals Inc. - Overview
                • Vertex Pharmaceuticals Inc. - Product / Service
                • Vertex Pharmaceuticals Inc. - Key offerings
                • SWOT

              15 Appendix

              • 15.1 Scope of the report
                • 15.2 Inclusions and exclusions checklist
                  • Inclusions checklist
                  • Exclusions checklist
                • 15.3 Currency conversion rates for US$
                  • Currency conversion rates for US$
                • 15.4 Research methodology
                  • Research methodology
                • 15.5 Data procurement
                  • Information sources
                • 15.6 Data validation
                  • Data validation
                • 15.7 Validation techniques employed for market sizing
                  • Validation techniques employed for market sizing
                • 15.8 Data synthesis
                  • Data synthesis
                • 15.9 360 degree market analysis
                  • 360 degree market analysis
                • 15.10 List of abbreviations
                  • List of abbreviations
                  • o Strong geographic presence

                Research Methodology

                Technavio presents a detailed picture of the market by way of study, synthesis, and summation of data from multiple sources. The analysts have presented the various facets of the market with a particular focus on identifying the key industry influencers. The data thus presented is comprehensive, reliable, and the result of extensive research, both primary and secondary.

                INFORMATION SOURCES

                Primary sources

                • Manufacturers and suppliers
                • Channel partners
                • Industry experts
                • Strategic decision makers

                Secondary sources

                • Industry journals and periodicals
                • Government data
                • Financial reports of key industry players
                • Historical data
                • Press releases

                DATA ANALYSIS

                Data Synthesis

                • Collation of data
                • Estimation of key figures
                • Analysis of derived insights

                Data Validation

                • Triangulation with data models
                • Reference against proprietary databases
                • Corroboration with industry experts

                REPORT WRITING

                Qualitative

                • Market drivers
                • Market challenges
                • Market trends
                • Five forces analysis

                Quantitative

                • Market size and forecast
                • Market segmentation
                • Geographical insights
                • Competitive landscape

                Interested in this report?

                Get your sample now to see our research methodology and insights!

                Download Now

                Frequently Asked Questions

                Drug Repurposing market growth will increase by 8578.4 million during 2024-2028 .

                The Drug Repurposing market is expected to grow at a CAGR of 4.3% during 2024-2028 .

                Drug Repurposing market is segmented by Type( Drug-centric, Disease-centric, Target-centric) Product Type( Small molecules, Biologics)

                AbbVie Inc., Amgen Inc., AstraZeneca Plc, Biogen Inc., Bristol Myers Squibb Co., Eli Lilly and Co., Gilead Sciences Inc., Johnson and Johnson Services Inc., Merck and Co. Inc., Novartis AG, Pfizer Inc., Regeneron Pharmaceuticals Inc., Teva Pharmaceutical Industries Ltd., Vertex Pharmaceuticals Inc. are a few of the key vendors in the Drug Repurposing market.

                North America will register the highest growth rate of 46.3% among the other regions. Therefore, the Drug Repurposing market in North America is expected to garner significant business opportunities for the vendors during the forecast period.

                US, China, Germany, UK, India, France, Japan, Canada, Australia, Brazil

                • Growing use of drug repurposing for cancer treatmentThe global drug repurposing market is increasingly focusing on cancer treatment is the driving factor this market.
                • driven by systematic research efforts that uncover new therapeutic uses for existing medications. Historically is the driving factor this market.
                • new applications for drugs have often been discovered serendipitously. However is the driving factor this market.
                • a more structured approach is now being adopted by leading research institutions such as the Broad Institute and the Dana-Farber Cancer Institute. These organizations are leveraging systematic methodologies to identify novel targets for drug repurposing is the driving factor this market.
                • specifically aimed at developing new cancer therapies. This strategic shift is significant for several reasons. First is the driving factor this market.
                • it enhances the efficiency of the drug development process. By repurposing existing drugs is the driving factor this market.
                • researchers can bypass many of the early-stage hurdles associated with drug discovery is the driving factor this market.
                • such as initial safety testing. This not only accelerates the timeline for bringing new treatments to market but also reduces the overall cost of development. Given the high costs and lengthy timelines traditionally associated with cancer drug development is the driving factor this market.
                • this approach offers a more viable and cost-effective pathway.Second is the driving factor this market.
                • the systematic identification of new drug targets through repurposing efforts is expanding the therapeutic arsenal available for cancer treatment. By exploring the potential of existing drugs to target novel pathways and mechanisms involved in cancer is the driving factor this market.
                • researchers are uncovering new opportunities to combat the disease. This is particularly crucial for addressing cancers that are resistant to current treatments or for which there are limited therapeutic options.Overall is the driving factor this market.
                • the increasing focus on drug repurposing for cancer treatment is anticipated to drive the growth of the global drug repurposing market during the forecast period. is the driving factor this market.

                The Drug Repurposing market vendors should focus on grabbing business opportunities from the Drug-centric segment as it accounted for the largest market share in the base year.