Dry Bulk Shipping Market Analysis, Size, and Forecast 2026-2030: APAC (China, Japan, and South Korea), Europe (Germany, UK, and The Netherlands), North America (US, Canada, and Mexico), South America (Brazil and Argentina), Middle East and Africa (Saudi Arabia, South Africa, and UAE), and Rest of World (ROW)

Dry Bulk Shipping Market Analysis, Size, and Forecast 2026-2030:
APAC (China, Japan, and South Korea), Europe (Germany, UK, and The Netherlands), North America (US, Canada, and Mexico), South America (Brazil and Argentina), Middle East and Africa (Saudi Arabia, South Africa, and UAE), and Rest of World (ROW)

Published: Mar 2026 314 Pages SKU: IRTNTR71841

Market Overview at a Glance

$1.47 B
Market Opportunity
5.6%
CAGR 2025 - 2030
54.1%
APAC Growth
$1.92 B
Capesize segment 2024

Dry Bulk Shipping Market Size 2026-2030

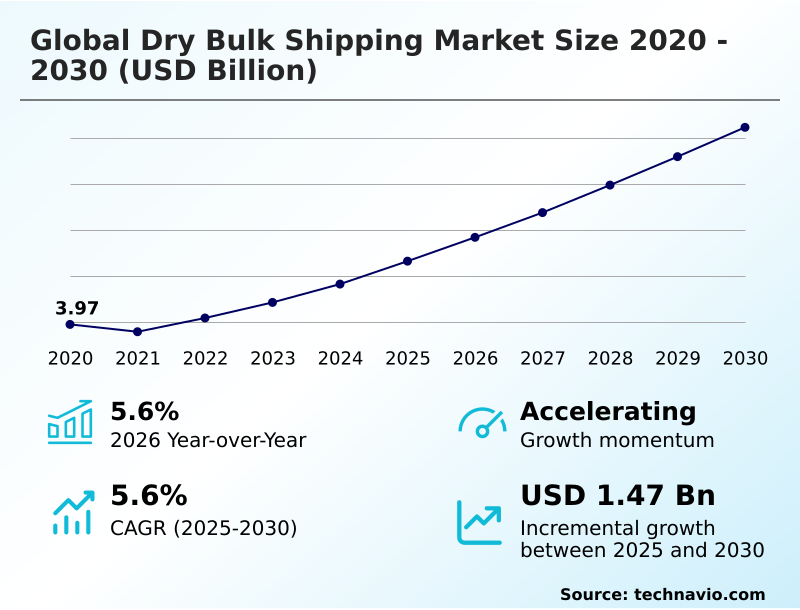
The dry bulk shipping market size is valued to increase by USD 1.47 billion, at a CAGR of 5.6% from 2025 to 2030. Expansion of global bauxite and aluminum supply chains will drive the dry bulk shipping market.

Major Market Trends & Insights

  • APAC dominated the market and accounted for a 54.1% growth during the forecast period.
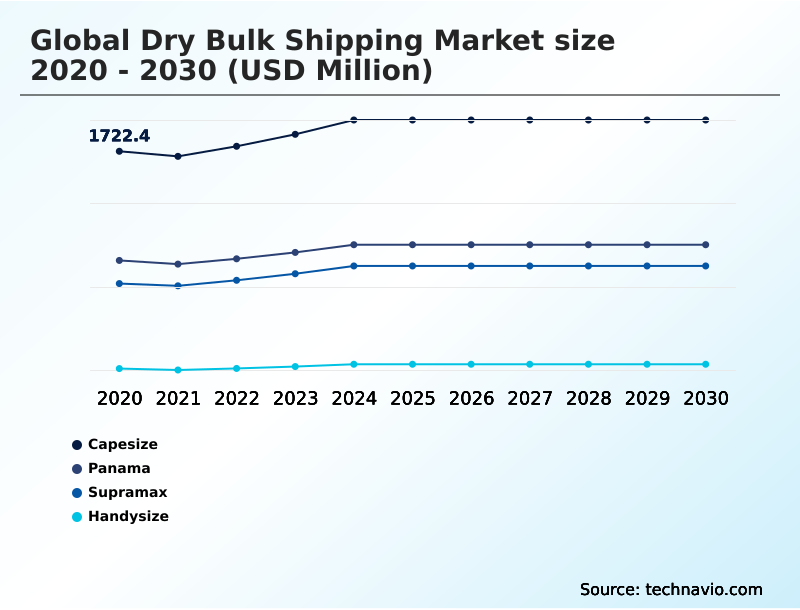
  • By Product - Capesize segment was valued at USD 1.92 billion in 2024
  • By Type - Iron ore segment accounted for the largest market revenue share in 2024

Market Size & Forecast

  • Market Opportunities: USD 2.15 billion
  • Market Future Opportunities: USD 1.47 billion
  • CAGR from 2025 to 2030 : 5.6%

Market Summary

  • The Dry Bulk Shipping Market is undergoing a significant structural recalibration, moving beyond its role as a simple barometer of industrial health to become a focal point of technological and regulatory change. The sector remains fundamental to the global economy, facilitating the movement of essential raw materials for manufacturing and agriculture.
  • However, its trajectory is now shaped by a complex interplay of forces. The industrial appetite of emerging economies continues to fuel demand, but this is tempered by volatile freight rates and an urgent need for fleet modernization.
  • A key scenario is the shipowner's dilemma: investing millions in retrofitting an older vessel to meet new decarbonization mandates, such as the Carbon Intensity Indicator (CII), or commissioning a newbuild with unproven alternative marine fuels technology like ammonia-ready engines. This decision carries immense financial risk, as choosing the wrong path could lead to stranded assets.
  • Simultaneously, geopolitical instability is rerouting traditional maritime logistics chains, increasing voyage lengths and tightening vessel supply. This dynamic landscape necessitates a strategic shift toward operational resilience, advanced voyage planning optimization, and investment in technologies that support sustainable shipping practices to maintain profitability.

What will be the Size of the Dry Bulk Shipping Market during the forecast period?

Get Key Insights on Market Forecast (PDF) Request Free Sample

How is the Dry Bulk Shipping Market Segmented?

The dry bulk shipping industry research report provides comprehensive data (region-wise segment analysis), with forecasts and estimates in "USD million" for the period 2026-2030, as well as historical data from 2020-2024 for the following segments.

  • Product
    • Capesize
    • Panama
    • Supramax
    • Handysize
  • Type
    • Iron ore
    • Coal
    • Grains
    • Bauxite
    • Others
  • Service type
    • Gearless bulk carriers
    • Conventional bulkers
    • Self-dischargers
    • OBO
    • Bulker lakers
  • Geography
    • APAC
      • China
      • Japan
      • South Korea
    • Europe
      • Germany
      • UK
      • The Netherlands
    • North America
      • US
      • Canada
      • Mexico
    • South America
      • Brazil
      • Argentina
    • Middle East and Africa
      • Saudi Arabia
      • South Africa
      • UAE
    • Rest of World (ROW)

By Product Insights

The capesize segment is estimated to witness significant growth during the forecast period.

The capesize segment, comprising the largest vessels, is pivotal for long-haul trade routes, primarily facilitating iron ore transport. These ships rely on deep-water port facilities, and their demand is shaped by industrial output in major economies.

A critical shift is underway as new mining projects commence, creating new trans-oceanic trade routes that structurally increase tonne-mile demand, providing a long-term catalyst for fleet utilization even amid geopolitical trade disruption.

This evolution reshapes global supply chains and drives port infrastructure modernization. Concurrently, decarbonization mandates are pushing operators to invest in dual-fuel technologies, with smart port technologies enhancing efficiency.

The segment's reliance on a few key commodities, like high-grade ore with over 65% iron content, underscores its strategic importance in global industrial logistics.

Request Free Sample

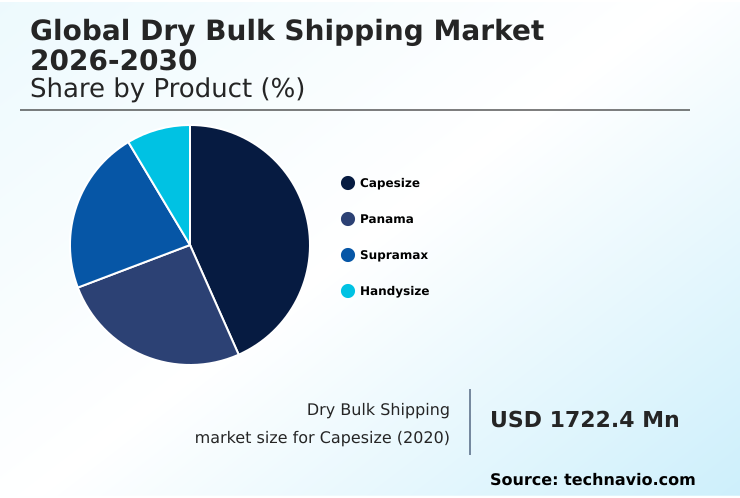
The Capesize segment was valued at USD 1.92 billion in 2024 and showed a gradual increase during the forecast period.

Request Free Sample

Regional Analysis

APAC is estimated to contribute 54.1% to the growth of the global market during the forecast period.Technavio’s analysts have elaborately explained the regional trends and drivers that shape the market during the forecast period.

See How Dry Bulk Shipping Market Demand is Rising in APAC Request Free Sample

The geographic landscape of the dry bulk shipping market is dominated by APAC, which accounts for over 54% of the global opportunity, driven by the vast industrial demand from China and India.

This region's consumption of iron ore and coal sets the tone for the global dry bulk freight market. Europe and North America represent the next significant tiers, contributing approximately 19.7% and 19.6% respectively.

These mature markets are pivotal for grain shipments and specialized bulk carriers, with a strong focus on sustainable shipping practices and adherence to global shipping regulations.

The North American market, in particular, leverages sophisticated inland waterway logistics to connect agricultural heartlands with global seaborne commodity trade routes.

South America and the Middle East and Africa, while smaller, are crucial supply hubs for minerals and are witnessing investment in deep-water port facilities to support long-haul trade routes.

Market Dynamics

Our researchers analyzed the data with 2025 as the base year, along with the key drivers, trends, and challenges. A holistic analysis of drivers will help companies refine their marketing strategies to gain a competitive advantage.

  • Navigating the modern dry bulk sector requires a deep understanding of interconnected strategic challenges and opportunities. The impact of the simandou project on capesize demand is a clear example, fundamentally altering long-haul trade dynamics and putting pressure on existing port infrastructure.
  • At the same time, the industry grapples with the pervasive decarbonization challenges for dry bulk shipping, forcing a reevaluation of vessel design and propulsion systems. This has spurred investment in eco-efficient bulk carriers and accelerated research into LNG as a transition fuel for shipping.
  • Technology adoption in port-to-ship coordination is becoming a key differentiator, with many operators integrating digital twins in port operations to reduce turnaround times. Optimizing fleet utilization with AI is no longer a futuristic concept but a present-day necessity for managing freight rate volatility in shipping.
  • However, geopolitical risks in maritime trade corridors remain a persistent threat, complicating the future of coal transport in dry bulk and reshaping bauxite shipping routes from guinea to china. The industry also faces the structural challenges of newbuild tonnage oversupply, which can erode profitability.
  • In this context, the role of panamax vessels in global grain trade remains a stabilizing force, alongside the impact of agricultural trade on shipping demand. Fleet management now involves complex decisions regarding the effects of imo regulations on vessel design, the strategic deployment of a supramax vessel for minor bulk transport, and a handysize vessel deployment for regional trade.
  • Effective maritime supply chain risk mitigation strategies are paramount, as is improving cargo handling with geared bulkers. This complex environment has seen operators face an influx of new capacity, the highest since 2020, making operational efficiency more critical than ever.

What are the key market drivers leading to the rise in the adoption of Dry Bulk Shipping Industry?

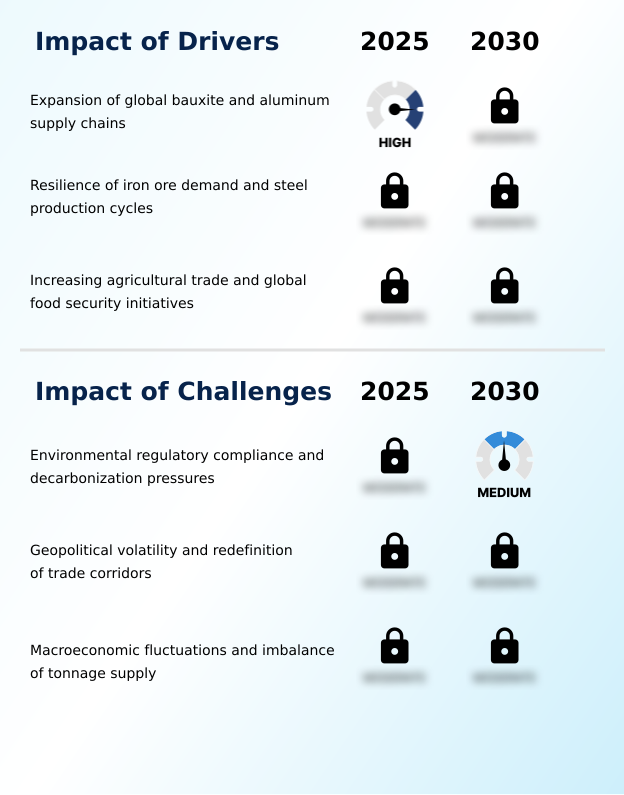
  • The expansion of global bauxite and aluminum supply chains, driven by demand from green energy and automotive sectors, serves as a primary driver for the market.

  • Market growth is propelled by robust demand from key industrial and agricultural sectors, alongside the structural expansion of specific commodity supply chains.
  • The seaborne bauxite trade has become a critical driver, with exports from key regions expected to grow by more than 8% annually, fueling the need for specialized bulk carriers on long-haul trade routes.
  • This is complemented by the resilience of iron ore transport, a foundational component of the dry bulk freight market. Furthermore, expanding global agricultural trade, driven by food security initiatives, ensures steady demand for panamax carriers and supramax vessels.
  • Bulk commodity exports from certain North American ports have seen a nearly 6% rise, underscoring the critical role of established logistics hubs.
  • This diversified demand underscores the need for ongoing vessel fleet optimization and strategic fleet renewal strategy programs to meet evolving cargo requirements.

What are the market trends shaping the Dry Bulk Shipping Industry?

  • A key market trend is the emergence of West African high-grade ore exports. This development is structurally increasing tonne-mile demand, particularly for large-capacity vessels.

  • Market dynamics are increasingly shaped by the geographic diversification of commodity sources and the integration of advanced technologies. A primary trend is the development of new high-grade ore projects, which structurally increases tonne-mile demand for capesize vessels as voyages become approximately three times longer than traditional routes.
  • This shift, driven by steelmakers seeking ore with over 65% iron content to boost efficiency, supports freight rate stability. Concurrently, the push for operational efficiency is accelerating the adoption of autonomous navigation and real-time port visibility tools. This move toward automation, coupled with the integration of digital twin technology, enhances the predictability of the maritime logistics chain.
  • The integration of these systems has been shown to improve arrival time precision, reducing costly time spent at anchor by up to 20% in digitally advanced ports.

What challenges does the Dry Bulk Shipping Industry face during its growth?

  • Stringent environmental regulatory compliance and mounting decarbonization pressures present a significant challenge affecting operational costs and investment decisions across the industry.

  • The market faces significant headwinds from stringent global shipping regulations and macroeconomic volatility. The intensifying pressure for environmental compliance, particularly the mandate for shipping companies to provide 100% European Union Allowances for emissions on intra-bloc voyages, introduces direct financial burdens and reporting complexities.
  • This is compounded by escalating geopolitical volatility, which has contributed to a 12.3% year-on-year increase in shipping corridor stress, forcing costly vessel diversions and increasing maritime risk management costs. Furthermore, a persistent imbalance between vessel supply and demand, exacerbated by a massive influx of newbuild vessel delivery, creates downward pressure on charter rates.
  • This vessel oversupply impact is a structural challenge that threatens to erode profitability, forcing operators to focus on efficiency to navigate an increasingly crowded market.

Exclusive Technavio Analysis on Customer Landscape

The dry bulk shipping market forecasting report includes the adoption lifecycle of the market, covering from the innovator’s stage to the laggard’s stage. It focuses on adoption rates in different regions based on penetration. Furthermore, the dry bulk shipping market report also includes key purchase criteria and drivers of price sensitivity to help companies evaluate and develop their market growth analysis strategies.

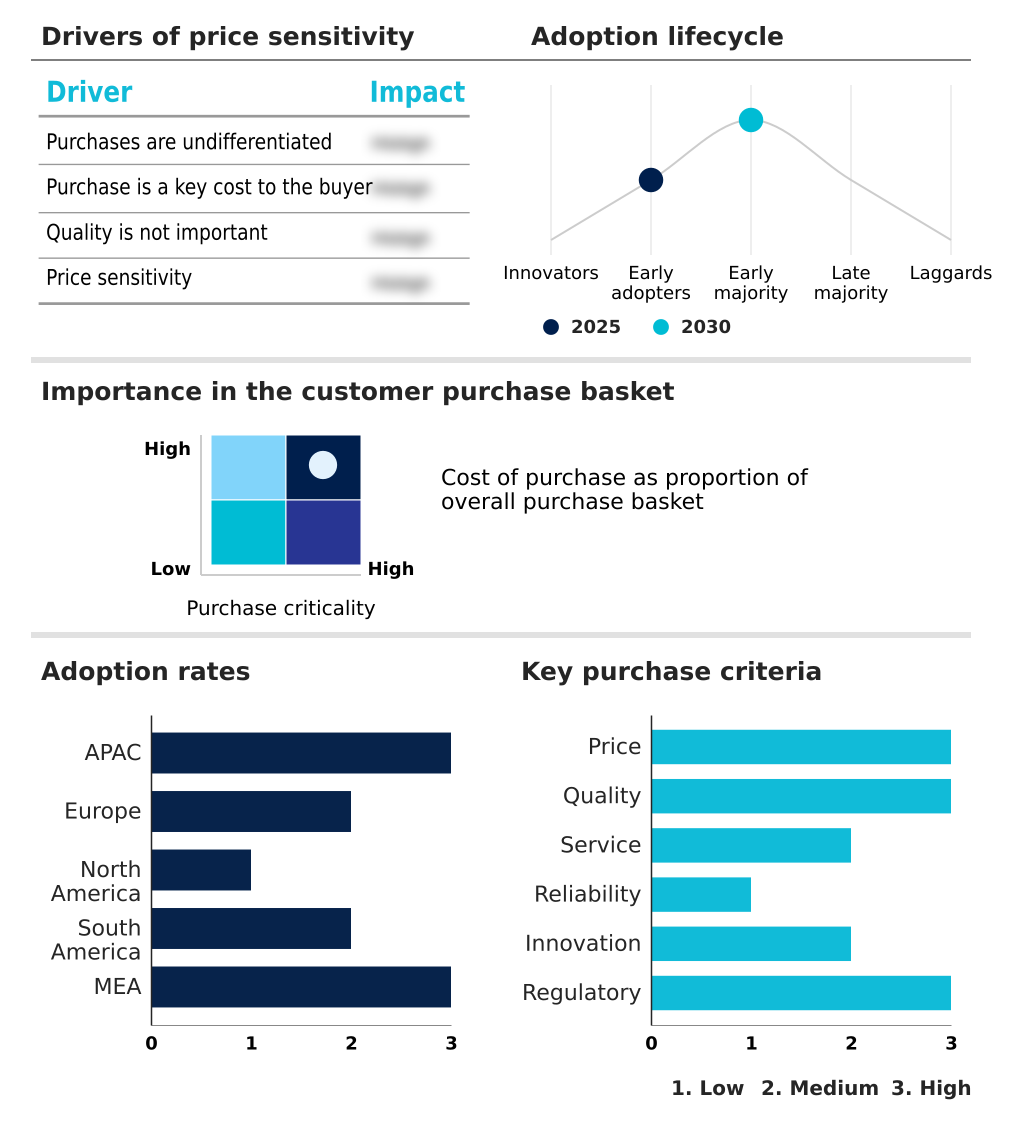
Customer Landscape of Dry Bulk Shipping Industry

Competitive Landscape

Companies are implementing various strategies, such as strategic alliances, dry bulk shipping market forecast, partnerships, mergers and acquisitions, geographical expansion, and product/service launches, to enhance their presence in the industry.

AP Moller Maersk AS - Provides integrated dry bulk shipping for energy and industrial commodities, complementing its extensive container transport operations and enhancing global supply chain logistics.

The industry research and growth report includes detailed analyses of the competitive landscape of the market and information about key companies, including:

  • AP Moller Maersk AS
  • Berge Bulk Ltd.
  • Cargill Inc.
  • COSCO Shipping Ports Ltd.
  • Diana Shipping Inc.
  • Egon Oldendorff Management GmbH
  • Gearbulk Holding AG
  • Genco Shipping and Trading Ltd.
  • Golden Ocean Group Ltd.
  • Grindrod Shipping Holdings Ltd
  • Hapag Lloyd AG
  • HMM Europe Ltd.
  • John Swire and Sons Ltd.
  • Kawasaki Kisen Kaisha Ltd.
  • Mitsui O.S.K. Lines Ltd.
  • Nippon Yusen Kabushiki Kaisha
  • Pacific Basin Shipping Ltd.
  • Pan Ocean Co. Ltd.
  • Precious Shipping Public Co.
  • Star Bulk Carriers Corp.

Qualitative and quantitative analysis of companies has been conducted to help clients understand the wider business environment as well as the strengths and weaknesses of key industry players. Data is qualitatively analyzed to categorize companies as pure play, category-focused, industry-focused, and diversified; it is quantitatively analyzed to categorize companies as dominant, leading, strong, tentative, and weak.

Recent Development and News in Dry bulk shipping market

  • In December, 2025, Golden Ocean Group Ltd. merged with CMB.TECH, creating a scaled-up entity focused on decarbonization and future-proof shipping solutions, as reported in industry analyses of maritime consolidation trends.
  • In November, 2025, the first commercial cargo from the Simandou project, totaling nearly two hundred thousand tonnes of high-grade iron ore, arrived in China, marking the operational start of a major new trade lane from Guinea, according to commodity trade reports.
  • In August, 2025, the United States government officially removed the USD 800 de minimis tax exemption for low-value imports, a policy shift that significantly altered customs documentation and overhead costs for bulk-related maritime logistics services, as outlined in federal trade notices.
  • In March, 2025, the finalization of the UK-India Free Trade Agreement catalyzed a surge in demand for gearless bulk carriers, driven by reduced tariffs on industrial raw materials and increased import quotas for Indian steel manufacturers, according to government trade publications.

Dive into Technavio’s robust research methodology, blending expert interviews, extensive data synthesis, and validated models for unparalleled Dry Bulk Shipping Market insights. See full methodology.

Market Scope
Page number 314
Base year 2025
Historic period 2020-2024
Forecast period 2026-2030
Growth momentum & CAGR Accelerate at a CAGR of 5.6%
Market growth 2026-2030 USD 1466.5 million
Market structure Fragmented
YoY growth 2025-2026(%) 5.6%
Key countries China, Japan, South Korea, India, Indonesia, Australia, Greece, Germany, Norway, UK, The Netherlands, Spain, US, Canada, Mexico, Brazil, Argentina, Chile, Saudi Arabia, South Africa, UAE, Egypt and Morocco
Competitive landscape Leading Companies, Market Positioning of Companies, Competitive Strategies, and Industry Risks

Request Free Sample

Research Analyst Overview

  • The dry bulk shipping market is navigating a period of profound transformation, where operational decisions are increasingly dictated by decarbonization mandates and technological advancements. The core function of facilitating iron ore transport and coal shipments remains, but the methods and associated risks have evolved.
  • A central theme is the industry's response to the Energy Efficiency Existing Ship Index (EEXI) and Carbon Intensity Indicator (CII), which compel a shift toward alternative marine fuels and significant investment in fleet modernization. This includes the adoption of ammonia-ready engines and liquefied natural gas (LNG) propulsion.
  • Concurrently, digitalization is reshaping the landscape through autonomous navigation and real-time port visibility, with digital twin technology enabling predictive maintenance and vessel fleet optimization. These tools are crucial for managing persistent freight rate volatility. The expansion of bauxite trade and resilient grain shipments provide diversified demand streams, supported by geared bulk carriers and specialized vessels for minor bulk commodities.
  • Boardroom-level strategy is now heavily influenced by maritime risk, with corridor stress metrics increasing by over 12%, forcing a greater focus on ballast water management and port infrastructure modernization to ensure supply chain integrity.

What are the Key Data Covered in this Dry Bulk Shipping Market Research and Growth Report?

  • What is the expected growth of the Dry Bulk Shipping Market between 2026 and 2030?

    • USD 1.47 billion, at a CAGR of 5.6%

  • What segmentation does the market report cover?

    • The report is segmented by Product (Capesize, Panama, Supramax, and Handysize), Type (Iron ore, Coal, Grains, Bauxite, and Others), Service Type (Gearless bulk carriers, Conventional bulkers, Self-dischargers, OBO, and Bulker lakers) and Geography (APAC, Europe, North America, South America, Middle East and Africa)

  • Which regions are analyzed in the report?

    • APAC, Europe, North America, South America and Middle East and Africa

  • What are the key growth drivers and market challenges?

    • Expansion of global bauxite and aluminum supply chains, Environmental regulatory compliance and decarbonization pressures

  • Who are the major players in the Dry Bulk Shipping Market?

    • AP Moller Maersk AS, Berge Bulk Ltd., Cargill Inc., COSCO Shipping Ports Ltd., Diana Shipping Inc., Egon Oldendorff Management GmbH, Gearbulk Holding AG, Genco Shipping and Trading Ltd., Golden Ocean Group Ltd., Grindrod Shipping Holdings Ltd, Hapag Lloyd AG, HMM Europe Ltd., John Swire and Sons Ltd., Kawasaki Kisen Kaisha Ltd., Mitsui O.S.K. Lines Ltd., Nippon Yusen Kabushiki Kaisha, Pacific Basin Shipping Ltd., Pan Ocean Co. Ltd., Precious Shipping Public Co. and Star Bulk Carriers Corp.

Market Research Insights

  • The dry bulk shipping market is defined by a dynamic interplay between supply-side pressures and evolving demand patterns. A critical factor is the persistent vessel oversupply impact, which often suppresses earnings, even as operators achieve greater cargo handling efficiency.
  • This imbalance is compounded by geopolitical trade disruption, which has led to a 12.3% increase in shipping corridor stress, complicating voyage planning optimization and increasing operational risks. Concurrently, demand is being reshaped by regional trade agreements and a focus on maritime supply chain resilience.
  • For instance, enhanced inland waterway logistics in North America have contributed to a 6% rise in bulk commodity exports from key ports, highlighting the importance of integrated transport networks. Operators are responding by accelerating fleet renewal strategy programs and adopting smart port technologies to improve turnaround times and navigate this complex environment.

We can help! Our analysts can customize this dry bulk shipping market research report to meet your requirements.

Get in touch

1. Executive Summary

1.1 Market overview

Executive Summary - Chart on Market Overview
Executive Summary - Data Table on Market Overview
Executive Summary - Chart on Global Market Characteristics
Executive Summary - Chart on Market by Geography
Executive Summary - Chart on Market Segmentation by Product
Executive Summary - Chart on Market Segmentation by Type
Executive Summary - Chart on Market Segmentation by Service Type
Executive Summary - Chart on Incremental Growth
Executive Summary - Data Table on Incremental Growth
Executive Summary - Chart on Company Market Positioning

2. Technavio Analysis

2.1 Analysis of price sensitivity, lifecycle, customer purchase basket, adoption rates, and purchase criteria

2.2 Criticality of inputs and Factors of differentiation

Chart on Overview on criticality of inputs and factors of differentiation

2.3 Factors of disruption

Chart on Overview on factors of disruption

2.4 Impact of drivers and challenges

Chart on Impact of drivers and challenges in 2025 and 2030

3. Market Landscape

3.1 Market ecosystem

Chart on Parent Market
Data Table on - Parent Market

3.2 Market characteristics

Chart on Market characteristics analysis

3.3 Value chain analysis

Chart on Value chain analysis

4. Market Sizing

4.1 Market definition

Data Table on Offerings of companies included in the market definition

4.2 Market segment analysis

Market segments

4.3 Market size 2025

4.4 Market outlook: Forecast for 2025-2030

Chart on Global - Market size and forecast 2025-2030 ($ million)
Data Table on Global - Market size and forecast 2025-2030 ($ million)
Chart on Global Market: Year-over-year growth 2025-2030 (%)
Data Table on Global Market: Year-over-year growth 2025-2030 (%)

5. Historic Market Size

5.1 Global Dry Bulk Shipping Market 2020 - 2024

Historic Market Size - Data Table on Global Dry Bulk Shipping Market 2020 - 2024 ($ million)

5.2 Product segment analysis 2020 - 2024

Historic Market Size - Product Segment 2020 - 2024 ($ million)

5.3 Type segment analysis 2020 - 2024

Historic Market Size - Type Segment 2020 - 2024 ($ million)

5.4 Service Type segment analysis 2020 - 2024

Historic Market Size - Service Type Segment 2020 - 2024 ($ million)

5.5 Geography segment analysis 2020 - 2024

Historic Market Size - Geography Segment 2020 - 2024 ($ million)

5.6 Country segment analysis 2020 - 2024

Historic Market Size - Country Segment 2020 - 2024 ($ million)

6. Qualitative Analysis

6.1 Impact of AI in global dry bulk shipping market

7. Five Forces Analysis

7.1 Five forces summary

Five forces analysis - Comparison between 2025 and 2030

7.2 Bargaining power of buyers

Bargaining power of buyers - Impact of key factors 2025 and 2030

7.3 Bargaining power of suppliers

Bargaining power of suppliers - Impact of key factors in 2025 and 2030

7.4 Threat of new entrants

Threat of new entrants - Impact of key factors in 2025 and 2030

7.5 Threat of substitutes

Threat of substitutes - Impact of key factors in 2025 and 2030

7.6 Threat of rivalry

Threat of rivalry - Impact of key factors in 2025 and 2030

7.7 Market condition

Chart on Market condition - Five forces 2025 and 2030

8. Market Segmentation by Product

8.1 Market segments

Chart on Product - Market share 2025-2030 (%)
Data Table on Product - Market share 2025-2030 (%)

8.2 Comparison by Product

Chart on Comparison by Product
Data Table on Comparison by Product

8.3 Capesize - Market size and forecast 2025-2030

Chart on Capesize - Market size and forecast 2025-2030 ($ million)
Data Table on Capesize - Market size and forecast 2025-2030 ($ million)
Chart on Capesize - Year-over-year growth 2025-2030 (%)
Data Table on Capesize - Year-over-year growth 2025-2030 (%)

8.4 Panama - Market size and forecast 2025-2030

Chart on Panama - Market size and forecast 2025-2030 ($ million)
Data Table on Panama - Market size and forecast 2025-2030 ($ million)
Chart on Panama - Year-over-year growth 2025-2030 (%)
Data Table on Panama - Year-over-year growth 2025-2030 (%)

8.5 Supramax - Market size and forecast 2025-2030

Chart on Supramax - Market size and forecast 2025-2030 ($ million)
Data Table on Supramax - Market size and forecast 2025-2030 ($ million)
Chart on Supramax - Year-over-year growth 2025-2030 (%)
Data Table on Supramax - Year-over-year growth 2025-2030 (%)

8.6 Handysize - Market size and forecast 2025-2030

Chart on Handysize - Market size and forecast 2025-2030 ($ million)
Data Table on Handysize - Market size and forecast 2025-2030 ($ million)
Chart on Handysize - Year-over-year growth 2025-2030 (%)
Data Table on Handysize - Year-over-year growth 2025-2030 (%)

8.7 Market opportunity by Product

Market opportunity by Product ($ million)
Data Table on Market opportunity by Product ($ million)

9. Market Segmentation by Type

9.1 Market segments

Chart on Type - Market share 2025-2030 (%)
Data Table on Type - Market share 2025-2030 (%)

9.2 Comparison by Type

Chart on Comparison by Type
Data Table on Comparison by Type

9.3 Iron ore - Market size and forecast 2025-2030

Chart on Iron ore - Market size and forecast 2025-2030 ($ million)
Data Table on Iron ore - Market size and forecast 2025-2030 ($ million)
Chart on Iron ore - Year-over-year growth 2025-2030 (%)
Data Table on Iron ore - Year-over-year growth 2025-2030 (%)

9.4 Coal - Market size and forecast 2025-2030

Chart on Coal - Market size and forecast 2025-2030 ($ million)
Data Table on Coal - Market size and forecast 2025-2030 ($ million)
Chart on Coal - Year-over-year growth 2025-2030 (%)
Data Table on Coal - Year-over-year growth 2025-2030 (%)

9.5 Grains - Market size and forecast 2025-2030

Chart on Grains - Market size and forecast 2025-2030 ($ million)
Data Table on Grains - Market size and forecast 2025-2030 ($ million)
Chart on Grains - Year-over-year growth 2025-2030 (%)
Data Table on Grains - Year-over-year growth 2025-2030 (%)

9.6 Bauxite - Market size and forecast 2025-2030

Chart on Bauxite - Market size and forecast 2025-2030 ($ million)
Data Table on Bauxite - Market size and forecast 2025-2030 ($ million)
Chart on Bauxite - Year-over-year growth 2025-2030 (%)
Data Table on Bauxite - Year-over-year growth 2025-2030 (%)

9.7 Others - Market size and forecast 2025-2030

Chart on Others - Market size and forecast 2025-2030 ($ million)
Data Table on Others - Market size and forecast 2025-2030 ($ million)
Chart on Others - Year-over-year growth 2025-2030 (%)
Data Table on Others - Year-over-year growth 2025-2030 (%)

9.8 Market opportunity by Type

Market opportunity by Type ($ million)
Data Table on Market opportunity by Type ($ million)

10. Market Segmentation by Service Type

10.1 Market segments

Chart on Service Type - Market share 2025-2030 (%)
Data Table on Service Type - Market share 2025-2030 (%)

10.2 Comparison by Service Type

Chart on Comparison by Service Type
Data Table on Comparison by Service Type

10.3 Gearless bulk carriers - Market size and forecast 2025-2030

Chart on Gearless bulk carriers - Market size and forecast 2025-2030 ($ million)
Data Table on Gearless bulk carriers - Market size and forecast 2025-2030 ($ million)
Chart on Gearless bulk carriers - Year-over-year growth 2025-2030 (%)
Data Table on Gearless bulk carriers - Year-over-year growth 2025-2030 (%)

10.4 Conventional bulkers - Market size and forecast 2025-2030

Chart on Conventional bulkers - Market size and forecast 2025-2030 ($ million)
Data Table on Conventional bulkers - Market size and forecast 2025-2030 ($ million)
Chart on Conventional bulkers - Year-over-year growth 2025-2030 (%)
Data Table on Conventional bulkers - Year-over-year growth 2025-2030 (%)

10.5 Self-dischargers - Market size and forecast 2025-2030

Chart on Self-dischargers - Market size and forecast 2025-2030 ($ million)
Data Table on Self-dischargers - Market size and forecast 2025-2030 ($ million)
Chart on Self-dischargers - Year-over-year growth 2025-2030 (%)
Data Table on Self-dischargers - Year-over-year growth 2025-2030 (%)

10.6 OBO - Market size and forecast 2025-2030

Chart on OBO - Market size and forecast 2025-2030 ($ million)
Data Table on OBO - Market size and forecast 2025-2030 ($ million)
Chart on OBO - Year-over-year growth 2025-2030 (%)
Data Table on OBO - Year-over-year growth 2025-2030 (%)

10.7 Bulker lakers - Market size and forecast 2025-2030

Chart on Bulker lakers - Market size and forecast 2025-2030 ($ million)
Data Table on Bulker lakers - Market size and forecast 2025-2030 ($ million)
Chart on Bulker lakers - Year-over-year growth 2025-2030 (%)
Data Table on Bulker lakers - Year-over-year growth 2025-2030 (%)

10.8 Market opportunity by Service Type

Market opportunity by Service Type ($ million)
Data Table on Market opportunity by Service Type ($ million)

11. Customer Landscape

11.1 Customer landscape overview

Analysis of price sensitivity, lifecycle, customer purchase basket, adoption rates, and purchase criteria

12. Geographic Landscape

12.1 Geographic segmentation

Chart on Market share by geography 2025-2030 (%)
Data Table on Market share by geography 2025-2030 (%)

12.2 Geographic comparison

Chart on Geographic comparison
Data Table on Geographic comparison

12.3 APAC - Market size and forecast 2025-2030

Chart on APAC - Market size and forecast 2025-2030 ($ million)
Data Table on APAC - Market size and forecast 2025-2030 ($ million)
Chart on APAC - Year-over-year growth 2025-2030 (%)
Data Table on APAC - Year-over-year growth 2025-2030 (%)
Chart on Regional Comparison - APAC
Data Table on Regional Comparison - APAC

12.3.1 China - Market size and forecast 2025-2030

Chart on China - Market size and forecast 2025-2030 ($ million)
Data Table on China - Market size and forecast 2025-2030 ($ million)
Chart on China - Year-over-year growth 2025-2030 (%)
Data Table on China - Year-over-year growth 2025-2030 (%)

12.3.2 Japan - Market size and forecast 2025-2030

Chart on Japan - Market size and forecast 2025-2030 ($ million)
Data Table on Japan - Market size and forecast 2025-2030 ($ million)
Chart on Japan - Year-over-year growth 2025-2030 (%)
Data Table on Japan - Year-over-year growth 2025-2030 (%)

12.3.3 South Korea - Market size and forecast 2025-2030

Chart on South Korea - Market size and forecast 2025-2030 ($ million)
Data Table on South Korea - Market size and forecast 2025-2030 ($ million)
Chart on South Korea - Year-over-year growth 2025-2030 (%)
Data Table on South Korea - Year-over-year growth 2025-2030 (%)

12.3.4 India - Market size and forecast 2025-2030

Chart on India - Market size and forecast 2025-2030 ($ million)
Data Table on India - Market size and forecast 2025-2030 ($ million)
Chart on India - Year-over-year growth 2025-2030 (%)
Data Table on India - Year-over-year growth 2025-2030 (%)

12.3.5 Indonesia - Market size and forecast 2025-2030

Chart on Indonesia - Market size and forecast 2025-2030 ($ million)
Data Table on Indonesia - Market size and forecast 2025-2030 ($ million)
Chart on Indonesia - Year-over-year growth 2025-2030 (%)
Data Table on Indonesia - Year-over-year growth 2025-2030 (%)

12.3.6 Australia - Market size and forecast 2025-2030

Chart on Australia - Market size and forecast 2025-2030 ($ million)
Data Table on Australia - Market size and forecast 2025-2030 ($ million)
Chart on Australia - Year-over-year growth 2025-2030 (%)
Data Table on Australia - Year-over-year growth 2025-2030 (%)

12.4 Europe - Market size and forecast 2025-2030

Chart on Europe - Market size and forecast 2025-2030 ($ million)
Data Table on Europe - Market size and forecast 2025-2030 ($ million)
Chart on Europe - Year-over-year growth 2025-2030 (%)
Data Table on Europe - Year-over-year growth 2025-2030 (%)
Chart on Regional Comparison - Europe
Data Table on Regional Comparison - Europe

12.4.1 Greece - Market size and forecast 2025-2030

Chart on Greece - Market size and forecast 2025-2030 ($ million)
Data Table on Greece - Market size and forecast 2025-2030 ($ million)
Chart on Greece - Year-over-year growth 2025-2030 (%)
Data Table on Greece - Year-over-year growth 2025-2030 (%)

12.4.2 Germany - Market size and forecast 2025-2030

Chart on Germany - Market size and forecast 2025-2030 ($ million)
Data Table on Germany - Market size and forecast 2025-2030 ($ million)
Chart on Germany - Year-over-year growth 2025-2030 (%)
Data Table on Germany - Year-over-year growth 2025-2030 (%)

12.4.3 Norway - Market size and forecast 2025-2030

Chart on Norway - Market size and forecast 2025-2030 ($ million)
Data Table on Norway - Market size and forecast 2025-2030 ($ million)
Chart on Norway - Year-over-year growth 2025-2030 (%)
Data Table on Norway - Year-over-year growth 2025-2030 (%)

12.4.4 UK - Market size and forecast 2025-2030

Chart on UK - Market size and forecast 2025-2030 ($ million)
Data Table on UK - Market size and forecast 2025-2030 ($ million)
Chart on UK - Year-over-year growth 2025-2030 (%)
Data Table on UK - Year-over-year growth 2025-2030 (%)

12.4.5 The Netherlands - Market size and forecast 2025-2030

Chart on The Netherlands - Market size and forecast 2025-2030 ($ million)
Data Table on The Netherlands - Market size and forecast 2025-2030 ($ million)
Chart on The Netherlands - Year-over-year growth 2025-2030 (%)
Data Table on The Netherlands - Year-over-year growth 2025-2030 (%)

12.4.6 Spain - Market size and forecast 2025-2030

Chart on Spain - Market size and forecast 2025-2030 ($ million)
Data Table on Spain - Market size and forecast 2025-2030 ($ million)
Chart on Spain - Year-over-year growth 2025-2030 (%)
Data Table on Spain - Year-over-year growth 2025-2030 (%)

12.5 North America - Market size and forecast 2025-2030

Chart on North America - Market size and forecast 2025-2030 ($ million)
Data Table on North America - Market size and forecast 2025-2030 ($ million)
Chart on North America - Year-over-year growth 2025-2030 (%)
Data Table on North America - Year-over-year growth 2025-2030 (%)
Chart on Regional Comparison - North America
Data Table on Regional Comparison - North America

12.5.1 US - Market size and forecast 2025-2030

Chart on US - Market size and forecast 2025-2030 ($ million)
Data Table on US - Market size and forecast 2025-2030 ($ million)
Chart on US - Year-over-year growth 2025-2030 (%)
Data Table on US - Year-over-year growth 2025-2030 (%)

12.5.2 Canada - Market size and forecast 2025-2030

Chart on Canada - Market size and forecast 2025-2030 ($ million)
Data Table on Canada - Market size and forecast 2025-2030 ($ million)
Chart on Canada - Year-over-year growth 2025-2030 (%)
Data Table on Canada - Year-over-year growth 2025-2030 (%)

12.5.3 Mexico - Market size and forecast 2025-2030

Chart on Mexico - Market size and forecast 2025-2030 ($ million)
Data Table on Mexico - Market size and forecast 2025-2030 ($ million)
Chart on Mexico - Year-over-year growth 2025-2030 (%)
Data Table on Mexico - Year-over-year growth 2025-2030 (%)

12.6 South America - Market size and forecast 2025-2030

Chart on South America - Market size and forecast 2025-2030 ($ million)
Data Table on South America - Market size and forecast 2025-2030 ($ million)
Chart on South America - Year-over-year growth 2025-2030 (%)
Data Table on South America - Year-over-year growth 2025-2030 (%)
Chart on Regional Comparison - South America
Data Table on Regional Comparison - South America

12.6.1 Brazil - Market size and forecast 2025-2030

Chart on Brazil - Market size and forecast 2025-2030 ($ million)
Data Table on Brazil - Market size and forecast 2025-2030 ($ million)
Chart on Brazil - Year-over-year growth 2025-2030 (%)
Data Table on Brazil - Year-over-year growth 2025-2030 (%)

12.6.2 Argentina - Market size and forecast 2025-2030

Chart on Argentina - Market size and forecast 2025-2030 ($ million)
Data Table on Argentina - Market size and forecast 2025-2030 ($ million)
Chart on Argentina - Year-over-year growth 2025-2030 (%)
Data Table on Argentina - Year-over-year growth 2025-2030 (%)

12.6.3 Chile - Market size and forecast 2025-2030

Chart on Chile - Market size and forecast 2025-2030 ($ million)
Data Table on Chile - Market size and forecast 2025-2030 ($ million)
Chart on Chile - Year-over-year growth 2025-2030 (%)
Data Table on Chile - Year-over-year growth 2025-2030 (%)

12.7 Middle East and Africa - Market size and forecast 2025-2030

Chart on Middle East and Africa - Market size and forecast 2025-2030 ($ million)
Data Table on Middle East and Africa - Market size and forecast 2025-2030 ($ million)
Chart on Middle East and Africa - Year-over-year growth 2025-2030 (%)
Data Table on Middle East and Africa - Year-over-year growth 2025-2030 (%)
Chart on Regional Comparison - Middle East and Africa
Data Table on Regional Comparison - Middle East and Africa

12.7.1 Saudi Arabia - Market size and forecast 2025-2030

Chart on Saudi Arabia - Market size and forecast 2025-2030 ($ million)
Data Table on Saudi Arabia - Market size and forecast 2025-2030 ($ million)
Chart on Saudi Arabia - Year-over-year growth 2025-2030 (%)
Data Table on Saudi Arabia - Year-over-year growth 2025-2030 (%)

12.7.2 South Africa - Market size and forecast 2025-2030

Chart on South Africa - Market size and forecast 2025-2030 ($ million)
Data Table on South Africa - Market size and forecast 2025-2030 ($ million)
Chart on South Africa - Year-over-year growth 2025-2030 (%)
Data Table on South Africa - Year-over-year growth 2025-2030 (%)

12.7.3 UAE - Market size and forecast 2025-2030

Chart on UAE - Market size and forecast 2025-2030 ($ million)
Data Table on UAE - Market size and forecast 2025-2030 ($ million)
Chart on UAE - Year-over-year growth 2025-2030 (%)
Data Table on UAE - Year-over-year growth 2025-2030 (%)

12.7.4 Egypt - Market size and forecast 2025-2030

Chart on Egypt - Market size and forecast 2025-2030 ($ million)
Data Table on Egypt - Market size and forecast 2025-2030 ($ million)
Chart on Egypt - Year-over-year growth 2025-2030 (%)
Data Table on Egypt - Year-over-year growth 2025-2030 (%)

12.7.5 Morocco - Market size and forecast 2025-2030

Chart on Morocco - Market size and forecast 2025-2030 ($ million)
Data Table on Morocco - Market size and forecast 2025-2030 ($ million)
Chart on Morocco - Year-over-year growth 2025-2030 (%)
Data Table on Morocco - Year-over-year growth 2025-2030 (%)

12.8 Market opportunity by geography

Market opportunity by geography ($ million)
Data Tables on Market opportunity by geography ($ million)

13. Drivers, Challenges, and Opportunity

13.1 Market drivers

Expansion of global bauxite and aluminum supply chains
Resilience of iron ore demand and steel production cycles
Increasing agricultural trade and global food security initiatives

13.2 Market challenges

Environmental regulatory compliance and decarbonization pressures
Geopolitical volatility and redefinition of trade corridors
Macroeconomic fluctuations and imbalance of tonnage supply

13.3 Impact of drivers and challenges

Impact of drivers and challenges in 2025 and 2030

13.4 Market opportunities

West African high-grade ore and increased tonne-mile demand
Industrial modernization and demand for minor bulk commodities
Integration of autonomous navigation and real-time port-to-ship visibility

14. Competitive Landscape

14.1 Overview

14.2

Overview on criticality of inputs and factors of differentiation

14.3 Landscape disruption

Overview on factors of disruption

14.4 Industry risks

Impact of key risks on business

15. Competitive Analysis

15.1 Companies profiled

Companies covered

15.2 Company ranking index

15.3 Market positioning of companies

Matrix on companies position and classification

15.4 AP Moller Maersk AS

AP Moller Maersk AS - Overview
AP Moller Maersk AS - Business segments
AP Moller Maersk AS - Key news
AP Moller Maersk AS - Key offerings
AP Moller Maersk AS - Segment focus
SWOT

15.5 Berge Bulk Ltd.

Berge Bulk Ltd. - Overview
Berge Bulk Ltd. - Product / Service
Berge Bulk Ltd. - Key offerings
SWOT

15.6 Cargill Inc.

Cargill Inc. - Overview
Cargill Inc. - Product / Service
Cargill Inc. - Key offerings
SWOT

15.7 COSCO Shipping Ports Ltd.

COSCO Shipping Ports Ltd. - Overview
COSCO Shipping Ports Ltd. - Business segments
COSCO Shipping Ports Ltd. - Key offerings
COSCO Shipping Ports Ltd. - Segment focus
SWOT

15.8 Diana Shipping Inc.

Diana Shipping Inc. - Overview
Diana Shipping Inc. - Product / Service
Diana Shipping Inc. - Key offerings
SWOT

15.9 Gearbulk Holding AG

Gearbulk Holding AG - Overview
Gearbulk Holding AG - Product / Service
Gearbulk Holding AG - Key offerings
SWOT

15.10 Genco Shipping and Trading Ltd.

Genco Shipping and Trading Ltd. - Overview
Genco Shipping and Trading Ltd. - Product / Service
Genco Shipping and Trading Ltd. - Key offerings
SWOT

15.11 Golden Ocean Group Ltd.

Golden Ocean Group Ltd. - Overview
Golden Ocean Group Ltd. - Product / Service
Golden Ocean Group Ltd. - Key offerings
SWOT

15.12 Hapag Lloyd AG

Hapag Lloyd AG - Overview
Hapag Lloyd AG - Product / Service
Hapag Lloyd AG - Key offerings
SWOT

15.13 John Swire and Sons Ltd.

John Swire and Sons Ltd. - Overview
John Swire and Sons Ltd. - Product / Service
John Swire and Sons Ltd. - Key offerings
SWOT

15.14 Kawasaki Kisen Kaisha Ltd.

Kawasaki Kisen Kaisha Ltd. - Overview
Kawasaki Kisen Kaisha Ltd. - Business segments
Kawasaki Kisen Kaisha Ltd. - Key offerings
Kawasaki Kisen Kaisha Ltd. - Segment focus
SWOT

15.15 Mitsui O.S.K. Lines Ltd.

Mitsui O.S.K. Lines Ltd. - Overview
Mitsui O.S.K. Lines Ltd. - Business segments
Mitsui O.S.K. Lines Ltd. - Key offerings
Mitsui O.S.K. Lines Ltd. - Segment focus
SWOT

15.16 Pacific Basin Shipping Ltd.

Pacific Basin Shipping Ltd. - Overview
Pacific Basin Shipping Ltd. - Product / Service
Pacific Basin Shipping Ltd. - Key offerings
SWOT

15.17 Pan Ocean Co. Ltd.

Pan Ocean Co. Ltd. - Overview
Pan Ocean Co. Ltd. - Product / Service
Pan Ocean Co. Ltd. - Key offerings
SWOT

15.18 Star Bulk Carriers Corp.

Star Bulk Carriers Corp. - Overview
Star Bulk Carriers Corp. - Product / Service
Star Bulk Carriers Corp. - Key offerings
SWOT

16. Appendix

16.1 Scope of the report

Market definition
Objectives
Notes and caveats

16.2 Inclusions and exclusions checklist

Inclusions checklist
Exclusions checklist

16.3 Currency conversion rates for US$

16.4 Research methodology

16.5 Data procurement

Information sources

16.6 Data validation

16.7 Validation techniques employed for market sizing

16.8 Data synthesis

16.9 360 degree market analysis

16.10 List of abbreviations

Research Methodology

Technavio presents a detailed picture of the market by way of study, synthesis, and summation of data from multiple sources. The analysts have presented the various facets of the market with a particular focus on identifying the key industry influencers. The data thus presented is comprehensive, reliable, and the result of extensive research, both primary and secondary.

INFORMATION SOURCES

Primary sources

  • Manufacturers and suppliers
  • Channel partners
  • Industry experts
  • Strategic decision makers

Secondary sources

  • Industry journals and periodicals
  • Government data
  • Financial reports of key industry players
  • Historical data
  • Press releases

DATA ANALYSIS

Data Synthesis

  • Collation of data
  • Estimation of key figures
  • Analysis of derived insights

Data Validation

  • Triangulation with data models
  • Reference against proprietary databases
  • Corroboration with industry experts

REPORT WRITING

Qualitative

  • Market drivers
  • Market challenges
  • Market trends
  • Five forces analysis

Quantitative

  • Market size and forecast
  • Market segmentation
  • Geographical insights
  • Competitive landscape

Interested in this report?

Get your sample now to see our research methodology and insights!

Download Now

Frequently Asked Questions

Dry Bulk Shipping market growth will increase by USD 1466.5 million during 2026-2030.

The Dry Bulk Shipping market is expected to grow at a CAGR of 5.6% during 2026-2030.

Dry Bulk Shipping market is segmented by Product (Capesize, Panama, Supramax, Handysize) Type (Iron ore, Coal, Grains, Bauxite, Others) Service type (Gearless bulk carriers, Conventional bulkers, Self-dischargers, OBO, Bulker lakers)

AP Moller Maersk AS, Berge Bulk Ltd., Cargill Inc., COSCO Shipping Ports Ltd., Diana Shipping Inc., Egon Oldendorff Management GmbH, Gearbulk Holding AG, Genco Shipping and Trading Ltd., Golden Ocean Group Ltd., Grindrod Shipping Holdings Ltd, Hapag Lloyd AG, HMM Europe Ltd., John Swire and Sons Ltd., Kawasaki Kisen Kaisha Ltd., Mitsui O.S.K. Lines Ltd., Nippon Yusen Kabushiki Kaisha, Pacific Basin Shipping Ltd., Pan Ocean Co. Ltd., Precious Shipping Public Co., Star Bulk Carriers Corp. are a few of the key vendors in the Dry Bulk Shipping market.

APAC will register the highest growth rate of 54.1% among the other regions. Therefore, the Dry Bulk Shipping market in APAC is expected to garner significant business opportunities for the vendors during the forecast period.

China, Japan, South Korea, India, Indonesia, Australia, Greece, Germany, Norway, UK, The Netherlands, Spain, US, Canada, Mexico, Brazil, Argentina, Chile, Saudi Arabia, South Africa, UAE, Egypt, Morocco

  • Expansion of global bauxite and aluminum supply chains is the driving factor this market.

The Dry Bulk Shipping market vendors should focus on grabbing business opportunities from the Product segment as it accounted for the largest market share in the base year.
RIA - Research AI Assistant
Ask RIA