Dry Eye Syndrome Drugs Market Analysis North America, Europe, Asia, Rest of World (ROW) - US, UK, Japan, Germany, China - Size and Forecast 2024-2028

Dry Eye Syndrome Drugs Market Analysis North America, Europe, Asia, Rest of World (ROW) - US, UK, Japan, Germany, China - Size and Forecast 2024-2028

Published: May 2024 168 Pages SKU: IRTNTR46644

Market Overview at a Glance

$2.14 B
Market Opportunity
6.16%
CAGR
5.71
YoY growth 2023-2024(%)

Dry Eye Syndrome Drugs Market Size 2024-2028 

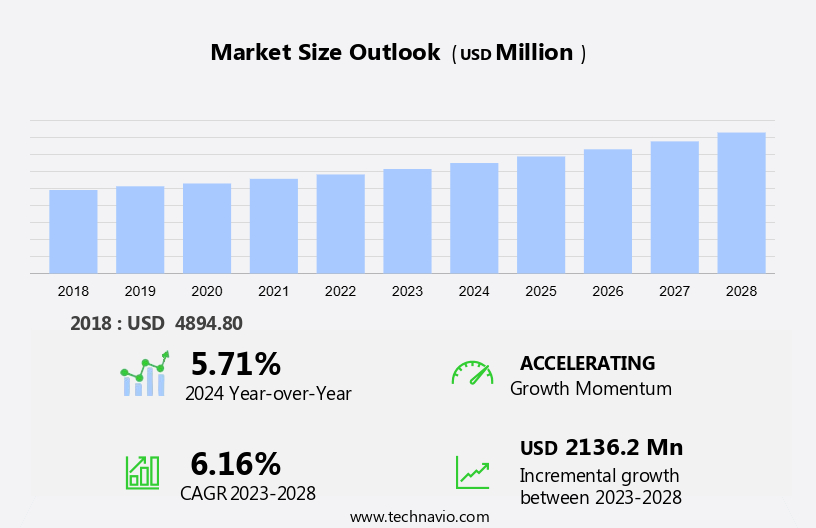
The dry eye syndrome drugs market size is forecast to increase by USD 2.14 billion, at a CAGR of 6.16% between 2023 and 2028.

  • The market's expansion hinges on numerous factors, prominently the burgeoning geriatric population with a rising incidence of health concerns. The escalating healthcare expenditure and shifting lifestyles also play pivotal roles. Furthermore, the increasing prevalence of diseases like dry eye syndrome due to modern lifestyle choices underscores the market's growth trajectory. As individuals experience prolonged screen time and environmental factors impact ocular health, the demand for dry eye syndrome treatments intensifies. These interconnected dynamics drive innovation and investment in the ophthalmic industry, propelling advancements in eye care technologies and therapies to meet the evolving needs of consumers and healthcare providers alike.

What will be the Size of the Market During the Forecast Period?

Dry Eye Syndrome Drugs Market Size

 Request Free Sample

  • Dry Eye Syndrome (DES) is a common condition affecting the geriatric population and individuals with autoimmune disorders, hormonal changes, and prolonged high screen time. Eye Care Centers and clinics offer clinical care for DES patients, including treatments from ophthalmologists and optometrists in private practices. The market is significant, with various drug manufacturers developing innovative solutions. One such development is CEQUA therapy, which utilizes nanodroplet technology for effective treatment.
  • Alternative therapies, such as nutritional supplements and acupuncture, also play a role in managing DES. Regulatory procedures for drug approval involve clinical trials to ensure safety and efficacy. Conditions like diabetes and rheumatic disorders can contribute to DES. Drug manufacturers like Alcon are actively researching and developing new treatments for DES, including those targeting specific causes, such as hormonal imbalances or blood composition alterations. The market growth is driven by the increasing prevalence of the condition and the demand for effective treatments.

How is this market segmented and which is the largest segment?

The market research report provides comprehensive data (region-wise segment analysis), with forecasts and estimates in "USD million" for the period 2024-2028, as well as historical data from 2018-2022 for the following segments.

  • Distribution Channel
    • Retail pharmacies
    • Hospital pharmacies
    • Online pharmacies
  • Product
    • OTC drugs
    • Prescription drugs
  • Geography
    • North America
      • US
    • Europe
      • Germany
      • UK
    • Asia
      • China
      • Japan
    • Rest of World (ROW)

By Distribution Channel Insights

  • The retail pharmacies segment is estimated to witness significant growth during the forecast period.

Dry Eye Disease (DED) is a multifactorial disorder characterized by ocular discomfort, visual disturbance, and tear film instability. Eye Care Centers, Eye Clinics, and private practices play a pivotal role in the distribution and availability of dry eye syndrome drugs. These centers cater to the needs of patients seeking clinical care, including Over-The-Counter (OTC) and prescription medications. Autoimmune Disorders, hormonal changes, aging, and certain medical conditions, such as Diabetes and Rheumatic conditions, contribute to the development of DED. Patients with DED may benefit from various therapies, including alternative treatments like nutritional supplements, acupuncture, and nanobiotechnology-based solutions, such as nanodroplet technology and microencapsulation.

The market is driven by the growing geriatric population, increasing healthcare infrastructure, and regulatory procedures for drug approval and clinical trials. Nanobiotechnology and microencapsulation are emerging trends in the market, with innovative products like CEQUA therapy drug and contact lenses. The market faces regulatory burden and pressure due to the complexities of drug development and approval processes. Key challenges include the high investment cost and the need for rigorous clinical trials to ensure safety and efficacy. Other factors influencing the market include disease prevalence, diagnosis and treatment methods, and the impact of high screen time on dry eye symptoms.

Dry Eye Syndrome Drugs Market Size

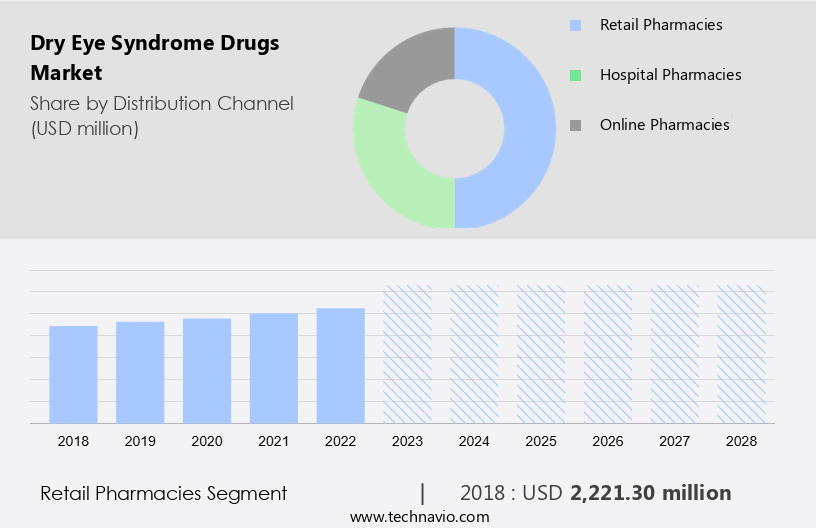
Get a glance at the market report of share of various segments Request Free Sample

The retail pharmacies segment was valued at USD 2.22 billion in 2018 and showed a gradual increase during the forecast period.

Regional Analysis

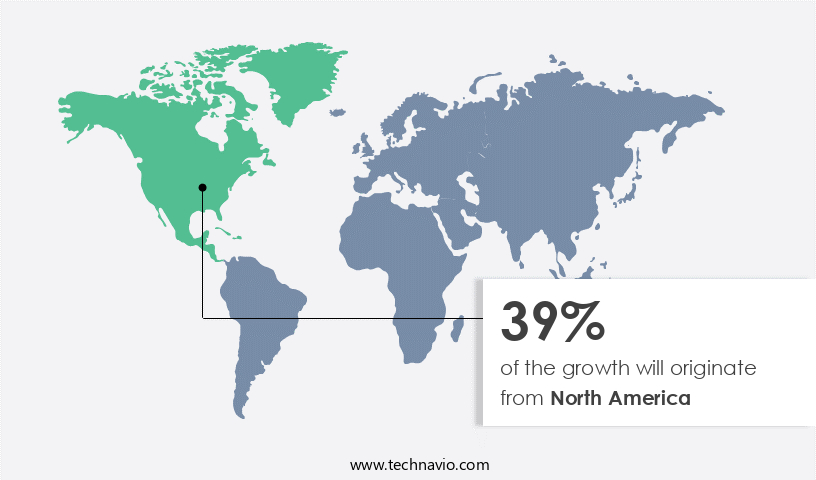
  • North America is estimated to contribute 39% to the growth of the global market during the forecast period.

Technavio's analysts have elaborately explained the regional trends and drivers that shape the market during the forecast period.

Dry Eye Syndrome Drugs Market Share by Geography

For more insights on the market share of various regions Request Free Sample

Dry Eye Syndrome, an ocular condition characterized by inflammation and chronic health conditions, affects a significant patient pool. Healing treatments for this debilitating ailment are of great importance, as patients often experience discomfort and impaired vision. Advanced emerging drugs, such as Cyclosporine and Selagine, are gaining attention due to their anti-inflammatory properties and ability to reverse the symptoms of Dry Eye Syndrome. Cyclosporine, an immunosuppressant, acts locally in the eye to reduce inflammation and increase tear production. Its systemic absorption is minimal, making it a safe option for patients. Selagine, an immunoglobulin drop, also targets inflammation and has shown promising Phase 3 data in clinical trials.

Meibomian gland dysfunction, a common cause of Dry Eye Syndrome, contributes to the patient burden. Anti-inflammatory drugs, like Cyclosporine and Selagine, are essential in managing the symptoms of this condition. Inflammation plays a crucial role in the occurrence and progression of Dry Eye Syndrome, making the development of effective treatments a priority. The pharmacokinetic characteristics of these drugs are crucial in determining their efficacy and safety. Rheumatic diseases, which often co-occur with Dry Eye Syndrome, can complicate treatment and increase the need for prescription disease drugs. Immunoglobulin drops, like Selagine, offer a potential solution for patients with complex health conditions.

Market Dynamics

Our researchers analyzed the data with 2023 as the base year, along with the key drivers, trends, and challenges. A holistic analysis of drivers will help companies refine their marketing strategies to gain a competitive advantage.

What are the key market drivers leading to the rise in adoption of Dry Eye Syndrome Drugs Market?

The growing geriatric population is the key driver of the market.

  • The market is experiencing substantial growth due to the increasing prevalence of this condition among the geriatric population. Dry eye disease is a common eye disorder characterized by insufficient tear production or excessive tear evaporation. This condition is more frequent among older adults, as age-related hormonal changes and various health issues increase the risk of developing dry eyes. Asia, with its rapidly expanding geriatric population and growing healthcare infrastructure, is emerging as a lucrative region for dry eye syndrome drugs. Eye care centers, clinics, and private practices in this part of the world are witnessing a rise in demand for clinical care and alternative therapies, such as nutritional supplements, acupuncture, and nanobiotechnology-based treatments.
  • Drug manufacturers are investing heavily in research and development to create innovative solutions for dry eye syndrome. Nanobiotechnology and microencapsulation are two cutting-edge technologies being explored to improve the efficacy and bioavailability of dry eye drugs. For instance, Alcon's CEQUA therapy, which utilizes nanodroplet technology, has gained significant attention in the market. However, the regulatory burden and pressure to secure drug approvals through clinical trials can be challenging for drug manufacturers. Diabetes, rheumatic conditions, hormonal imbalances, vitamin A deficiency, lupus, and thyroid disease are some of the underlying health conditions that can contribute to dry eye syndrome. As a result, the market for dry eye syndrome drugs is expected to grow, driven by the increasing demand for effective diagnosis and treatment options.

What are the market trends shaping the Dry Eye Syndrome Drugs Market?

Advancements in drug delivery technologies is the upcoming trend in the market.

  • Dry Eye Syndrome, or keratoconjunctivitis sicca, is a prevalent ocular condition characterized by insufficient tear production or excessive tear evaporation. This condition can cause discomfort, irritation, and potential damage to the ocular surface. Eye Care Centers opting for advanced clinical care have witnessed significant growth in the Dry Eye Disease market. Autoimmune disorders, hormonal changes, aging, and certain health conditions, including diabetes and rheumatic conditions, can trigger this syndrome. Ophthalmologists and optometrists in Eye Clinics and private practices diagnose and treat Dry Eye Syndrome using various therapies. Alternative treatments, such as nutritional supplements, acupuncture, and contact lenses, are also gaining popularity.
  • Drug manufacturers are investing in research and development to create more effective and convenient drug delivery systems. Nanobiotechnology and microencapsulation are emerging trends in Dry Eye Syndrome Drugs. Technologies like nanodroplet and CEQUA therapy have shown promise in improving bioavailability and patient compliance. Regulatory procedures and clinical trials are essential steps in drug approval. High screen time and vitamin A deficiency are among the factors contributing to the increasing prevalence of Dry Eye Syndrome. Diseases like lupus, thyroid disease, and diabetes can cause Dry Eye Syndrome due to changes in blood composition affecting tear glands. The geriatric population is particularly susceptible due to age-related hormonal changes.
  • The regulatory burden and investment cost associated with drug development and approval add pressure to the market. In summary, the market is witnessing significant advancements, driven by the need for more effective and convenient treatments. Eye Care Centers, Ophthalmologists, and Optometrists are adopting new technologies and therapies to diagnose and treat Dry Eye Disease. Drug manufacturers are investing in research and development, focusing on nanobiotechnology, microencapsulation, and other innovative drug delivery systems. The market is influenced by various factors, including demographics, disease prevalence, regulatory procedures, and technological advancements.

What challenges does Dry Eye Syndrome Drugs Market face during the growth?

Less visibility into reimbursement of ophthalmic disorder treatments is a key challenge affecting the market growth.

  • In the realm of Eye Care Centers and clinics, the market for Dry Eye Syndrome drugs is a significant concern due to limited visibility into the reimbursement process for treatments. This condition, often linked to autoimmune disorders, affects a substantial number of individuals, particularly those with Hormonal changes or part of the Geriatric population. In developed countries like the US, while insurance coverage is prevalent, out-of-pocket expenses for drugs remain a challenge. The situation worsens in emerging markets such as India and China, where a considerable portion of the population lacks health insurance coverage. Ophthalmologists, optometrists, and private practices provide clinical care for Dry Eye Disease, but the high investment cost and regulatory burden hinder the widespread use of advanced therapies like CEQUA therapy drug and nanobiotechnology-based treatments, such as those utilizing nanodroplet technology.
  • Alternative therapies, including nutritional supplements, acupuncture, and herbal remedies, offer potential solutions. However, the regulatory procedures for drug approval and clinical trials can put pressure on drug manufacturers, delaying the availability of new treatments. Dry Eye Syndrome is associated with various conditions, including Diabetes, Rheumatic conditions, Blood composition imbalances, and diseases like Lupus and Thyroid disease. The condition can also be caused by Vitamin A deficiency or prolonged use of contact lenses. High screen time is another contributing factor. Investment in healthcare infrastructure and research is crucial to address the challenges in the market. Technological advancements, such as microencapsulation, hold promise in improving drug delivery and efficacy.

Exclusive Customer Landscape

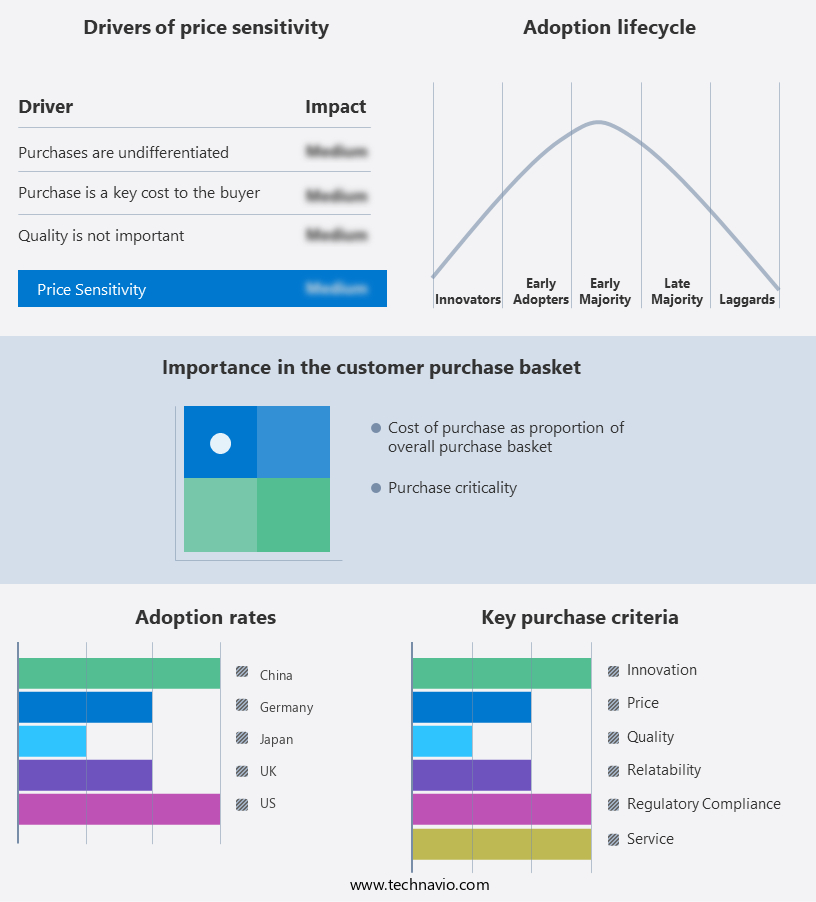
The market forecasting report includes the adoption lifecycle of the market, covering from the innovator's stage to the laggard's stage. It focuses on adoption rates in different regions based on penetration. Furthermore, the market report also includes key purchase criteria and drivers of price sensitivity to help companies evaluate and develop their market growth analysis strategies.

Dry Eye Syndrome Drugs Market Share by Geography

 Customer Landscape

Key Companies & Market Insights

Companies are implementing various strategies, such as strategic alliances, market forecast, partnerships, mergers and acquisitions, geographical expansion, and product/service launches, to enhance their presence in the market.

The market research and growth report includes detailed analyses of the competitive landscape of the market and information about key companies, including:

  • Abbott Laboratories
  • AbbVie Inc.
  • AFT Pharmaceuticals Ltd.
  • Akorn Operating Co LLC
  • Bausch Health Companies Inc.
  • F. Hoffmann La Roche Ltd.
  • GlaxoSmithKline Plc
  • I MED Pharma Inc.
  • Johnson and Johnson Services Inc.
  • Laboratoires Thea
  • Mitotech SA
  • Novaliq GmbH
  • Novartis AG
  • Oasis Medical Inc.
  • Otsuka Holdings Co. Ltd.
  • Santen Pharmaceutical Co. Ltd.
  • Sentiss Pharma Pvt. Ltd.
  • Sun Pharmaceutical Industries Ltd.
  • Viatris Inc.
  • Visufarma

Qualitative and quantitative analysis of companies has been conducted to help clients understand the wider business environment as well as the strengths and weaknesses of key market players. Data is qualitatively analyzed to categorize companies as pure play, category-focused, industry-focused, and diversified; it is quantitatively analyzed to categorize companies as dominant, leading, strong, tentative, and weak.

Research Analyst Overview

Dry Eye Syndrome (DES) is a common condition characterized by tears that do not provide adequate lubrication and protection to the eyes. The Centers for Disease Control and Prevention (CDC) reports that up to 10 million Americans suffer from dry eyes. The market is growing due to increasing prevalence and awareness of the condition. Eye drops are the primary treatment for DES, with various types available, including artificial tears, lubricants, and anti-inflammatory drugs. Further, the market for these drugs is driven by factors such as an aging population, increased screen time, and environmental factors. The clinical landscape for DES drugs is diverse, with several companies developing new treatments. The use of advanced technologies, such as ocular surface imaging and meibomian gland evaluation, is also increasing to improve diagnosis and treatment. The market for DES drugs is expected to continue growing due to these factors and the unmet need for effective treatments.

Market Scope

Report Coverage

Details

Page number

168

Base year

2023

Historic period

2018-2022

Forecast period

2024-2028

Growth momentum & CAGR

Accelerate at a CAGR of 6.16%

Market Growth 2024-2028

USD 2.14 billion

Market structure

Fragmented

YoY growth 2023-2024(%)

5.71

Key countries

US, UK, Japan, Germany, and China

Competitive landscape

Leading Companies, Market Positioning of Companies, Competitive Strategies, and Industry Risks

Request Free Sample

What are the Key Data Covered in this Market Research and Growth Report?

  • CAGR of the market during the forecast period
  • Detailed information on factors that will drive the market growth and forecasting between 2024 and 2028
  • Precise estimation of the size of the market  and its contribution of the market in focus to the parent market
  • Accurate predictions about upcoming market growth and trends and changes in consumer behaviour
  • Growth of the market across North America, Europe, Asia, and Rest of World (ROW)
  • Thorough analysis of the market's competitive landscape and detailed information about companies
  • Comprehensive analysis of factors that will challenge the growth of market companies

We can help! Our analysts can customize this market research report to meet your requirements. Get in touch

1 Executive Summary

  • 1.1 Market overview
    • Executive Summary - Chart on Market Overview
    • Executive Summary - Data Table on Market Overview
    • Executive Summary - Chart on Global Market Characteristics
    • Executive Summary - Chart on Market by Geography
    • Executive Summary - Chart on Market Segmentation by Distribution Channel
    • Executive Summary - Chart on Market Segmentation by Product
    • Executive Summary - Chart on Incremental Growth
    • Executive Summary - Data Table on Incremental Growth
    • Executive Summary - Chart on Company Market Positioning

2 Market Landscape

  • 2.1 Market ecosystem
    • Parent Market
    • Data Table on - Parent Market
  • 2.2 Market characteristics
    • Market characteristics analysis
  • 2.3 Value chain analysis
    • Value Chain Analysis

3 Market Sizing

  • 3.1 Market definition
    • Offerings of companies included in the market definition
  • 3.2 Market segment analysis
    • Market segments
  • 3.3 Market size 2023
    • 3.4 Market outlook: Forecast for 2023-2028
      • Chart on Global - Market size and forecast 2023-2028 ($ million)
      • Data Table on Global - Market size and forecast 2023-2028 ($ million)
      • Chart on Global Market: Year-over-year growth 2023-2028 (%)
      • Data Table on Global Market: Year-over-year growth 2023-2028 (%)

    4 Historic Market Size

    • 4.1 Global Dry Eye Syndrome Drugs Market 2018 - 2022
      • Historic Market Size - Data Table on Global Dry Eye Syndrome Drugs Market 2018 - 2022 ($ million)
    • 4.2 Distribution Channel segment analysis 2018 - 2022
      • Historic Market Size - Distribution Channel Segment 2018 - 2022 ($ million)
    • 4.3 Product segment analysis 2018 - 2022
      • Historic Market Size - Product Segment 2018 - 2022 ($ million)
    • 4.4 Geography segment analysis 2018 - 2022
      • Historic Market Size - Geography Segment 2018 - 2022 ($ million)
    • 4.5 Country segment analysis 2018 - 2022
      • Historic Market Size - Country Segment 2018 - 2022 ($ million)

    5 Five Forces Analysis

    • 5.1 Five forces summary
      • Five forces analysis - Comparison between 2023 and 2028
    • 5.2 Bargaining power of buyers
      • Bargaining power of buyers - Impact of key factors 2023 and 2028
    • 5.3 Bargaining power of suppliers
      • Bargaining power of suppliers - Impact of key factors in 2023 and 2028
    • 5.4 Threat of new entrants
      • Threat of new entrants - Impact of key factors in 2023 and 2028
    • 5.5 Threat of substitutes
      • Threat of substitutes - Impact of key factors in 2023 and 2028
    • 5.6 Threat of rivalry
      • Threat of rivalry - Impact of key factors in 2023 and 2028
    • 5.7 Market condition
      • Chart on Market condition - Five forces 2023 and 2028

    6 Market Segmentation by Distribution Channel

    • 6.1 Market segments
      • Chart on Distribution Channel - Market share 2023-2028 (%)
      • Data Table on Distribution Channel - Market share 2023-2028 (%)
    • 6.2 Comparison by Distribution Channel
      • Chart on Comparison by Distribution Channel
      • Data Table on Comparison by Distribution Channel
    • 6.3 Retail pharmacies - Market size and forecast 2023-2028
      • Chart on Retail pharmacies - Market size and forecast 2023-2028 ($ million)
      • Data Table on Retail pharmacies - Market size and forecast 2023-2028 ($ million)
      • Chart on Retail pharmacies - Year-over-year growth 2023-2028 (%)
      • Data Table on Retail pharmacies - Year-over-year growth 2023-2028 (%)
    • 6.4 Hospital pharmacies - Market size and forecast 2023-2028
      • Chart on Hospital pharmacies - Market size and forecast 2023-2028 ($ million)
      • Data Table on Hospital pharmacies - Market size and forecast 2023-2028 ($ million)
      • Chart on Hospital pharmacies - Year-over-year growth 2023-2028 (%)
      • Data Table on Hospital pharmacies - Year-over-year growth 2023-2028 (%)
    • 6.5 Online pharmacies - Market size and forecast 2023-2028
      • Chart on Online pharmacies - Market size and forecast 2023-2028 ($ million)
      • Data Table on Online pharmacies - Market size and forecast 2023-2028 ($ million)
      • Chart on Online pharmacies - Year-over-year growth 2023-2028 (%)
      • Data Table on Online pharmacies - Year-over-year growth 2023-2028 (%)
    • 6.6 Market opportunity by Distribution Channel
      • Market opportunity by Distribution Channel ($ million)
      • Data Table on Market opportunity by Distribution Channel ($ million)

    7 Market Segmentation by Product

    • 7.1 Market segments
      • Chart on Product - Market share 2023-2028 (%)
      • Data Table on Product - Market share 2023-2028 (%)
    • 7.2 Comparison by Product
      • Chart on Comparison by Product
      • Data Table on Comparison by Product
    • 7.3 OTC drugs - Market size and forecast 2023-2028
      • Chart on OTC drugs - Market size and forecast 2023-2028 ($ million)
      • Data Table on OTC drugs - Market size and forecast 2023-2028 ($ million)
      • Chart on OTC drugs - Year-over-year growth 2023-2028 (%)
      • Data Table on OTC drugs - Year-over-year growth 2023-2028 (%)
    • 7.4 Prescription drugs - Market size and forecast 2023-2028
      • Chart on Prescription drugs - Market size and forecast 2023-2028 ($ million)
      • Data Table on Prescription drugs - Market size and forecast 2023-2028 ($ million)
      • Chart on Prescription drugs - Year-over-year growth 2023-2028 (%)
      • Data Table on Prescription drugs - Year-over-year growth 2023-2028 (%)
    • 7.5 Market opportunity by Product
      • Market opportunity by Product ($ million)
      • Data Table on Market opportunity by Product ($ million)

    8 Customer Landscape

    • 8.1 Customer landscape overview
      • Analysis of price sensitivity, lifecycle, customer purchase basket, adoption rates, and purchase criteria

    9 Geographic Landscape

    • 9.1 Geographic segmentation
      • Chart on Market share by geography 2023-2028 (%)
      • Data Table on Market share by geography 2023-2028 (%)
    • 9.2 Geographic comparison
      • Chart on Geographic comparison
      • Data Table on Geographic comparison
    • 9.3 North America - Market size and forecast 2023-2028
      • Chart on North America - Market size and forecast 2023-2028 ($ million)
      • Data Table on North America - Market size and forecast 2023-2028 ($ million)
      • Chart on North America - Year-over-year growth 2023-2028 (%)
      • Data Table on North America - Year-over-year growth 2023-2028 (%)
    • 9.4 Europe - Market size and forecast 2023-2028
      • Chart on Europe - Market size and forecast 2023-2028 ($ million)
      • Data Table on Europe - Market size and forecast 2023-2028 ($ million)
      • Chart on Europe - Year-over-year growth 2023-2028 (%)
      • Data Table on Europe - Year-over-year growth 2023-2028 (%)
    • 9.5 Asia - Market size and forecast 2023-2028
      • Chart on Asia - Market size and forecast 2023-2028 ($ million)
      • Data Table on Asia - Market size and forecast 2023-2028 ($ million)
      • Chart on Asia - Year-over-year growth 2023-2028 (%)
      • Data Table on Asia - Year-over-year growth 2023-2028 (%)
    • 9.6 Rest of World (ROW) - Market size and forecast 2023-2028
      • Chart on Rest of World (ROW) - Market size and forecast 2023-2028 ($ million)
      • Data Table on Rest of World (ROW) - Market size and forecast 2023-2028 ($ million)
      • Chart on Rest of World (ROW) - Year-over-year growth 2023-2028 (%)
      • Data Table on Rest of World (ROW) - Year-over-year growth 2023-2028 (%)
    • 9.7 US - Market size and forecast 2023-2028
      • Chart on US - Market size and forecast 2023-2028 ($ million)
      • Data Table on US - Market size and forecast 2023-2028 ($ million)
      • Chart on US - Year-over-year growth 2023-2028 (%)
      • Data Table on US - Year-over-year growth 2023-2028 (%)
    • 9.8 UK - Market size and forecast 2023-2028
      • Chart on UK - Market size and forecast 2023-2028 ($ million)
      • Data Table on UK - Market size and forecast 2023-2028 ($ million)
      • Chart on UK - Year-over-year growth 2023-2028 (%)
      • Data Table on UK - Year-over-year growth 2023-2028 (%)
    • 9.9 Japan - Market size and forecast 2023-2028
      • Chart on Japan - Market size and forecast 2023-2028 ($ million)
      • Data Table on Japan - Market size and forecast 2023-2028 ($ million)
      • Chart on Japan - Year-over-year growth 2023-2028 (%)
      • Data Table on Japan - Year-over-year growth 2023-2028 (%)
    • 9.10 Germany - Market size and forecast 2023-2028
      • Chart on Germany - Market size and forecast 2023-2028 ($ million)
      • Data Table on Germany - Market size and forecast 2023-2028 ($ million)
      • Chart on Germany - Year-over-year growth 2023-2028 (%)
      • Data Table on Germany - Year-over-year growth 2023-2028 (%)
    • 9.11 China - Market size and forecast 2023-2028
      • Chart on China - Market size and forecast 2023-2028 ($ million)
      • Data Table on China - Market size and forecast 2023-2028 ($ million)
      • Chart on China - Year-over-year growth 2023-2028 (%)
      • Data Table on China - Year-over-year growth 2023-2028 (%)
    • 9.12 Market opportunity by geography
      • Market opportunity by geography ($ million)
      • Data Tables on Market opportunity by geography ($ million)

    10 Drivers, Challenges, and Opportunity/Restraints

    • 10.1 Market drivers
      • 10.2 Market challenges
        • 10.3 Impact of drivers and challenges
          • Impact of drivers and challenges in 2023 and 2028
        • 10.4 Market opportunities/restraints

          11 Competitive Landscape

          • 11.1 Overview
            • 11.2 Competitive Landscape
              • Overview on criticality of inputs and factors of differentiation
            • 11.3 Landscape disruption
              • Overview on factors of disruption
            • 11.4 Industry risks
              • Impact of key risks on business

            12 Competitive Analysis

            • 12.1 Companies profiled
              • Companies covered
            • 12.2 Market positioning of companies
              • Matrix on companies position and classification
            • 12.3 Abbott Laboratories
              • Abbott Laboratories - Overview
              • Abbott Laboratories - Business segments
              • Abbott Laboratories - Key news
              • Abbott Laboratories - Key offerings
              • Abbott Laboratories - Segment focus
            • 12.4 AbbVie Inc.
              • AbbVie Inc. - Overview
              • AbbVie Inc. - Product / Service
              • AbbVie Inc. - Key news
              • AbbVie Inc. - Key offerings
            • 12.5 AFT Pharmaceuticals Ltd.
              • AFT Pharmaceuticals Ltd. - Overview
              • AFT Pharmaceuticals Ltd. - Business segments
              • AFT Pharmaceuticals Ltd. - Key offerings
              • AFT Pharmaceuticals Ltd. - Segment focus
            • 12.6 Bausch Health Companies Inc.
              • Bausch Health Companies Inc. - Overview
              • Bausch Health Companies Inc. - Business segments
              • Bausch Health Companies Inc. - Key news
              • Bausch Health Companies Inc. - Key offerings
              • Bausch Health Companies Inc. - Segment focus
            • 12.7 I MED Pharma Inc.
              • I MED Pharma Inc. - Overview
              • I MED Pharma Inc. - Product / Service
              • I MED Pharma Inc. - Key offerings
            • 12.8 Johnson and Johnson Services Inc.
              • Johnson and Johnson Services Inc. - Overview
              • Johnson and Johnson Services Inc. - Business segments
              • Johnson and Johnson Services Inc. - Key news
              • Johnson and Johnson Services Inc. - Key offerings
              • Johnson and Johnson Services Inc. - Segment focus
            • 12.9 Laboratoires Thea
              • Laboratoires Thea - Overview
              • Laboratoires Thea - Product / Service
              • Laboratoires Thea - Key offerings
            • 12.10 Mitotech SA
              • Mitotech SA - Overview
              • Mitotech SA - Product / Service
              • Mitotech SA - Key offerings
            • 12.11 Novaliq GmbH
              • Novaliq GmbH - Overview
              • Novaliq GmbH - Product / Service
              • Novaliq GmbH - Key offerings
            • 12.12 Novartis AG
              • Novartis AG - Overview
              • Novartis AG - Business segments
              • Novartis AG - Key news
              • Novartis AG - Key offerings
              • Novartis AG - Segment focus
            • 12.13 Oasis Medical Inc.
              • Oasis Medical Inc. - Overview
              • Oasis Medical Inc. - Product / Service
              • Oasis Medical Inc. - Key offerings
            • 12.14 Otsuka Holdings Co. Ltd.
              • Otsuka Holdings Co. Ltd. - Overview
              • Otsuka Holdings Co. Ltd. - Business segments
              • Otsuka Holdings Co. Ltd. - Key offerings
              • Otsuka Holdings Co. Ltd. - Segment focus
            • 12.15 Santen Pharmaceutical Co. Ltd.
              • Santen Pharmaceutical Co. Ltd. - Overview
              • Santen Pharmaceutical Co. Ltd. - Product / Service
              • Santen Pharmaceutical Co. Ltd. - Key offerings
            • 12.16 Sun Pharmaceutical Industries Ltd.
              • Sun Pharmaceutical Industries Ltd. - Overview
              • Sun Pharmaceutical Industries Ltd. - Product / Service
              • Sun Pharmaceutical Industries Ltd. - Key news
              • Sun Pharmaceutical Industries Ltd. - Key offerings
            • 12.17 Viatris Inc.
              • Viatris Inc. - Overview
              • Viatris Inc. - Business segments
              • Viatris Inc. - Key news
              • Viatris Inc. - Key offerings
              • Viatris Inc. - Segment focus

            13 Appendix

            • 13.1 Scope of the report
              • 13.2 Inclusions and exclusions checklist
                • Inclusions checklist
                • Exclusions checklist
              • 13.3 Currency conversion rates for US$
                • Currency conversion rates for US$
              • 13.4 Research methodology
                • Research methodology
              • 13.5 Data procurement
                • Information sources
              • 13.6 Data validation
                • Data validation
              • 13.7 Validation techniques employed for market sizing
                • Validation techniques employed for market sizing
              • 13.8 Data synthesis
                • Data synthesis
              • 13.9 360 degree market analysis
                • 360 degree market analysis
              • 13.10 List of abbreviations
                • List of abbreviations

              Research Methodology

              Technavio presents a detailed picture of the market by way of study, synthesis, and summation of data from multiple sources. The analysts have presented the various facets of the market with a particular focus on identifying the key industry influencers. The data thus presented is comprehensive, reliable, and the result of extensive research, both primary and secondary.

              INFORMATION SOURCES

              Primary sources

              • Manufacturers and suppliers
              • Channel partners
              • Industry experts
              • Strategic decision makers

              Secondary sources

              • Industry journals and periodicals
              • Government data
              • Financial reports of key industry players
              • Historical data
              • Press releases

              DATA ANALYSIS

              Data Synthesis

              • Collation of data
              • Estimation of key figures
              • Analysis of derived insights

              Data Validation

              • Triangulation with data models
              • Reference against proprietary databases
              • Corroboration with industry experts

              REPORT WRITING

              Qualitative

              • Market drivers
              • Market challenges
              • Market trends
              • Five forces analysis

              Quantitative

              • Market size and forecast
              • Market segmentation
              • Geographical insights
              • Competitive landscape

              Interested in this report?

              Get your sample now to see our research methodology and insights!

              Download Now

              Frequently Asked Questions

              Dry Eye Syndrome Drugs market growth will increase by $ 2136.2 mn during 2024-2028 .

              The Dry Eye Syndrome Drugs market is expected to grow at a CAGR of 6.16% during 2024-2028 .

              Dry Eye Syndrome Drugs market is segmented by Distribution Channel( Retail pharmacies, Hospital pharmacies, Online pharmacies) Product( OTC drugs, Prescription drugs, Asia, ROW)

              Abbott Laboratories, AbbVie Inc., AFT Pharmaceuticals Ltd., Akorn Operating Co LLC, Bausch Health Companies Inc., F. Hoffmann La Roche Ltd., GlaxoSmithKline Plc, I MED Pharma Inc., Johnson and Johnson Services Inc., Laboratoires Thea, Mitotech SA, Novaliq GmbH, Novartis AG, Oasis Medical Inc., Otsuka Holdings Co. Ltd., Santen Pharmaceutical Co. Ltd., Sentiss Pharma Pvt. Ltd., Sun Pharmaceutical Industries Ltd., Viatris Inc., Visufarma are a few of the key vendors in the Dry Eye Syndrome Drugs market.

              North America will register the highest growth rate of 39% among the other regions. Therefore, the Dry Eye Syndrome Drugs market in North America is expected to garner significant business opportunities for the vendors during the forecast period.

              US, UK, Japan, Germany, China

              • Growing geriatric populationThe growing geriatric population is indeed a significant driver for the global dry eye syndrome drugs market. Dry eye syndrome is a common condition that occurs when the eyes do not produce enough tears or when the tears evaporate too quickly. It is more prevalent among older individuals is the driving factor this market.
              • and the risk of developing the condition increases with age. Many health problems arise from age. Eye disorders and diabetes are two. Owing to its rapidly growing geriatric population is the driving factor this market.
              • Asia is becoming one of the most lucrative regions for age-related disorders. However is the driving factor this market.
              • North America and Europe hold the major shares in the market owing to high investment in the healthcare sector. Some of the major age-related eye disorders are age-related macular degeneration (AMD) is the driving factor this market.
              • cataracts is the driving factor this market.
              • diabetic eye disease is the driving factor this market.
              • glaucoma is the driving factor this market.
              • dry eye syndrome is the driving factor this market.
              • and low vision. The prevalence of vision impairment and blindness rises rapidly with age. Dry eye syndrome has a direct relation with age as tear production declines with increasing age. The National Institutes of Health (NIH) states that the disease has been found to be more prevalent in people aged 50 years and above. Decreased tear production as a result of altered reflex secretion is the driving factor this market.
              • lacrimal gland dysfunction is the driving factor this market.
              • inflammatory destruction of lacrimal glands is the driving factor this market.
              • or diminished corneal sensation may lead to tear deficiency is the driving factor this market.
              • causing dry eye syndrome. Older adults also have a high risk of developing autoimmune disorders is the driving factor this market.
              • such as rheumatoid arthritis and Sjogren's syndrome is the driving factor this market.
              • which are other major causes of dry eyes. Other factors is the driving factor this market.
              • such as the use of topical medications in the eye due to disorders such as glaucoma is the driving factor this market.
              • also increase the risk of dry eyes. These factors contribute to the high prevalence rate of dry eyes in the elderly. Hence is the driving factor this market.
              • the rising population will lead to a higher demand for dry eye syndrome drugs is the driving factor this market.
              • thereby driving market growth during the forecast period. is the driving factor this market.

              The Dry Eye Syndrome Drugs market vendors should focus on grabbing business opportunities from the Retail pharmacies segment as it accounted for the largest market share in the base year.