Duct Air Quality Sensors Market Analysis North America, Europe, APAC, Middle East and Africa, South America - US, China, Germany, UK, Japan - Size and Forecast 2024-2028

Duct Air Quality Sensors Market Analysis North America, Europe, APAC, Middle East and Africa, South America - US, China, Germany, UK, Japan - Size and Forecast 2024-2028

Published: Jul 2024 173 Pages SKU: IRTNTR76301

Market Overview at a Glance

$104.7 Mn
Market Opportunity
6.78%
CAGR
6.23
YoY growth 2023-2024(%)

Duct Air Quality Sensors Market Size 2024-2028

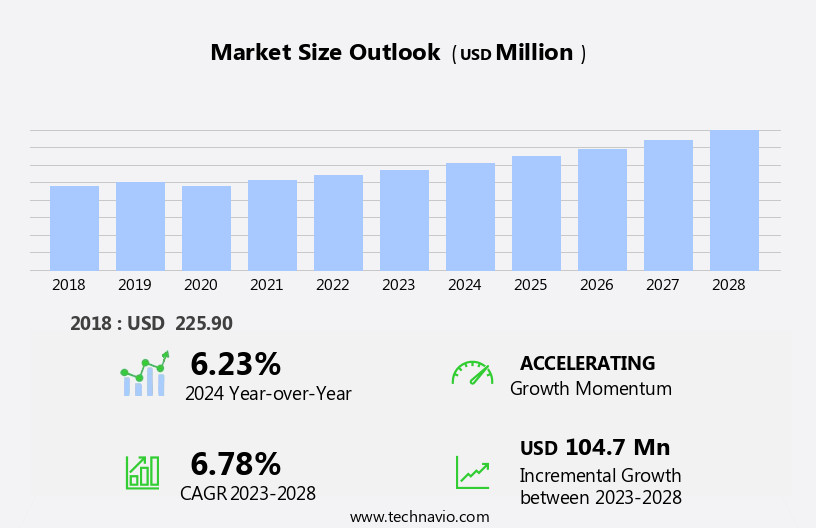
The duct air quality sensors market size is forecast to increase by USD 104.7 million at a CAGR of 6.78% between 2023 and 2028.

  • The market is experiencing significant growth due to the increasing awareness of indoor air quality and the rising adoption of smart building solutions. The demand for duct air quality sensors is increasing as more organizations prioritize maintaining optimal indoor air quality to ensure the health and productivity of their workforces. Furthermore, the integration of duct air quality sensors into smart building systems is becoming increasingly common, enabling real-time monitoring and automated responses to maintain ideal conditions. However, the complexity of air quality assessment poses a challenge for market participants. Accurately assessing and maintaining duct air quality can be a complex process, requiring specialized knowledge and advanced technology.
  • Additionally, ensuring compliance with various regulations and standards can add to the complexity and cost of implementing duct air quality sensors. Companies seeking to capitalize on market opportunities in the market must invest in research and development to address these challenges and offer innovative solutions to simplify air quality assessment and ensure regulatory compliance.

What will be the Size of the Duct Air Quality Sensors Market during the forecast period?

Duct Air Quality Sensors Market Size

 Request Free Sample

  • The market continues to evolve, driven by the growing demand for maintaining optimal indoor air quality (IAQ) in various sectors. These sensors play a crucial role in ensuring the health and comfort of occupants, particularly in data centers, healthcare facilities, and commercial buildings. Cloud-based platforms enable real-time data analysis and predictive maintenance, ensuring compliance with regulations and enhancing energy efficiency. Sensor accuracy and response time are critical factors, with advancements in machine learning and AI enabling more precise measurements. Cost-effective solutions, such as wireless connectivity and sensor integration, are gaining popularity. Air filtration and airflow measurement sensors ensure efficient HVAC systems, while CO2 monitoring and humidity sensors maintain optimal conditions for occupant health.
  • ASHRAE standards guide the industry, and the market responds with innovations in purification efficiency and sensor calibration. Volatile organic compounds (VOCs) and particle detection sensors address emerging concerns, while mobile apps and remote monitoring enable easy access to data visualization and maintenance. The market's continuous dynamism reflects the ongoing importance of ensuring IAQ and maintaining optimal building performance.

How is this Duct Air Quality Sensors Industry segmented?

The duct air quality sensors industry research report provides comprehensive data (region-wise segment analysis), with forecasts and estimates in "USD million" for the period 2024-2028, as well as historical data from 2018-2022 for the following segments.

  • End-user
    • Non-residential
    • Residential
  • Type
    • Multi-gas monitor
    • Single-gas monitor
  • Geography
    • North America
      • US
    • Europe
      • Germany
      • UK
    • APAC
      • China
      • Japan
    • Rest of World (ROW)

By End-user Insights

The non-residential segment is estimated to witness significant growth during the forecast period.

In the non-residential sector, duct air quality sensors play a crucial role in ensuring indoor air quality and maintaining regulatory compliance across various commercial, industrial, institutional, and public spaces. These sensors are integrated into ventilation systems of offices, shopping centers, malls, data centers, healthcare facilities, and industrial buildings to monitor pollutants, including volatile organic compounds, Carbon Dioxide, and particulate matter. By providing real-time data on temperature, humidity, and airflow, duct air quality sensors contribute to creating a healthy, comfortable, and energy-efficient environment. Additionally, predictive maintenance and sensor integration enable proactive system optimization and reduced maintenance costs. Compliance with regulations, such as ASHRAE standards and LEED certification, is also facilitated through continuous monitoring and data analytics.

Furthermore, cloud-based platforms and mobile apps enable remote monitoring and data visualization, enhancing building automation and operational efficiency. Duct air quality sensors come in various sizes, with different levels of accuracy, response time, and sensor lifespan, catering to diverse applications and budgets.

Duct Air Quality Sensors Market Size

Request Free Sample

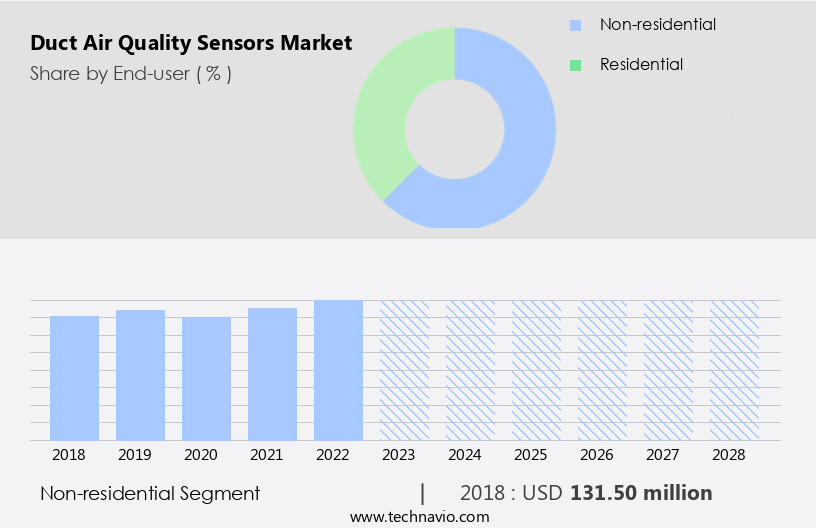
The Non-residential segment was valued at USD 131.50 million in 2018 and showed a gradual increase during the forecast period.

Regional Analysis

North America is estimated to contribute 37% to the growth of the global market during the forecast period. Technavio's analysts have elaborately explained the regional trends and drivers that shape the market during the forecast period.

Duct Air Quality Sensors Market Share by Geography

 Request Free Sample

In the North American market, the US and Canada lead the duct air quality sensors industry due to their advanced economies, high urbanization, and emphasis on indoor air quality. Strict regulations and guidelines from government bodies underline the significance of monitoring air quality to protect public health. Smart Buildings and temperature monitoring systems are increasingly adopted to ensure energy efficiency and occupant health. Data analytics plays a crucial role in predictive maintenance and identifying potential issues in HVAC systems, reducing maintenance costs. Compliance with Ashrae standards and LEED certification is a key driver for the adoption of duct air quality sensors in commercial buildings.

The integration of machine learning and sensor networks enables real-time data analysis and remote monitoring, enhancing building automation. Air filtration and purification efficiency, CO2 monitoring, and humidity monitoring are essential for maintaining optimal indoor air quality in healthcare facilities and industrial settings. Duct air quality sensors offer cost-effective solutions for residential buildings and data centers, with wireless connectivity and long sensor lifespan. The market trends include the development of cloud-based platforms, mobile apps, and advanced sensors for particle detection, pressure sensors, and airflow measurement. The focus on air quality index, filtration efficiency, and ventilation systems ensures a healthy and productive environment.

Market Dynamics

Our researchers analyzed the data with 2023 as the base year, along with the key drivers, trends, and challenges. A holistic analysis of drivers will help companies refine their marketing strategies to gain a competitive advantage.

What are the key market drivers leading to the rise in the adoption of Duct Air Quality Sensors Industry?

  • The increasing concern for indoor air quality serves as the primary catalyst for market growth. 
  • The market is witnessing significant growth due to increasing awareness of indoor air quality and its impact on health. With people spending a considerable amount of time indoors, concerns about the health effects of poor indoor air quality are rising. Factors such as inadequate ventilation, building materials, and indoor activities can contribute to indoor air pollution, which is often more prevalent than outdoor air pollution. Duct air quality sensors play a crucial role in monitoring and maintaining optimal indoor air quality. These sensors use various technologies such as filtration efficiency, wireless connectivity, and sensor calibration to detect and measure pollutants like particles, gases, and pressure changes.
  • Data visualization tools enable users to monitor air quality indexes in real-time, allowing for timely interventions to improve indoor air quality. Sensor networks and ventilation systems are essential components of commercial buildings, particularly those aiming for LEED certification. These systems help ensure that indoor air quality meets stringent standards, creating healthier and more productive work environments. Flow sensors and pressure sensors are critical components of these systems, providing essential data for maintaining optimal airflow and pressure levels. Sensor lifespan and sensor calibration are essential considerations for ensuring the accuracy and reliability of duct air quality sensors.
  • Regular calibration ensures that sensors continue to provide accurate readings, while long sensor lifespans reduce maintenance costs and downtime. In conclusion, the demand for duct air quality sensors is driven by growing awareness of indoor air quality and its impact on health. These sensors provide essential data for maintaining optimal indoor air quality, enabling organizations to create healthier and more productive work environments while meeting stringent regulatory requirements.

What are the market trends shaping the Duct Air Quality Sensors Industry?

  • The trend in the market is toward greater adoption of smart building solutions. This growing preference reflects the increasing recognition of the benefits these technologies bring to efficiency, sustainability, and overall management of commercial and residential structures.
  • Duct air quality sensors play a crucial role in smart building solutions, ensuring optimal indoor air quality for occupant health and compliance with regulations. These sensors detect and measure pollutants, temperature, humidity, and ventilation rates in real-time, integrating with building management systems and IoT platforms for data analysis. The advantages of smart building solutions include immediate action based on collected data, enhancing occupant comfort, improving energy efficiency, and ensuring regulatory compliance.
  • Data analytics enable predictive maintenance, reducing maintenance costs, and optimizing purification efficiency. Remote monitoring and building automation further streamline operations, making duct air quality sensors an essential component of modern, intelligent building infrastructure.

What challenges does the Duct Air Quality Sensors Industry face during its growth?

  • The complex assessment of air quality poses a significant challenge to the industry's growth, requiring extensive expertise and resources. 
  • Indoor air quality is a critical concern for various sectors, particularly in data centers and healthcare facilities, where maintaining optimal conditions is essential. The complex interplay of factors influencing indoor air quality, such as pollutants, temperature, humidity, and ventilation rates, necessitates advanced sensor technologies for accurate and comprehensive measurements. Different pollutants, including CO2 and airborne particles, have unique sources, chemical compositions, and behaviors, requiring sensors with high selectivity and sensitivity. Real-time data is crucial for effective air quality management. Cloud-based platforms enable remote monitoring and real-time data analysis, reducing installation costs and facilitating seamless integration with air filtration and airflow measurement systems.
  • However, ensuring sensor accuracy and quick response times is vital to maintain indoor air quality standards, such as those set by ASHRAE. The duct environment poses unique challenges, as airflow can affect pollutant distribution, leading to variations in sensor readings. Advanced sensor technologies and robust calibration processes are necessary to address these challenges and ensure accurate measurements at different points along the duct. In conclusion, designing and implementing effective indoor air quality monitoring systems requires a deep understanding of the complex factors at play and the use of advanced sensor technologies to ensure accurate, real-time data for optimal indoor air quality management.

Exclusive Customer Landscape

The duct air quality sensors market forecasting report includes the adoption lifecycle of the market, covering from the innovator's stage to the laggard's stage. It focuses on adoption rates in different regions based on penetration. Furthermore, the duct air quality sensors market report also includes key purchase criteria and drivers of price sensitivity to help companies evaluate and develop their market growth analysis strategies.

Duct Air Quality Sensors Market Share by Geography

 Customer Landscape

Key Companies & Market Insights

Companies are implementing various strategies, such as strategic alliances, duct air quality sensors market forecast, partnerships, mergers and acquisitions, geographical expansion, and product/service launches, to enhance their presence in the industry.

Airflow Developments Ltd. - Alphasense Limited, a subsidiary of the company, provides advanced duct air quality sensors.

The industry research and growth report includes detailed analyses of the competitive landscape of the market and information about key companies, including:

  • Airflow Developments Ltd.
  • AMETEK Inc.
  • Amphenol Corp.
  • Andivi d.o.o.
  • BELIMO Holding AG
  • Building Automation Products Inc.
  • CAREL INDUSTRIES S.p.A.
  • EC Products Ltd.
  • Fr. Sauter AG
  • FuehlerSysteme eNET International GmbH
  • Gas Sensing Solutions Ltd.
  • Greystone Energy Systems Inc.
  • Honeywell International Inc.
  • Johnson Controls International Plc.
  • S and S Regeltechnik GmbH
  • Schneider Electric SE
  • Siemens AG
  • Sontay Ltd.
  • Testo SE and Co. KGaA
  • Thermokon Sensortechnik GmbH
  • Tongdy Sensing Technology Corp.
  • Vaisala Oyj
  • WIKA Alexander Wiegand SE and Co. KG

Qualitative and quantitative analysis of companies has been conducted to help clients understand the wider business environment as well as the strengths and weaknesses of key industry players. Data is qualitatively analyzed to categorize companies as pure play, category-focused, industry-focused, and diversified; it is quantitatively analyzed to categorize companies as dominant, leading, strong, tentative, and weak.

Recent Development and News in Duct Air Quality Sensors Market

  • In February 2023, Honeywell International Inc. Announced the launch of their new line of duct air quality sensors, the Honeywell Home Wave Duo. This innovative product can detect and monitor particulate matter, temperature, and humidity levels in real-time, aiming to improve indoor air quality and health (Honeywell International Inc. Press release, 2023).
  • In March 2024, Sensirion AG and Siemens AG entered into a strategic partnership to develop and integrate Sensirion's duct air quality sensors into Siemens' building automation systems. This collaboration is expected to enhance energy efficiency and indoor air quality solutions for commercial buildings (Sensirion AG press release, 2024).
  • In May 2024, BlueSens GmbH, a leading provider of gas sensors, raised €10 million in a funding round to expand its production capacity and invest in research and development for duct air quality sensors. This investment will help the company meet the growing demand for advanced air quality monitoring systems (BlueSens GmbH press release, 2024).
  • In October 2025, the European Union passed the new Indoor Air Quality Directive, which mandates the installation of duct air quality sensors in all new and existing buildings. This regulation aims to improve indoor air quality and reduce health risks associated with poor air quality (European Parliament and Council of the European Union, 2025).

Research Analyst Overview

In the market, operational efficiency and health and safety are top priorities for businesses. Alarm systems that detect gas leaks and notify building occupants are essential for ensuring safety. Air quality improvement is a significant trend, with sensors measuring particle size distribution, airborne particle counting, and bioaerosol monitoring playing key roles. Building health and environmental monitoring are crucial for maintaining air quality standards and complying with regulations. Smart Home and green building standards demand advanced air quality management systems, including remote sensor management, data analysis software, and reporting and dashboards.

Energy conservation and risk management are also important considerations, with sensor calibration services and maintenance ensuring accurate readings. Airborne pathogens, mold detection, and allergen detection are increasingly important for maintaining occupant comfort. Gas sensing and bioaerosol monitoring are integral to Smart City initiatives and air quality solutions.

Dive into Technavio's robust research methodology, blending expert interviews, extensive data synthesis, and validated models for unparalleled Duct Air Quality Sensors Market insights. See full methodology.

Market Scope

Report Coverage

Details

Page number

173

Base year

2023

Historic period

2018-2022

Forecast period

2024-2028

Growth momentum & CAGR

Accelerate at a CAGR of 6.78%

Market growth 2024-2028

USD 104.7 million

Market structure

Fragmented

YoY growth 2023-2024(%)

6.23

Key countries

US, China, Germany, UK, and Japan

Competitive landscape

Leading Companies, Market Positioning of Companies, Competitive Strategies, and Industry Risks

Request Free Sample

What are the Key Data Covered in this Duct Air Quality Sensors Market Research and Growth Report?

  • CAGR of the Duct Air Quality Sensors industry during the forecast period
  • Detailed information on factors that will drive the growth and forecasting between 2024 and 2028
  • Precise estimation of the size of the market and its contribution of the industry in focus to the parent market
  • Accurate predictions about upcoming growth and trends and changes in consumer behaviour
  • Growth of the market across North America, Europe, APAC, Middle East and Africa, and South America
  • Thorough analysis of the market's competitive landscape and detailed information about companies
  • Comprehensive analysis of factors that will challenge the duct air quality sensors market growth of industry companies

We can help! Our analysts can customize this duct air quality sensors market research report to meet your requirements.

Get in touch

1 Executive Summary

  • 1.1 Market overview
    • Executive Summary - Chart on Market Overview
    • Executive Summary - Data Table on Market Overview
    • Executive Summary - Chart on Global Market Characteristics
    • Executive Summary - Chart on Market by Geography
    • Executive Summary - Chart on Market Segmentation by End-user
    • Executive Summary - Chart on Market Segmentation by Type
    • Executive Summary - Chart on Incremental Growth
    • Executive Summary - Data Table on Incremental Growth
    • Executive Summary - Chart on Company Market Positioning

2 Market Landscape

  • 2.1 Market ecosystem
    • Parent Market
    • Data Table on - Parent Market
  • 2.2 Market characteristics
    • Market characteristics analysis
  • 2.3 Value chain analysis
    • Value Chain Analysis

3 Market Sizing

  • 3.1 Market definition
    • Offerings of companies included in the market definition
  • 3.2 Market segment analysis
    • Market segments
  • 3.3 Market size 2023
    • 3.4 Market outlook: Forecast for 2023-2028
      • Chart on Global - Market size and forecast 2023-2028 ($ million)
      • Data Table on Global - Market size and forecast 2023-2028 ($ million)
      • Chart on Global Market: Year-over-year growth 2023-2028 (%)
      • Data Table on Global Market: Year-over-year growth 2023-2028 (%)

    4 Historic Market Size

    • 4.1 Global Duct Air Quality Sensors Market 2018 - 2022
      • Historic Market Size - Data Table on Global Duct Air Quality Sensors Market 2018 - 2022 ($ million)
    • 4.2 End-user segment analysis 2018 - 2022
      • Historic Market Size - End-user Segment 2018 - 2022 ($ million)
    • 4.3 Type segment analysis 2018 - 2022
      • Historic Market Size - Type Segment 2018 - 2022 ($ million)
    • 4.4 Geography segment analysis 2018 - 2022
      • Historic Market Size - Geography Segment 2018 - 2022 ($ million)
    • 4.5 Country segment analysis 2018 - 2022
      • Historic Market Size - Country Segment 2018 - 2022 ($ million)

    5 Five Forces Analysis

    • 5.1 Five forces summary
      • Five forces analysis - Comparison between 2023 and 2028
    • 5.2 Bargaining power of buyers
      • Bargaining power of buyers - Impact of key factors 2023 and 2028
    • 5.3 Bargaining power of suppliers
      • Bargaining power of suppliers - Impact of key factors in 2023 and 2028
    • 5.4 Threat of new entrants
      • Threat of new entrants - Impact of key factors in 2023 and 2028
    • 5.5 Threat of substitutes
      • Threat of substitutes - Impact of key factors in 2023 and 2028
    • 5.6 Threat of rivalry
      • Threat of rivalry - Impact of key factors in 2023 and 2028
    • 5.7 Market condition
      • Chart on Market condition - Five forces 2023 and 2028

    6 Market Segmentation by End-user

    • 6.1 Market segments
      • Chart on End-user - Market share 2023-2028 (%)
      • Data Table on End-user - Market share 2023-2028 (%)
    • 6.2 Comparison by End-user
      • Chart on Comparison by End-user
      • Data Table on Comparison by End-user
    • 6.3 Non-residential - Market size and forecast 2023-2028
      • Chart on Non-residential - Market size and forecast 2023-2028 ($ million)
      • Data Table on Non-residential - Market size and forecast 2023-2028 ($ million)
      • Chart on Non-residential - Year-over-year growth 2023-2028 (%)
      • Data Table on Non-residential - Year-over-year growth 2023-2028 (%)
    • 6.4 Residential - Market size and forecast 2023-2028
      • Chart on Residential - Market size and forecast 2023-2028 ($ million)
      • Data Table on Residential - Market size and forecast 2023-2028 ($ million)
      • Chart on Residential - Year-over-year growth 2023-2028 (%)
      • Data Table on Residential - Year-over-year growth 2023-2028 (%)
    • 6.5 Market opportunity by End-user
      • Market opportunity by End-user ($ million)
      • Data Table on Market opportunity by End-user ($ million)

    7 Market Segmentation by Type

    • 7.1 Market segments
      • Chart on Type - Market share 2023-2028 (%)
      • Data Table on Type - Market share 2023-2028 (%)
    • 7.2 Comparison by Type
      • Chart on Comparison by Type
      • Data Table on Comparison by Type
    • 7.3 Multi-gas monitor - Market size and forecast 2023-2028
      • Chart on Multi-gas monitor - Market size and forecast 2023-2028 ($ million)
      • Data Table on Multi-gas monitor - Market size and forecast 2023-2028 ($ million)
      • Chart on Multi-gas monitor - Year-over-year growth 2023-2028 (%)
      • Data Table on Multi-gas monitor - Year-over-year growth 2023-2028 (%)
    • 7.4 Single-gas monitor - Market size and forecast 2023-2028
      • Chart on Single-gas monitor - Market size and forecast 2023-2028 ($ million)
      • Data Table on Single-gas monitor - Market size and forecast 2023-2028 ($ million)
      • Chart on Single-gas monitor - Year-over-year growth 2023-2028 (%)
      • Data Table on Single-gas monitor - Year-over-year growth 2023-2028 (%)
    • 7.5 Market opportunity by Type
      • Market opportunity by Type ($ million)
      • Data Table on Market opportunity by Type ($ million)

    8 Customer Landscape

    • 8.1 Customer landscape overview
      • Analysis of price sensitivity, lifecycle, customer purchase basket, adoption rates, and purchase criteria

    9 Geographic Landscape

    • 9.1 Geographic segmentation
      • Chart on Market share by geography 2023-2028 (%)
      • Data Table on Market share by geography 2023-2028 (%)
    • 9.2 Geographic comparison
      • Chart on Geographic comparison
      • Data Table on Geographic comparison
    • 9.3 North America - Market size and forecast 2023-2028
      • Chart on North America - Market size and forecast 2023-2028 ($ million)
      • Data Table on North America - Market size and forecast 2023-2028 ($ million)
      • Chart on North America - Year-over-year growth 2023-2028 (%)
      • Data Table on North America - Year-over-year growth 2023-2028 (%)
    • 9.4 Europe - Market size and forecast 2023-2028
      • Chart on Europe - Market size and forecast 2023-2028 ($ million)
      • Data Table on Europe - Market size and forecast 2023-2028 ($ million)
      • Chart on Europe - Year-over-year growth 2023-2028 (%)
      • Data Table on Europe - Year-over-year growth 2023-2028 (%)
    • 9.5 APAC - Market size and forecast 2023-2028
      • Chart on APAC - Market size and forecast 2023-2028 ($ million)
      • Data Table on APAC - Market size and forecast 2023-2028 ($ million)
      • Chart on APAC - Year-over-year growth 2023-2028 (%)
      • Data Table on APAC - Year-over-year growth 2023-2028 (%)
    • 9.6 Middle East and Africa - Market size and forecast 2023-2028
      • Chart on Middle East and Africa - Market size and forecast 2023-2028 ($ million)
      • Data Table on Middle East and Africa - Market size and forecast 2023-2028 ($ million)
      • Chart on Middle East and Africa - Year-over-year growth 2023-2028 (%)
      • Data Table on Middle East and Africa - Year-over-year growth 2023-2028 (%)
    • 9.7 South America - Market size and forecast 2023-2028
      • Chart on South America - Market size and forecast 2023-2028 ($ million)
      • Data Table on South America - Market size and forecast 2023-2028 ($ million)
      • Chart on South America - Year-over-year growth 2023-2028 (%)
      • Data Table on South America - Year-over-year growth 2023-2028 (%)
    • 9.8 US - Market size and forecast 2023-2028
      • Chart on US - Market size and forecast 2023-2028 ($ million)
      • Data Table on US - Market size and forecast 2023-2028 ($ million)
      • Chart on US - Year-over-year growth 2023-2028 (%)
      • Data Table on US - Year-over-year growth 2023-2028 (%)
    • 9.9 China - Market size and forecast 2023-2028
      • Chart on China - Market size and forecast 2023-2028 ($ million)
      • Data Table on China - Market size and forecast 2023-2028 ($ million)
      • Chart on China - Year-over-year growth 2023-2028 (%)
      • Data Table on China - Year-over-year growth 2023-2028 (%)
    • 9.10 Germany - Market size and forecast 2023-2028
      • Chart on Germany - Market size and forecast 2023-2028 ($ million)
      • Data Table on Germany - Market size and forecast 2023-2028 ($ million)
      • Chart on Germany - Year-over-year growth 2023-2028 (%)
      • Data Table on Germany - Year-over-year growth 2023-2028 (%)
    • 9.11 UK - Market size and forecast 2023-2028
      • Chart on UK - Market size and forecast 2023-2028 ($ million)
      • Data Table on UK - Market size and forecast 2023-2028 ($ million)
      • Chart on UK - Year-over-year growth 2023-2028 (%)
      • Data Table on UK - Year-over-year growth 2023-2028 (%)
    • 9.12 Japan - Market size and forecast 2023-2028
      • Chart on Japan - Market size and forecast 2023-2028 ($ million)
      • Data Table on Japan - Market size and forecast 2023-2028 ($ million)
      • Chart on Japan - Year-over-year growth 2023-2028 (%)
      • Data Table on Japan - Year-over-year growth 2023-2028 (%)
    • 9.13 Market opportunity by geography
      • Market opportunity by geography ($ million)
      • Data Tables on Market opportunity by geography ($ million)

    10 Drivers, Challenges, and Opportunity/Restraints

    • 10.1 Market drivers
      • 10.2 Market challenges
        • 10.3 Impact of drivers and challenges
          • Impact of drivers and challenges in 2023 and 2028
        • 10.4 Market opportunities/restraints

          11 Competitive Landscape

          • 11.1 Overview
            • 11.2 Competitive Landscape
              • Overview on criticality of inputs and factors of differentiation
            • 11.3 Landscape disruption
              • Overview on factors of disruption
            • 11.4 Industry risks
              • Impact of key risks on business

            12 Competitive Analysis

            • 12.1 Companies profiled
              • Companies covered
            • 12.2 Market positioning of companies
              • Matrix on companies position and classification
            • 12.3 AMETEK Inc.
              • AMETEK Inc. - Overview
              • AMETEK Inc. - Business segments
              • AMETEK Inc. - Key news
              • AMETEK Inc. - Key offerings
              • AMETEK Inc. - Segment focus
            • 12.4 Amphenol Corp.
              • Amphenol Corp. - Overview
              • Amphenol Corp. - Business segments
              • Amphenol Corp. - Key news
              • Amphenol Corp. - Key offerings
              • Amphenol Corp. - Segment focus
            • 12.5 Fr. Sauter AG
              • Fr. Sauter AG - Overview
              • Fr. Sauter AG - Product / Service
              • Fr. Sauter AG - Key news
              • Fr. Sauter AG - Key offerings
            • 12.6 FuehlerSysteme eNET International GmbH
              • FuehlerSysteme eNET International GmbH - Overview
              • FuehlerSysteme eNET International GmbH - Product / Service
              • FuehlerSysteme eNET International GmbH - Key offerings
            • 12.7 Greystone Energy Systems Inc.
              • Greystone Energy Systems Inc. - Overview
              • Greystone Energy Systems Inc. - Product / Service
              • Greystone Energy Systems Inc. - Key offerings
            • 12.8 Honeywell International Inc.
              • Honeywell International Inc. - Overview
              • Honeywell International Inc. - Business segments
              • Honeywell International Inc. - Key news
              • Honeywell International Inc. - Key offerings
              • Honeywell International Inc. - Segment focus
            • 12.9 Johnson Controls International Plc.
              • Johnson Controls International Plc. - Overview
              • Johnson Controls International Plc. - Business segments
              • Johnson Controls International Plc. - Key news
              • Johnson Controls International Plc. - Key offerings
              • Johnson Controls International Plc. - Segment focus
            • 12.10 S and S Regeltechnik GmbH
              • S and S Regeltechnik GmbH - Overview
              • S and S Regeltechnik GmbH - Product / Service
              • S and S Regeltechnik GmbH - Key offerings
            • 12.11 Schneider Electric SE
              • Schneider Electric SE - Overview
              • Schneider Electric SE - Business segments
              • Schneider Electric SE - Key news
              • Schneider Electric SE - Key offerings
              • Schneider Electric SE - Segment focus
            • 12.12 Siemens AG
              • Siemens AG - Overview
              • Siemens AG - Business segments
              • Siemens AG - Key news
              • Siemens AG - Key offerings
              • Siemens AG - Segment focus
            • 12.13 Sontay Ltd.
              • Sontay Ltd. - Overview
              • Sontay Ltd. - Product / Service
              • Sontay Ltd. - Key offerings
            • 12.14 Testo SE and Co. KGaA
              • Testo SE and Co. KGaA - Overview
              • Testo SE and Co. KGaA - Product / Service
              • Testo SE and Co. KGaA - Key offerings
            • 12.15 Thermokon Sensortechnik GmbH
              • Thermokon Sensortechnik GmbH - Overview
              • Thermokon Sensortechnik GmbH - Product / Service
              • Thermokon Sensortechnik GmbH - Key offerings
            • 12.16 Vaisala Oyj
              • Vaisala Oyj - Overview
              • Vaisala Oyj - Business segments
              • Vaisala Oyj - Key news
              • Vaisala Oyj - Key offerings
              • Vaisala Oyj - Segment focus
            • 12.17 WIKA Alexander Wiegand SE and Co. KG
              • WIKA Alexander Wiegand SE and Co. KG - Overview
              • WIKA Alexander Wiegand SE and Co. KG - Product / Service
              • WIKA Alexander Wiegand SE and Co. KG - Key offerings

            13 Appendix

            • 13.1 Scope of the report
              • 13.2 Inclusions and exclusions checklist
                • Inclusions checklist
                • Exclusions checklist
              • 13.3 Currency conversion rates for US$
                • Currency conversion rates for US$
              • 13.4 Research methodology
                • Research methodology
              • 13.5 Data procurement
                • Information sources
              • 13.6 Data validation
                • Data validation
              • 13.7 Validation techniques employed for market sizing
                • Validation techniques employed for market sizing
              • 13.8 Data synthesis
                • Data synthesis
              • 360 degree market analysis
                • 360 degree market analysis
              • 13.10 List of abbreviations
                • List of abbreviations

              Research Methodology

              Technavio presents a detailed picture of the market by way of study, synthesis, and summation of data from multiple sources. The analysts have presented the various facets of the market with a particular focus on identifying the key industry influencers. The data thus presented is comprehensive, reliable, and the result of extensive research, both primary and secondary.

              INFORMATION SOURCES

              Primary sources

              • Manufacturers and suppliers
              • Channel partners
              • Industry experts
              • Strategic decision makers

              Secondary sources

              • Industry journals and periodicals
              • Government data
              • Financial reports of key industry players
              • Historical data
              • Press releases

              DATA ANALYSIS

              Data Synthesis

              • Collation of data
              • Estimation of key figures
              • Analysis of derived insights

              Data Validation

              • Triangulation with data models
              • Reference against proprietary databases
              • Corroboration with industry experts

              REPORT WRITING

              Qualitative

              • Market drivers
              • Market challenges
              • Market trends
              • Five forces analysis

              Quantitative

              • Market size and forecast
              • Market segmentation
              • Geographical insights
              • Competitive landscape

              Interested in this report?

              Get your sample now to see our research methodology and insights!

              Download Now

              Frequently Asked Questions

              Duct Air Quality Sensors market growth will increase by $ 104.7 mn during 2024-2028 .

              The Duct Air Quality Sensors market is expected to grow at a CAGR of 6.78% during 2024-2028 .

              Duct Air Quality Sensors market is segmented by End-user( Non-residential, Residential) Type( Multi-gas monitor, Single-gas monitor)

              Airflow Developments Ltd., AMETEK Inc., Amphenol Corp., Andivi d.o.o., BELIMO Holding AG, Building Automation Products Inc., CAREL INDUSTRIES S.p.A., EC Products Ltd., Fr. Sauter AG, FuehlerSysteme eNET International GmbH, Gas Sensing Solutions Ltd., Greystone Energy Systems Inc., Honeywell International Inc., Johnson Controls International Plc., S and S Regeltechnik GmbH, Schneider Electric SE, Siemens AG, Sontay Ltd., Testo SE and Co. KGaA, Thermokon Sensortechnik GmbH, Tongdy Sensing Technology Corp., Vaisala Oyj, WIKA Alexander Wiegand SE and Co. KG are a few of the key vendors in the Duct Air Quality Sensors market.

              North America will register the highest growth rate of 37% among the other regions. Therefore, the Duct Air Quality Sensors market in North America is expected to garner significant business opportunities for the vendors during the forecast period.

              US, China, Germany, UK, Japan

              • Growing awareness of indoor air qualityGrowing awareness of indoor air quality is a significant driver propelling the demand for duct air quality sensors in various industries. With individuals spending a substantial portion of their lives indoors is the driving factor this market.
              • concerns about the health implications of poor air quality have surged. This heightened awareness stems from increased information dissemination is the driving factor this market.
              • scientific research is the driving factor this market.
              • and health-related incidents linked to indoor pollutants. As the public becomes more informed about the adverse effects of indoor pollutants is the driving factor this market.
              • there is a growing recognition that indoor air can be more polluted than outdoor air due to factors such as inadequate ventilation is the driving factor this market.
              • building materials is the driving factor this market.
              • and indoor activities. People are increasingly connecting indoor air quality to a range of health issues is the driving factor this market.
              • from allergies and respiratory problems to more severe conditions. This awareness extends across residential is the driving factor this market.
              • commercial is the driving factor this market.
              • and industrial sectors is the driving factor this market.
              • driving the demand for effective IAQ solutions. Duct air quality sensors play a crucial role by offering continuous monitoring of key parameters is the driving factor this market.
              • such as particulate matter is the driving factor this market.
              • VOCs is the driving factor this market.
              • temperature is the driving factor this market.
              • and humidity. Thus is the driving factor this market.
              • the growing awareness of indoor air quality is expected to drive the growth of the global duct air quality sensors market during the forecast period. is the driving factor this market.

              The Duct Air Quality Sensors market vendors should focus on grabbing business opportunities from the Non-residential segment as it accounted for the largest market share in the base year.