E-commerce Logistics Market Analysis, Size, and Forecast 2026-2030: APAC (China, Japan, and India), North America (US, Canada, and Mexico), Europe (Germany, UK, and France), South America (Brazil and Argentina), Middle East and Africa (Saudi Arabia, UAE, and South Africa), and Rest of World (ROW)

E-commerce Logistics Market Analysis, Size, and Forecast 2026-2030:
APAC (China, Japan, and India), North America (US, Canada, and Mexico), Europe (Germany, UK, and France), South America (Brazil and Argentina), Middle East and Africa (Saudi Arabia, UAE, and South Africa), and Rest of World (ROW)

Published: Dec 2025 293 Pages SKU: IRTNTR44371

Market Overview at a Glance

$1870.3 B
Market Opportunity
36.9%
CAGR 2025 - 2030
57.3%
APAC Growth
$277.7 B
Domestic segment 2024

E-commerce Logistics Market Size 2026-2030

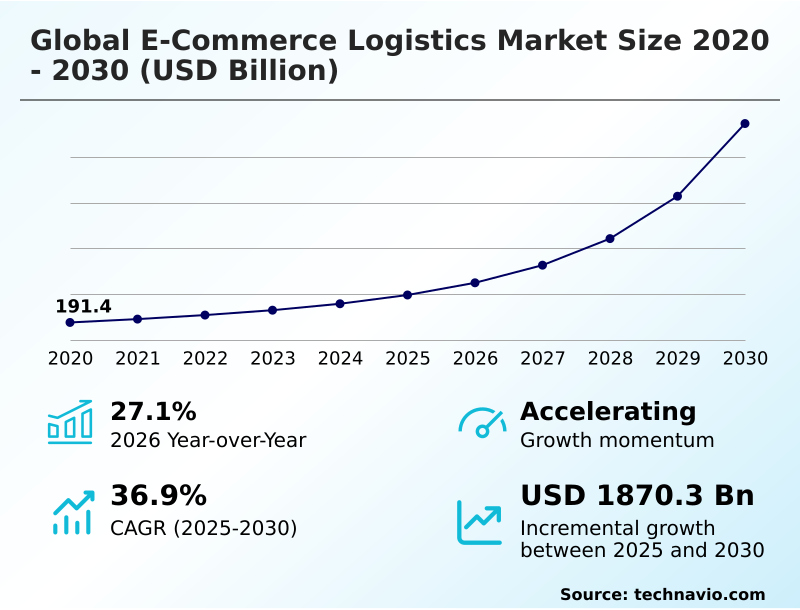
The e-commerce logistics market size is valued to increase by USD 1870.3 billion, at a CAGR of 36.9% from 2025 to 2030. Retail expansion supporting North America logistics growth will drive the e-commerce logistics market.

Major Market Trends & Insights

  • APAC dominated the market and accounted for a 57.3% growth during the forecast period.
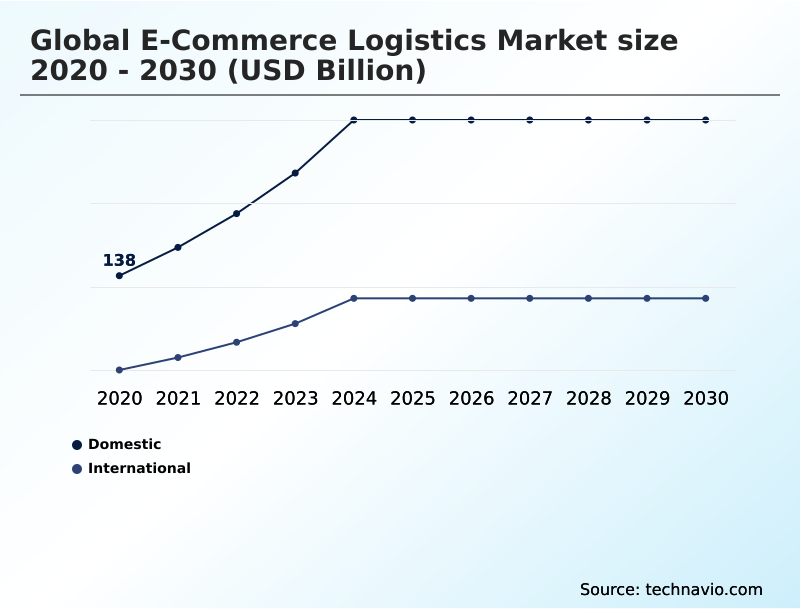
  • By Usage - Domestic segment was valued at USD 277.7 billion in 2024
  • By Service - Transportation segment accounted for the largest market revenue share in 2024

Market Size & Forecast

  • Market Opportunities: USD 2169.9 billion
  • Market Future Opportunities: USD 1870.3 billion
  • CAGR from 2025 to 2030 : 36.9%

Market Summary

  • The E-commerce Logistics market is undergoing a structural transformation, moving beyond basic transportation to become a strategic enabler of digital commerce. This evolution is driven by the need for greater operational resilience and heightened consumer expectations for speed and transparency. Core market activity now centers on deploying advanced technologies to optimize every stage of the supply chain.
  • For instance, a business scenario involves leveraging predictive analytics to pre-position high-demand inventory in urban micro-fulfillment centers, which reduces last-mile transit times and supports same-day delivery promises. This data-driven approach enhances efficiency and directly improves the customer experience.
  • However, this progress is met with challenges, including managing the complexity of cross-border customs, the high capital cost of automation, and the environmental pressure to adopt sustainable practices. The integration of AI and robotics is becoming a key trend, enabling companies to manage fluctuating parcel volumes and labor shortages effectively.
  • Success in the E-commerce Logistics market increasingly depends on a provider's ability to build a flexible, intelligent, and scalable network that can adapt to rapid shifts in consumer behavior and global trade dynamics.

What will be the Size of the E-commerce Logistics Market during the forecast period?

Get Key Insights on Market Forecast (PDF) Request Free Sample

How is the E-commerce Logistics Market Segmented?

The e-commerce logistics industry research report provides comprehensive data (region-wise segment analysis), with forecasts and estimates in "USD billion" for the period 2026-2030, as well as historical data from 2020-2024 for the following segments.

  • Usage
    • Domestic
    • International
  • Service
    • Transportation
    • Warehousing
    • Others
  • Type
    • Forward logistics
    • Backward logistics
  • Geography
    • APAC
      • China
      • Japan
      • India
    • North America
      • US
      • Canada
      • Mexico
    • Europe
      • Germany
      • UK
      • France
    • South America
      • Brazil
      • Argentina
    • Middle East and Africa
      • Saudi Arabia
      • UAE
      • South Africa
    • Rest of World (ROW)

By Usage Insights

The domestic segment is estimated to witness significant growth during the forecast period.

The domestic segment of the e-commerce logistics market is defined by its operational intensity, with a focus on speed and efficiency within national boundaries.

Growth is driven by a shift toward decentralized networks, where inventory is positioned closer to consumers to enable rapid fulfillment. A modern warehouse management system (WMS) is foundational, enabling advanced inventory optimization algorithms and dynamic order sequencing to improve throughput.

Returns processing centers are becoming highly automated, leveraging returns consolidation hubs to handle reverse logistics cost-effectively. Adopting sustainable packaging solutions and last-mile delivery optimization are also key priorities.

Effective order orchestration systems, which provide real-time shipment tracking, are crucial for managing this complexity, with leading operators using an e-fulfillment platform to reduce processing variability by over 20%.

Request Free Sample

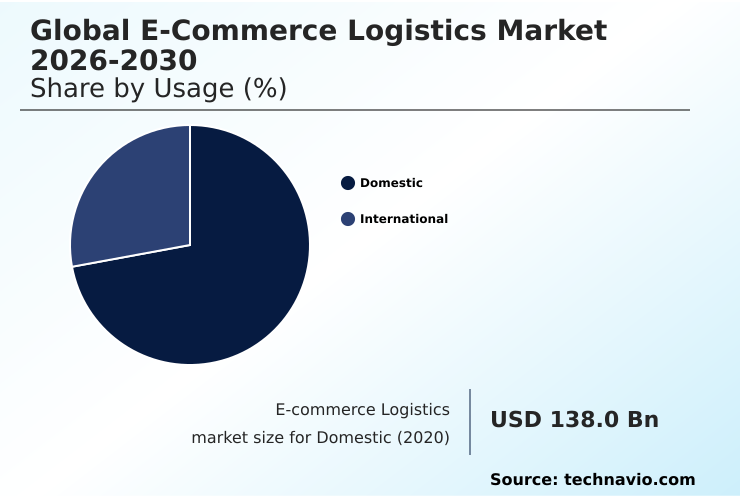
The Domestic segment was valued at USD 277.7 billion in 2024 and showed a gradual increase during the forecast period.

Request Free Sample

Regional Analysis

APAC is estimated to contribute 57.3% to the growth of the global market during the forecast period.Technavio’s analysts have elaborately explained the regional trends and drivers that shape the market during the forecast period.

See How E-commerce Logistics Market Demand is Rising in APAC Request Free Sample

The geographic landscape is defined by varied stages of maturity, with APAC driving growth and contributing over 57% of the incremental opportunity.

In North America and Europe, the focus is on optimizing existing networks using smart warehouse technology and hyperlocal delivery models supported by parcel locker networks.

An integrated logistics provider (ILP) in these regions leverages route orchestration platforms to manage urban density, achieving efficiency gains.

In contrast, emerging regions are focused on building foundational infrastructure, including cold chain e-commerce logistics and automated storage and retrieval system (ASRS) capabilities.

The rise of dark store fulfillment and on-demand warehousing is helping bridge infrastructure gaps, while digital freight matching platforms improve transport efficiency.

E-commerce supply chain resilience remains a universal priority, with operators deploying contactless delivery solutions to enhance safety and customer trust across all markets.

Market Dynamics

Our researchers analyzed the data with 2025 as the base year, along with the key drivers, trends, and challenges. A holistic analysis of drivers will help companies refine their marketing strategies to gain a competitive advantage.

  • Successfully navigating the global e-commerce logistics market 2026-2030 requires a deep understanding of complex operational levers. Mastering the role of dark stores in e-commerce logistics and the benefits of multi-carrier shipping strategies are no longer optional but critical for resilience.
  • Businesses are now focused on reducing last-mile delivery costs with AI and implementing omnichannel fulfillment for retail to create a seamless customer journey. A key strategic discussion involves data analytics for predictive e-commerce logistics, which informs decisions on warehouse automation ROI for online sellers and managing peak season demand in fulfillment centers.
  • The challenges of cross-border e-commerce logistics are being addressed by improving supply chain visibility for e-commerce and ensuring cross-border trade compliance for SMBs. Furthermore, the impact of electric vehicles on last-mile delivery and the adoption of sustainable packaging innovations in e-commerce are shaping corporate sustainability goals.
  • Companies that excel in optimizing reverse logistics for customer retention often see a performance lift nearly double that of competitors. Other crucial areas include scaling fulfillment operations for dropshipping, understanding technology for cold chain e-commerce fulfillment, and integrating WMS with order management systems.
  • Logistics strategies for direct-to-consumer brands, performing a cost-to-serve analysis for e-commerce profitability, and building a resilient e-commerce supply chain through hyperlocal delivery models for urban markets are foundational for long-term success.

What are the key market drivers leading to the rise in the adoption of E-commerce Logistics Industry?

  • The expansion of digital retail ecosystems, particularly in North America, is a significant driver for the growth of e-commerce logistics services.

  • Key market drivers include rapid digital adoption and continuous technology innovation. The growth of mobile commerce, particularly in APAC, is a primary catalyst, with some platforms noting that nearly 80% of new users originate from non-metro areas.
  • This trend necessitates an effective omnichannel fulfillment strategy, supported by micro-fulfillment centers and cross-docking facilities to shorten delivery times.
  • Logistics network optimization is being achieved through the deployment of autonomous mobile robots and advanced predictive demand forecasting, with early adopters reporting a 15% improvement in forecast accuracy.
  • The integration of artificial intelligence in logistics is enabling smarter warehouse robotics integration and better last-mile delivery analytics.
  • For international shipments, digital customs platforms are streamlining cross-border trade compliance, while robust peak season logistics planning ensures service stability during high-demand periods.

What are the market trends shaping the E-commerce Logistics Industry?

  • The adoption of automation and artificial intelligence is a key trend, fundamentally transforming e-commerce logistics operations. This shift is redefining efficiency and scalability across the supply chain.

  • Market trends are centered on operational transformation through automation and digital integration. The deployment of automated sortation systems in urban distribution centers is accelerating to manage rising parcel volumes, with some facilities reporting a 25% increase in throughput.
  • Cross-border fulfillment is being localized to improve the customer delivery experience, as seen with marketplace platforms reporting over fifteen-fold growth in cross-border GMV by using regional hubs. The adoption of agentic AI in logistics and robotic picking systems is moving from pilot to scaled implementation.
  • A key part of fulfillment network design now includes sustainable urban logistics, with the rollout of electric delivery vehicles (EVs) expanding. This is complemented by predictive route optimization and real-time inventory management, which are crucial for maintaining service levels. Furthermore, automated returns processing is becoming standard, improving efficiency in a high-return environment.

What challenges does the E-commerce Logistics Industry face during its growth?

  • Escalating last-mile delivery costs present a primary challenge, constraining profitability for operators in the e-commerce logistics market.

  • Persistent challenges constrain profitability and operational scalability. Escalating last-mile costs are a primary concern, with nearly 75% of retailers now using multi-carrier shipping software and carrier rate shopping to mitigate expenses. This has led to intense competition, with two out of five retailers shifting volumes to alternative providers. A thorough logistics cost-to-serve analysis is critical.
  • Infrastructure gaps, particularly in emerging markets, lead to delivery exception management issues and necessitate complex order orchestration systems. Another significant hurdle is regulatory complexity, where maintaining a high-quality supply chain visibility platform is essential for compliance. This environment also affects dropshipping fulfillment services and freight consolidation services, which rely on predictable transit.
  • To combat these issues, firms are using robotic process automation (RPA) in logistics and improving both reverse logistics management and returns management automation to recover value.

Exclusive Technavio Analysis on Customer Landscape

The e-commerce logistics market forecasting report includes the adoption lifecycle of the market, covering from the innovator’s stage to the laggard’s stage. It focuses on adoption rates in different regions based on penetration. Furthermore, the e-commerce logistics market report also includes key purchase criteria and drivers of price sensitivity to help companies evaluate and develop their market growth analysis strategies.

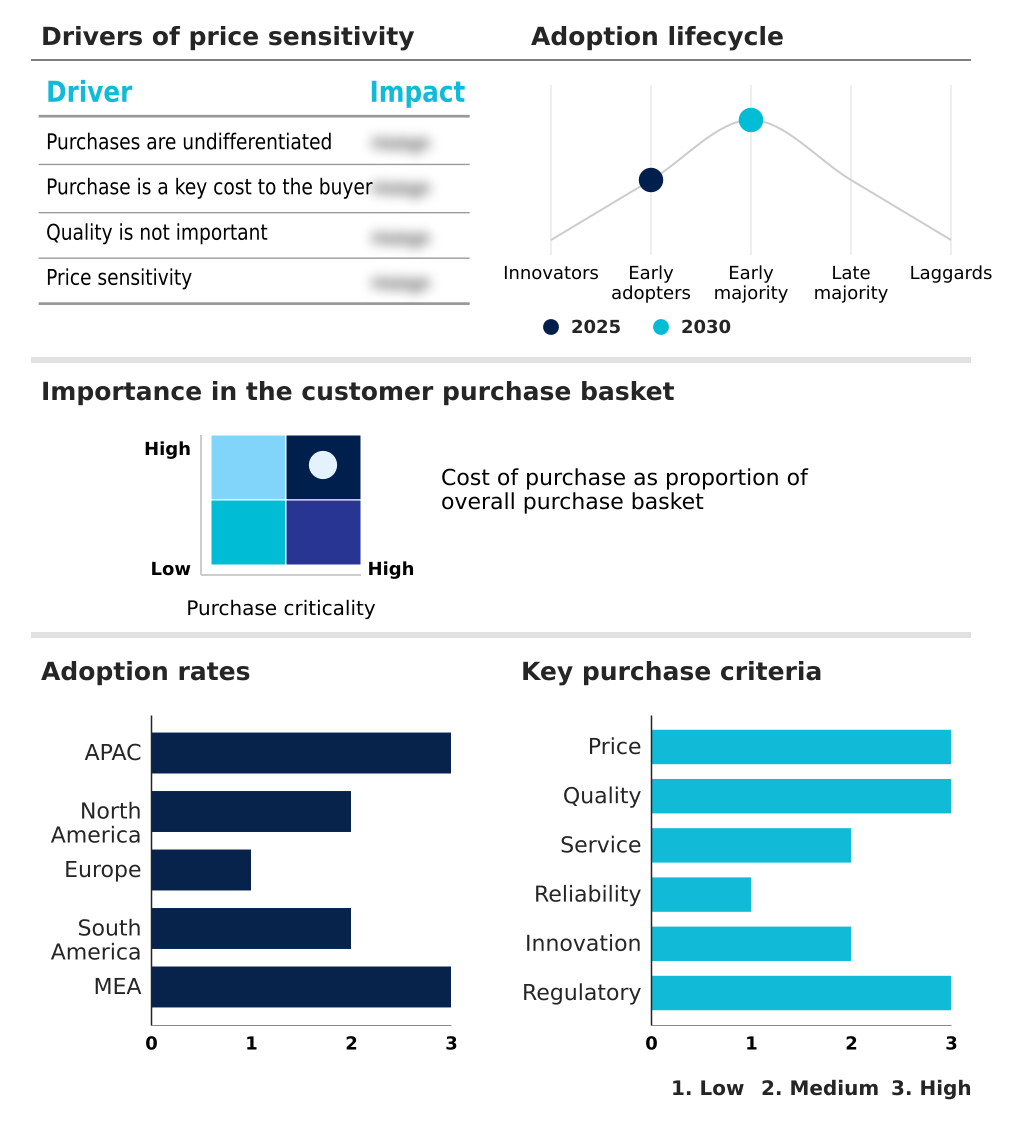
Customer Landscape of E-commerce Logistics Industry

Competitive Landscape

Companies are implementing various strategies, such as strategic alliances, e-commerce logistics market forecast, partnerships, mergers and acquisitions, geographical expansion, and product/service launches, to enhance their presence in the industry.

Agility Public Warehousing Co. - Provides comprehensive logistics services including freight forwarding, transportation, and contract logistics solutions to a global client base.

The industry research and growth report includes detailed analyses of the competitive landscape of the market and information about key companies, including:

  • Agility Public Warehousing Co.
  • Allcargo Gati Ltd.
  • Aramex International LLC
  • C H Robinson Worldwide Inc.
  • CMA CGM Group
  • Deutsche Post AG
  • DSV AS
  • eStore Logistics
  • FedEx Corp.
  • GXO Logistics Inc.
  • Kenco Group Inc.
  • Kuehne Nagel Management AG
  • Nippon Express Holdings Inc.
  • Rhenus SE and Co. KG
  • Schenker AG
  • SF Express Co. Ltd.
  • Sinotrans Ltd.
  • United Parcel Service Inc.
  • XPO Inc.

Qualitative and quantitative analysis of companies has been conducted to help clients understand the wider business environment as well as the strengths and weaknesses of key industry players. Data is qualitatively analyzed to categorize companies as pure play, category-focused, industry-focused, and diversified; it is quantitatively analyzed to categorize companies as dominant, leading, strong, tentative, and weak.

Recent Development and News in E-commerce logistics market

  • In October 2024, Amazon expanded its robotics, artificial intelligence, and fulfillment automation initiatives, supported by collaborative research with MIT to scale automation for improved delivery speed and safety.
  • In October 2024, Leasys expanded its digital leasing marketplace across multiple European markets to promote low-emission vehicle access, supporting fleet electrification for sustainable logistics.
  • In April 2025, Amazon committed approximately $4 billion to expand its rural delivery infrastructure in the United States, aiming to extend faster delivery coverage through over 200 new delivery stations.
  • In May 2025, JD Logistics accelerated its warehouse and air cargo expansion across Asia, Europe, North America, and Australasia to reinforce its two-to-three-day delivery capabilities.

Dive into Technavio’s robust research methodology, blending expert interviews, extensive data synthesis, and validated models for unparalleled E-commerce Logistics Market insights. See full methodology.

Market Scope
Page number 293
Base year 2025
Historic period 2020-2024
Forecast period 2026-2030
Growth momentum & CAGR Accelerate at a CAGR of 36.9%
Market growth 2026-2030 USD 1870.3 billion
Market structure Fragmented
YoY growth 2025-2026(%) 27.1%
Key countries China, Japan, India, South Korea, Australia, Indonesia, US, Canada, Mexico, Germany, UK, France, Italy, Spain, The Netherlands, Brazil, Argentina, Chile, Saudi Arabia, UAE, South Africa, Israel and Turkey
Competitive landscape Leading Companies, Market Positioning of Companies, Competitive Strategies, and Industry Risks

Request Free Sample

Research Analyst Overview

  • The E-commerce Logistics Market is evolving through intense technological integration. An effective omnichannel fulfillment strategy now hinges on a network of urban distribution centers and micro-fulfillment centers leveraging smart warehouse technology. Inside these facilities, a modern warehouse management system (WMS) enables dynamic order sequencing, orchestrating autonomous mobile robots and robotic picking systems.
  • The use of an automated storage and retrieval system (ASRS) is critical, improving storage density. For outbound flows, cross-docking facilities expedite transfers, while returns processing centers handle reverse logistics management with increasing returns management automation.
  • Boardroom decisions on CapEx are now directly influenced by the potential of agentic AI in logistics, with some operators achieving a 30% reduction in order processing time. An integrated logistics provider (ILP) must also master last-mile delivery optimization using route orchestration platforms for hyperlocal delivery models, supported by parcel locker networks and a growing fleet of electric delivery vehicles (EVs).
  • Multi-carrier shipping software is essential for flexibility. Success requires predictive demand forecasting, inventory optimization algorithms, and end-to-end real-time shipment tracking via a supply chain visibility platform or a full supply chain control tower.
  • This extends to specialized areas like cross-border fulfillment, where digital customs platforms and bonded warehousing solutions are key, cold chain e-commerce logistics for perishables, and even dropshipping fulfillment services and freight consolidation services. Finally, the adoption of sustainable packaging solutions and the application of artificial intelligence in logistics are becoming standard.

What are the Key Data Covered in this E-commerce Logistics Market Research and Growth Report?

  • What is the expected growth of the E-commerce Logistics Market between 2026 and 2030?

    • USD 1870.3 billion, at a CAGR of 36.9%

  • What segmentation does the market report cover?

    • The report is segmented by Usage (Domestic, and International), Service (Transportation, Warehousing, and Others), Type (Forward logistics, and Backward logistics) and Geography (APAC, North America, Europe, South America, Middle East and Africa)

  • Which regions are analyzed in the report?

    • APAC, North America, Europe, South America and Middle East and Africa

  • What are the key growth drivers and market challenges?

    • Retail expansion supporting North America logistics growth, Escalating last-mile delivery costs constraining profitability

  • Who are the major players in the E-commerce Logistics Market?

    • Agility Public Warehousing Co., Allcargo Gati Ltd., Aramex International LLC, C H Robinson Worldwide Inc., CMA CGM Group, Deutsche Post AG, DSV AS, eStore Logistics, FedEx Corp., GXO Logistics Inc., Kenco Group Inc., Kuehne Nagel Management AG, Nippon Express Holdings Inc., Rhenus SE and Co. KG, Schenker AG, SF Express Co. Ltd., Sinotrans Ltd., United Parcel Service Inc. and XPO Inc.

Market Research Insights

  • Market dynamics are increasingly shaped by the pursuit of operational excellence through technology. The focus on fulfillment network design and last-mile delivery analytics is intensifying, with companies that leverage predictive route optimization reporting up to a 15% improvement in delivery density.
  • A superior customer delivery experience is now a key differentiator, compelling providers to invest in real-time inventory management and automated returns processing. This has led to a rise in flexible fulfillment solutions, where adoption has grown by over 40% among mid-sized retailers.
  • Furthermore, the strategic use of on-demand warehousing for peak season logistics planning allows businesses to scale capacity without long-term capital commitments, improving asset utilization ratios significantly compared to fixed-infrastructure models.

We can help! Our analysts can customize this e-commerce logistics market research report to meet your requirements.

Get in touch

1. Executive Summary

1.1 Market overview

Executive Summary - Chart on Market Overview
Executive Summary - Data Table on Market Overview
Executive Summary - Chart on Global Market Characteristics
Executive Summary - Chart on Market by Geography
Executive Summary - Chart on Market Segmentation by Usage
Executive Summary - Chart on Market Segmentation by Service
Executive Summary - Chart on Market Segmentation by Type
Executive Summary - Chart on Incremental Growth
Executive Summary - Data Table on Incremental Growth
Executive Summary - Chart on Company Market Positioning

2. Technavio Analysis

2.1 Analysis of price sensitivity, lifecycle, customer purchase basket, adoption rates, and purchase criteria

2.2 Criticality of inputs and Factors of differentiation

Chart on Overview on criticality of inputs and factors of differentiation

2.3 Factors of disruption

Chart on Overview on factors of disruption

2.4 Impact of drivers and challenges

Chart on Impact of drivers and challenges in 2025 and 2030

3. Market Landscape

3.1 Market ecosystem

Chart on Parent Market
Data Table on - Parent Market

3.2 Market characteristics

Chart on Market characteristics analysis

3.3 Value chain analysis

Chart on Value chain analysis

4. Market Sizing

4.1 Market definition

Data Table on Offerings of companies included in the market definition

4.2 Market segment analysis

Market segments

4.3 Market size 2025

4.4 Market outlook: Forecast for 2025-2030

Chart on Global - Market size and forecast 2025-2030 ($ billion)
Data Table on Global - Market size and forecast 2025-2030 ($ billion)
Chart on Global Market: Year-over-year growth 2025-2030 (%)
Data Table on Global Market: Year-over-year growth 2025-2030 (%)

5. Historic Market Size

5.1 Global E-Commerce Logistics Market 2020 - 2024

Historic Market Size - Data Table on Global E-Commerce Logistics Market 2020 - 2024 ($ billion)

5.2 Usage segment analysis 2020 - 2024

Historic Market Size - Usage Segment 2020 - 2024 ($ billion)

5.3 Service segment analysis 2020 - 2024

Historic Market Size - Service Segment 2020 - 2024 ($ billion)

5.4 Type segment analysis 2020 - 2024

Historic Market Size - Type Segment 2020 - 2024 ($ billion)

5.5 Geography segment analysis 2020 - 2024

Historic Market Size - Geography Segment 2020 - 2024 ($ billion)

5.6 Country segment analysis 2020 - 2024

Historic Market Size - Country Segment 2020 - 2024 ($ billion)

6. Qualitative Analysis

6.1 Impact of AI in global e-commerce logistics market

7. Five Forces Analysis

7.1 Five forces summary

Five forces analysis - Comparison between 2025 and 2030

7.2 Bargaining power of buyers

Bargaining power of buyers - Impact of key factors 2025 and 2030

7.3 Bargaining power of suppliers

Bargaining power of suppliers - Impact of key factors in 2025 and 2030

7.4 Threat of new entrants

Threat of new entrants - Impact of key factors in 2025 and 2030

7.5 Threat of substitutes

Threat of substitutes - Impact of key factors in 2025 and 2030

7.6 Threat of rivalry

Threat of rivalry - Impact of key factors in 2025 and 2030

7.7 Market condition

Chart on Market condition - Five forces 2025 and 2030

8. Market Segmentation by Usage

8.1 Market segments

Chart on Usage - Market share 2025-2030 (%)
Data Table on Usage - Market share 2025-2030 (%)

8.2 Comparison by Usage

Chart on Comparison by Usage
Data Table on Comparison by Usage

8.3 Domestic - Market size and forecast 2025-2030

Chart on Domestic - Market size and forecast 2025-2030 ($ billion)
Data Table on Domestic - Market size and forecast 2025-2030 ($ billion)
Chart on Domestic - Year-over-year growth 2025-2030 (%)
Data Table on Domestic - Year-over-year growth 2025-2030 (%)

8.4 International - Market size and forecast 2025-2030

Chart on International - Market size and forecast 2025-2030 ($ billion)
Data Table on International - Market size and forecast 2025-2030 ($ billion)
Chart on International - Year-over-year growth 2025-2030 (%)
Data Table on International - Year-over-year growth 2025-2030 (%)

8.5 Market opportunity by Usage

Market opportunity by Usage ($ billion)
Data Table on Market opportunity by Usage ($ billion)

9. Market Segmentation by Service

9.1 Market segments

Chart on Service - Market share 2025-2030 (%)
Data Table on Service - Market share 2025-2030 (%)

9.2 Comparison by Service

Chart on Comparison by Service
Data Table on Comparison by Service

9.3 Transportation - Market size and forecast 2025-2030

Chart on Transportation - Market size and forecast 2025-2030 ($ billion)
Data Table on Transportation - Market size and forecast 2025-2030 ($ billion)
Chart on Transportation - Year-over-year growth 2025-2030 (%)
Data Table on Transportation - Year-over-year growth 2025-2030 (%)

9.4 Warehousing - Market size and forecast 2025-2030

Chart on Warehousing - Market size and forecast 2025-2030 ($ billion)
Data Table on Warehousing - Market size and forecast 2025-2030 ($ billion)
Chart on Warehousing - Year-over-year growth 2025-2030 (%)
Data Table on Warehousing - Year-over-year growth 2025-2030 (%)

9.5 Others - Market size and forecast 2025-2030

Chart on Others - Market size and forecast 2025-2030 ($ billion)
Data Table on Others - Market size and forecast 2025-2030 ($ billion)
Chart on Others - Year-over-year growth 2025-2030 (%)
Data Table on Others - Year-over-year growth 2025-2030 (%)

9.6 Market opportunity by Service

Market opportunity by Service ($ billion)
Data Table on Market opportunity by Service ($ billion)

10. Market Segmentation by Type

10.1 Market segments

Chart on Type - Market share 2025-2030 (%)
Data Table on Type - Market share 2025-2030 (%)

10.2 Comparison by Type

Chart on Comparison by Type
Data Table on Comparison by Type

10.3 Forward logistics - Market size and forecast 2025-2030

Chart on Forward logistics - Market size and forecast 2025-2030 ($ billion)
Data Table on Forward logistics - Market size and forecast 2025-2030 ($ billion)
Chart on Forward logistics - Year-over-year growth 2025-2030 (%)
Data Table on Forward logistics - Year-over-year growth 2025-2030 (%)

10.4 Backward logistics - Market size and forecast 2025-2030

Chart on Backward logistics - Market size and forecast 2025-2030 ($ billion)
Data Table on Backward logistics - Market size and forecast 2025-2030 ($ billion)
Chart on Backward logistics - Year-over-year growth 2025-2030 (%)
Data Table on Backward logistics - Year-over-year growth 2025-2030 (%)

10.5 Market opportunity by Type

Market opportunity by Type ($ billion)
Data Table on Market opportunity by Type ($ billion)

11. Customer Landscape

11.1 Customer landscape overview

Analysis of price sensitivity, lifecycle, customer purchase basket, adoption rates, and purchase criteria

12. Geographic Landscape

12.1 Geographic segmentation

Chart on Market share by geography 2025-2030 (%)
Data Table on Market share by geography 2025-2030 (%)

12.2 Geographic comparison

Chart on Geographic comparison
Data Table on Geographic comparison

12.3 APAC - Market size and forecast 2025-2030

Chart on APAC - Market size and forecast 2025-2030 ($ billion)
Data Table on APAC - Market size and forecast 2025-2030 ($ billion)
Chart on APAC - Year-over-year growth 2025-2030 (%)
Data Table on APAC - Year-over-year growth 2025-2030 (%)
Chart on Regional Comparison - APAC
Data Table on Regional Comparison - APAC

12.3.1 China - Market size and forecast 2025-2030

Chart on China - Market size and forecast 2025-2030 ($ billion)
Data Table on China - Market size and forecast 2025-2030 ($ billion)
Chart on China - Year-over-year growth 2025-2030 (%)
Data Table on China - Year-over-year growth 2025-2030 (%)

12.3.2 Japan - Market size and forecast 2025-2030

Chart on Japan - Market size and forecast 2025-2030 ($ billion)
Data Table on Japan - Market size and forecast 2025-2030 ($ billion)
Chart on Japan - Year-over-year growth 2025-2030 (%)
Data Table on Japan - Year-over-year growth 2025-2030 (%)

12.3.3 India - Market size and forecast 2025-2030

Chart on India - Market size and forecast 2025-2030 ($ billion)
Data Table on India - Market size and forecast 2025-2030 ($ billion)
Chart on India - Year-over-year growth 2025-2030 (%)
Data Table on India - Year-over-year growth 2025-2030 (%)

12.3.4 South Korea - Market size and forecast 2025-2030

Chart on South Korea - Market size and forecast 2025-2030 ($ billion)
Data Table on South Korea - Market size and forecast 2025-2030 ($ billion)
Chart on South Korea - Year-over-year growth 2025-2030 (%)
Data Table on South Korea - Year-over-year growth 2025-2030 (%)

12.3.5 Australia - Market size and forecast 2025-2030

Chart on Australia - Market size and forecast 2025-2030 ($ billion)
Data Table on Australia - Market size and forecast 2025-2030 ($ billion)
Chart on Australia - Year-over-year growth 2025-2030 (%)
Data Table on Australia - Year-over-year growth 2025-2030 (%)

12.3.6 Indonesia - Market size and forecast 2025-2030

Chart on Indonesia - Market size and forecast 2025-2030 ($ billion)
Data Table on Indonesia - Market size and forecast 2025-2030 ($ billion)
Chart on Indonesia - Year-over-year growth 2025-2030 (%)
Data Table on Indonesia - Year-over-year growth 2025-2030 (%)

12.4 North America - Market size and forecast 2025-2030

Chart on North America - Market size and forecast 2025-2030 ($ billion)
Data Table on North America - Market size and forecast 2025-2030 ($ billion)
Chart on North America - Year-over-year growth 2025-2030 (%)
Data Table on North America - Year-over-year growth 2025-2030 (%)
Chart on Regional Comparison - North America
Data Table on Regional Comparison - North America

12.4.1 US - Market size and forecast 2025-2030

Chart on US - Market size and forecast 2025-2030 ($ billion)
Data Table on US - Market size and forecast 2025-2030 ($ billion)
Chart on US - Year-over-year growth 2025-2030 (%)
Data Table on US - Year-over-year growth 2025-2030 (%)

12.4.2 Canada - Market size and forecast 2025-2030

Chart on Canada - Market size and forecast 2025-2030 ($ billion)
Data Table on Canada - Market size and forecast 2025-2030 ($ billion)
Chart on Canada - Year-over-year growth 2025-2030 (%)
Data Table on Canada - Year-over-year growth 2025-2030 (%)

12.4.3 Mexico - Market size and forecast 2025-2030

Chart on Mexico - Market size and forecast 2025-2030 ($ billion)
Data Table on Mexico - Market size and forecast 2025-2030 ($ billion)
Chart on Mexico - Year-over-year growth 2025-2030 (%)
Data Table on Mexico - Year-over-year growth 2025-2030 (%)

12.5 Europe - Market size and forecast 2025-2030

Chart on Europe - Market size and forecast 2025-2030 ($ billion)
Data Table on Europe - Market size and forecast 2025-2030 ($ billion)
Chart on Europe - Year-over-year growth 2025-2030 (%)
Data Table on Europe - Year-over-year growth 2025-2030 (%)
Chart on Regional Comparison - Europe
Data Table on Regional Comparison - Europe

12.5.1 Germany - Market size and forecast 2025-2030

Chart on Germany - Market size and forecast 2025-2030 ($ billion)
Data Table on Germany - Market size and forecast 2025-2030 ($ billion)
Chart on Germany - Year-over-year growth 2025-2030 (%)
Data Table on Germany - Year-over-year growth 2025-2030 (%)

12.5.2 UK - Market size and forecast 2025-2030

Chart on UK - Market size and forecast 2025-2030 ($ billion)
Data Table on UK - Market size and forecast 2025-2030 ($ billion)
Chart on UK - Year-over-year growth 2025-2030 (%)
Data Table on UK - Year-over-year growth 2025-2030 (%)

12.5.3 France - Market size and forecast 2025-2030

Chart on France - Market size and forecast 2025-2030 ($ billion)
Data Table on France - Market size and forecast 2025-2030 ($ billion)
Chart on France - Year-over-year growth 2025-2030 (%)
Data Table on France - Year-over-year growth 2025-2030 (%)

12.5.4 Italy - Market size and forecast 2025-2030

Chart on Italy - Market size and forecast 2025-2030 ($ billion)
Data Table on Italy - Market size and forecast 2025-2030 ($ billion)
Chart on Italy - Year-over-year growth 2025-2030 (%)
Data Table on Italy - Year-over-year growth 2025-2030 (%)

12.5.5 Spain - Market size and forecast 2025-2030

Chart on Spain - Market size and forecast 2025-2030 ($ billion)
Data Table on Spain - Market size and forecast 2025-2030 ($ billion)
Chart on Spain - Year-over-year growth 2025-2030 (%)
Data Table on Spain - Year-over-year growth 2025-2030 (%)

12.5.6 The Netherlands - Market size and forecast 2025-2030

Chart on The Netherlands - Market size and forecast 2025-2030 ($ billion)
Data Table on The Netherlands - Market size and forecast 2025-2030 ($ billion)
Chart on The Netherlands - Year-over-year growth 2025-2030 (%)
Data Table on The Netherlands - Year-over-year growth 2025-2030 (%)

12.6 South America - Market size and forecast 2025-2030

Chart on South America - Market size and forecast 2025-2030 ($ billion)
Data Table on South America - Market size and forecast 2025-2030 ($ billion)
Chart on South America - Year-over-year growth 2025-2030 (%)
Data Table on South America - Year-over-year growth 2025-2030 (%)
Chart on Regional Comparison - South America
Data Table on Regional Comparison - South America

12.6.1 Brazil - Market size and forecast 2025-2030

Chart on Brazil - Market size and forecast 2025-2030 ($ billion)
Data Table on Brazil - Market size and forecast 2025-2030 ($ billion)
Chart on Brazil - Year-over-year growth 2025-2030 (%)
Data Table on Brazil - Year-over-year growth 2025-2030 (%)

12.6.2 Argentina - Market size and forecast 2025-2030

Chart on Argentina - Market size and forecast 2025-2030 ($ billion)
Data Table on Argentina - Market size and forecast 2025-2030 ($ billion)
Chart on Argentina - Year-over-year growth 2025-2030 (%)
Data Table on Argentina - Year-over-year growth 2025-2030 (%)

12.6.3 Chile - Market size and forecast 2025-2030

Chart on Chile - Market size and forecast 2025-2030 ($ billion)
Data Table on Chile - Market size and forecast 2025-2030 ($ billion)
Chart on Chile - Year-over-year growth 2025-2030 (%)
Data Table on Chile - Year-over-year growth 2025-2030 (%)

12.7 Middle East and Africa - Market size and forecast 2025-2030

Chart on Middle East and Africa - Market size and forecast 2025-2030 ($ billion)
Data Table on Middle East and Africa - Market size and forecast 2025-2030 ($ billion)
Chart on Middle East and Africa - Year-over-year growth 2025-2030 (%)
Data Table on Middle East and Africa - Year-over-year growth 2025-2030 (%)
Chart on Regional Comparison - Middle East and Africa
Data Table on Regional Comparison - Middle East and Africa

12.7.1 Saudi Arabia - Market size and forecast 2025-2030

Chart on Saudi Arabia - Market size and forecast 2025-2030 ($ billion)
Data Table on Saudi Arabia - Market size and forecast 2025-2030 ($ billion)
Chart on Saudi Arabia - Year-over-year growth 2025-2030 (%)
Data Table on Saudi Arabia - Year-over-year growth 2025-2030 (%)

12.7.2 UAE - Market size and forecast 2025-2030

Chart on UAE - Market size and forecast 2025-2030 ($ billion)
Data Table on UAE - Market size and forecast 2025-2030 ($ billion)
Chart on UAE - Year-over-year growth 2025-2030 (%)
Data Table on UAE - Year-over-year growth 2025-2030 (%)

12.7.3 South Africa - Market size and forecast 2025-2030

Chart on South Africa - Market size and forecast 2025-2030 ($ billion)
Data Table on South Africa - Market size and forecast 2025-2030 ($ billion)
Chart on South Africa - Year-over-year growth 2025-2030 (%)
Data Table on South Africa - Year-over-year growth 2025-2030 (%)

12.7.4 Israel - Market size and forecast 2025-2030

Chart on Israel - Market size and forecast 2025-2030 ($ billion)
Data Table on Israel - Market size and forecast 2025-2030 ($ billion)
Chart on Israel - Year-over-year growth 2025-2030 (%)
Data Table on Israel - Year-over-year growth 2025-2030 (%)

12.7.5 Turkey - Market size and forecast 2025-2030

Chart on Turkey - Market size and forecast 2025-2030 ($ billion)
Data Table on Turkey - Market size and forecast 2025-2030 ($ billion)
Chart on Turkey - Year-over-year growth 2025-2030 (%)
Data Table on Turkey - Year-over-year growth 2025-2030 (%)

12.8 Market opportunity by geography

Market opportunity by geography ($ billion)
Data Tables on Market opportunity by geography ($ billion)

13. Drivers, Challenges, and Opportunity

13.1 Market drivers

Retail expansion supporting North America logistics growth
Digital adoption accelerating APAC e-commerce logistics
Logistics technology innovation accelerating market growth

13.2 Market challenges

Escalating last-mile delivery costs constraining profitability
Infrastructure constraints in APAC e-commerce logistics
Regulatory compliance challenges in global e-commerce logistics

13.3 Impact of drivers and challenges

Impact of drivers and challenges in 2025 and 2030

13.4 Market opportunities

Automation and AI adoption transforming operations
Cross-border fulfillment localization accelerating delivery efficiency
Environmental integration redefining logistics strategies

14. Competitive Landscape

14.1 Overview

14.2

Overview on criticality of inputs and factors of differentiation

14.3 Landscape disruption

Overview on factors of disruption

14.4 Industry risks

Impact of key risks on business

15. Competitive Analysis

15.1 Companies profiled

Companies covered

15.2 Company ranking index

15.3 Market positioning of companies

Matrix on companies position and classification

15.4 Allcargo Gati Ltd.

Allcargo Gati Ltd. - Overview
Allcargo Gati Ltd. - Business segments
Allcargo Gati Ltd. - Key offerings
Allcargo Gati Ltd. - Segment focus
SWOT

15.5 Aramex International LLC

Aramex International LLC - Overview
Aramex International LLC - Product / Service
Aramex International LLC - Key news
Aramex International LLC - Key offerings
SWOT

15.6 C H Robinson Worldwide Inc.

C H Robinson Worldwide Inc. - Overview
C H Robinson Worldwide Inc. - Product / Service
C H Robinson Worldwide Inc. - Key news
C H Robinson Worldwide Inc. - Key offerings
SWOT

15.7 CMA CGM Group

CMA CGM Group - Overview
CMA CGM Group - Product / Service
CMA CGM Group - Key news
CMA CGM Group - Key offerings
SWOT

15.8 Deutsche Post AG

Deutsche Post AG - Overview
Deutsche Post AG - Business segments
Deutsche Post AG - Key news
Deutsche Post AG - Key offerings
Deutsche Post AG - Segment focus
SWOT

15.9 DSV AS

DSV AS - Overview
DSV AS - Business segments
DSV AS - Key offerings
DSV AS - Segment focus
SWOT

15.10 FedEx Corp.

FedEx Corp. - Overview
FedEx Corp. - Business segments
FedEx Corp. - Key news
FedEx Corp. - Key offerings
FedEx Corp. - Segment focus
SWOT

15.11 GXO Logistics Inc.

GXO Logistics Inc. - Overview
GXO Logistics Inc. - Product / Service
GXO Logistics Inc. - Key offerings
SWOT

15.12 Kuehne Nagel Management AG

Kuehne Nagel Management AG - Overview
Kuehne Nagel Management AG - Business segments
Kuehne Nagel Management AG - Key news
Kuehne Nagel Management AG - Key offerings
Kuehne Nagel Management AG - Segment focus
SWOT

15.13 Nippon Express Holdings Inc.

Nippon Express Holdings Inc. - Overview
Nippon Express Holdings Inc. - Business segments
Nippon Express Holdings Inc. - Key news
Nippon Express Holdings Inc. - Key offerings
Nippon Express Holdings Inc. - Segment focus
SWOT

15.14 Rhenus SE and Co. KG

Rhenus SE and Co. KG - Overview
Rhenus SE and Co. KG - Product / Service
Rhenus SE and Co. KG - Key offerings
SWOT

15.15 Schenker AG

Schenker AG - Overview
Schenker AG - Product / Service
Schenker AG - Key offerings
SWOT

15.16 SF Express Co. Ltd.

SF Express Co. Ltd. - Overview
SF Express Co. Ltd. - Business segments
SF Express Co. Ltd. - Key offerings
SF Express Co. Ltd. - Segment focus
SWOT

15.17 United Parcel Service Inc.

United Parcel Service Inc. - Overview
United Parcel Service Inc. - Business segments
United Parcel Service Inc. - Key news
United Parcel Service Inc. - Key offerings
United Parcel Service Inc. - Segment focus
SWOT

15.18 XPO Inc.

XPO Inc. - Overview
XPO Inc. - Business segments
XPO Inc. - Key news
XPO Inc. - Key offerings
XPO Inc. - Segment focus
SWOT

16. Appendix

16.1 Scope of the report

Market definition
Objectives
Notes and caveats

16.2 Inclusions and exclusions checklist

Inclusions checklist
Exclusions checklist

16.3 Currency conversion rates for US$

16.4 Research methodology

16.5 Data procurement

Information sources

16.6 Data validation

16.7 Validation techniques employed for market sizing

16.8 Data synthesis

16.9 360 degree market analysis

16.10 List of abbreviations

Research Methodology

Technavio presents a detailed picture of the market by way of study, synthesis, and summation of data from multiple sources. The analysts have presented the various facets of the market with a particular focus on identifying the key industry influencers. The data thus presented is comprehensive, reliable, and the result of extensive research, both primary and secondary.

INFORMATION SOURCES

Primary sources

  • Manufacturers and suppliers
  • Channel partners
  • Industry experts
  • Strategic decision makers

Secondary sources

  • Industry journals and periodicals
  • Government data
  • Financial reports of key industry players
  • Historical data
  • Press releases

DATA ANALYSIS

Data Synthesis

  • Collation of data
  • Estimation of key figures
  • Analysis of derived insights

Data Validation

  • Triangulation with data models
  • Reference against proprietary databases
  • Corroboration with industry experts

REPORT WRITING

Qualitative

  • Market drivers
  • Market challenges
  • Market trends
  • Five forces analysis

Quantitative

  • Market size and forecast
  • Market segmentation
  • Geographical insights
  • Competitive landscape

Interested in this report?

Get your sample now to see our research methodology and insights!

Download Now

Frequently Asked Questions

E-commerce Logistics market growth will increase by USD 1870.3 billion during 2026-2030 .

The E-commerce Logistics market is expected to grow at a CAGR of 36.9% during 2026-2030 .

E-commerce Logistics market is segmented by Usage (Domestic, International) Service (Transportation, Warehousing, Others) Type (Forward logistics, Backward logistics)

Agility Public Warehousing Co., Allcargo Gati Ltd., Aramex International LLC, C H Robinson Worldwide Inc., CMA CGM Group, Deutsche Post AG, DSV AS, eStore Logistics, FedEx Corp., GXO Logistics Inc., Kenco Group Inc., Kuehne Nagel Management AG, Nippon Express Holdings Inc., Rhenus SE and Co. KG, Schenker AG, SF Express Co. Ltd., Sinotrans Ltd., United Parcel Service Inc., XPO Inc. are a few of the key vendors in the E-commerce Logistics market.

APAC will register the highest growth rate of 57.3% among the other regions. Therefore, the E-commerce Logistics market in APAC is expected to garner significant business opportunities for the vendors during the forecast period.

China, Japan, India, South Korea, Australia, Indonesia, US, Canada, Mexico, Germany, UK, France, Italy, Spain, The Netherlands, Brazil, Argentina, Chile, Saudi Arabia, UAE, South Africa, Israel, Turkey

  • Retail expansion supporting North America logistics growth is the driving factor this market.

The E-commerce Logistics market vendors should focus on grabbing business opportunities from the Usage segment as it accounted for the largest market share in the base year.