Electric Commercial Vehicle (ECV) Market Size 2026-2030
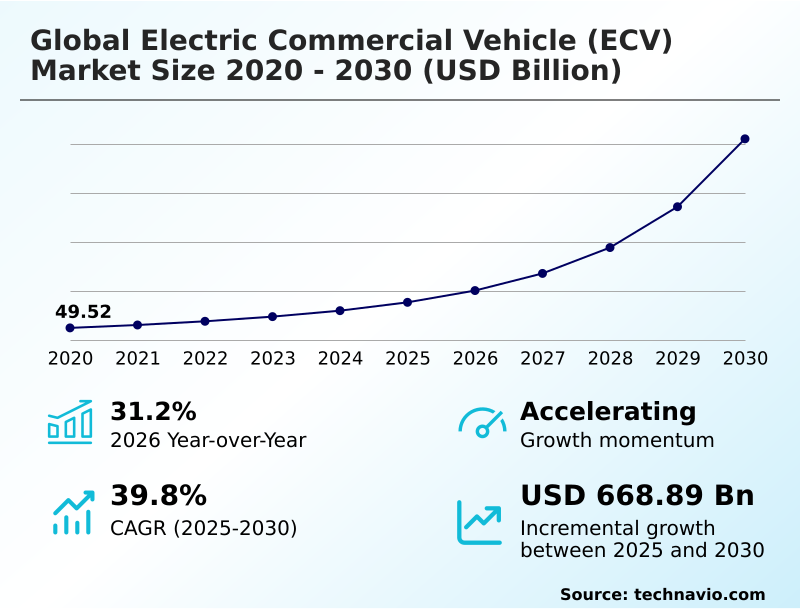
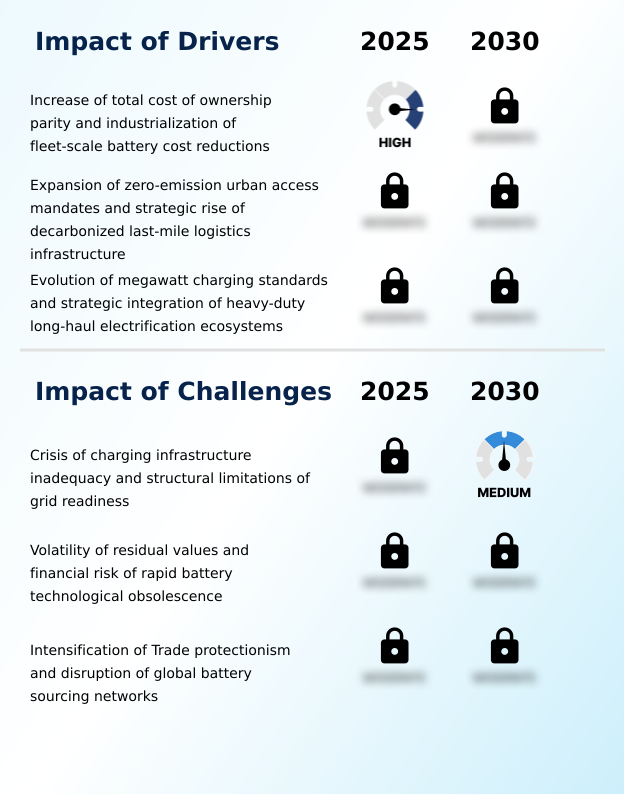
The electric commercial vehicle (ecv) market size is valued to increase by USD 668.89 billion, at a CAGR of 39.8% from 2025 to 2030. Increase of total cost of ownership parity and industrialization of fleet-scale battery cost reductions will drive the electric commercial vehicle (ecv) market.
Major Market Trends & Insights
- APAC dominated the market and accounted for a 50.3% growth during the forecast period.
- By Product - LCVs segment was valued at USD 76.18 billion in 2024
- By Type - Battery electric vehicle (BEV) segment accounted for the largest market revenue share in 2024
Market Size & Forecast
- Market Opportunities: USD 773.48 billion
- Market Future Opportunities: USD 668.89 billion
- CAGR from 2025 to 2030 : 39.8%
Market Summary
- The Electric Commercial Vehicle (ECV) Market is undergoing a rapid industrialization, moving from niche applications to mainstream fleet adoption. This transition is propelled by the compelling economic case for total cost of ownership (TCO) parity with diesel counterparts, as advancements in electric powertrain efficiency and declining battery costs reduce operational expenditures.
- A key trend is the expansion into demanding applications, with heavy-duty prime movers and Class 8 electric trucks being developed to handle long-haul freight. These zero-emission vehicles leverage sophisticated battery management systems and regenerative braking to maximize range and performance.
- However, significant headwinds persist, including charging infrastructure inadequacy and the financial risks associated with residual value volatility as new technologies like solid-state batteries emerge. For a regional logistics provider, this landscape requires a strategic pivot.
- The firm must now evaluate not just vehicle procurement costs but also depot grid upgrades, charging schedules, and driver training, transforming a simple asset purchase into a complex energy and operational planning exercise to maintain a competitive edge. This evolution underscores the market's shift toward integrated, technology-driven transportation ecosystems.
What will be the Size of the Electric Commercial Vehicle (ECV) Market during the forecast period?
Get Key Insights on Market Forecast (PDF) Get Free Sample
How is the Electric Commercial Vehicle (ECV) Market Segmented?
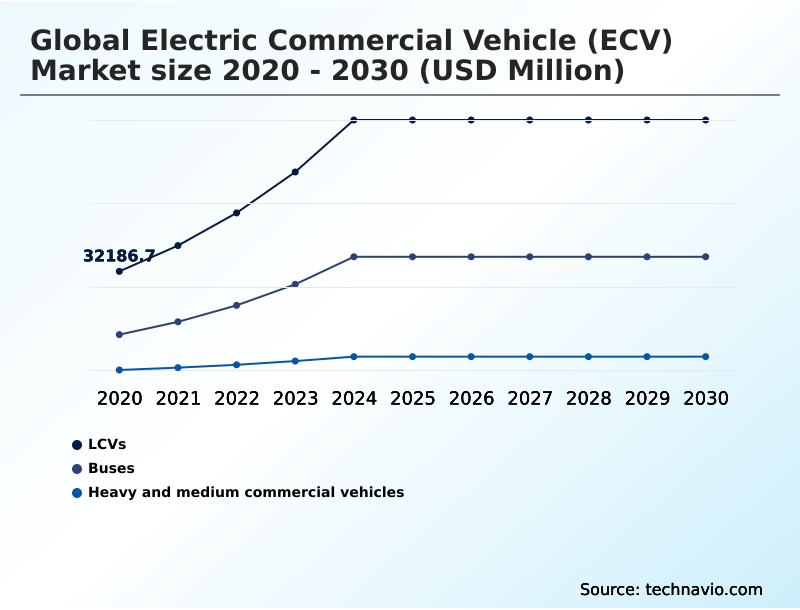
The electric commercial vehicle (ecv) industry research report provides comprehensive data (region-wise segment analysis), with forecasts and estimates in "USD million" for the period 2026-2030, as well as historical data from 2020-2024 for the following segments.
- Product
- LCVs
- Buses
- Heavy and medium commercial vehicles
- Type
- Battery electric vehicle (BEV)
- Plug-in hybrid electric vehicle (PHEV)
- Fuel cell electric vehicle (FCEV)
- Variant
- 0 to 150 miles
- 151 to 250 miles
- 251 to 500 miles
- 500+ miles
- Geography
- APAC
- China
- India
- Japan
- North America
- US
- Canada
- Mexico
- Europe
- Germany
- France
- UK
- Middle East and Africa
- UAE
- Saudi Arabia
- South Africa
- South America
- Brazil
- Argentina
- Rest of World (ROW)
- APAC
By Product Insights
The lcvs segment is estimated to witness significant growth during the forecast period.
The light commercial vehicle segment is a pivotal growth area, driven by the need for decarbonized last-mile logistics and broader urban mobility transformation.
Fleet operators are prioritizing light-duty electric vans to comply with stringent urban access regulations, a trend reflected in a 156% year-on-year increase in retail sales in certain high-growth markets.
This adoption is supported by advancements in purpose-built electric chassis that optimize payload for last-mile delivery without compromising maneuverability. The integration of fleet telematics and energy-aware fleet management software is crucial for optimizing route efficiency and charging cycles.
As the industry evolves, the focus shifts to diversifying battery chemistries and exploring off-grid charging solutions to support a wider range of vocational vehicles and ensure operational resilience.
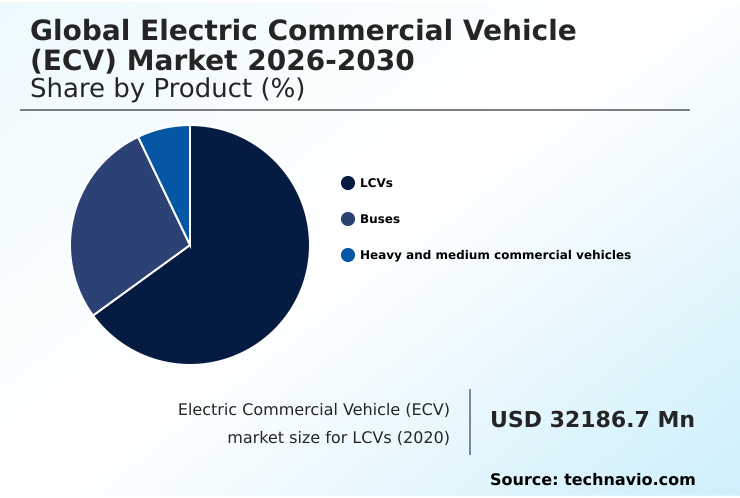
The LCVs segment was valued at USD 76.18 billion in 2024 and showed a gradual increase during the forecast period.
Regional Analysis
APAC is estimated to contribute 50.3% to the growth of the global market during the forecast period.Technavio’s analysts have elaborately explained the regional trends and drivers that shape the market during the forecast period.

See How Electric Commercial Vehicle (ECV) Market Demand is Rising in APAC Get Free Sample
The geographic landscape is led by APAC, which accounts for over 50.3% of the market's incremental growth, driven by massive manufacturing scale and government mandates for intercity bus fleets.
The region is a leader in deploying battery-swapping technology and building domestic supply chains for critical components, supporting a robust circular battery economies.
In North America and Europe, growth is fueled by corporate ESG goals and regulations promoting zero-emission urban access.
These regions are focused on regional freight electrification, establishing electric freight corridors for heavy-duty trucks equipped with high-capacity battery packs and high-torque electric powertrains.
The use of modular skateboard platforms is accelerating production across all regions, enabling manufacturers to meet diverse regional demands for sustainable transport.
Market Dynamics
Our researchers analyzed the data with 2025 as the base year, along with the key drivers, trends, and challenges. A holistic analysis of drivers will help companies refine their marketing strategies to gain a competitive advantage.
- The strategic shift toward fleet electrification involves complex analysis far beyond initial vehicle cost. A primary consideration is the total cost of ownership electric vs diesel, which requires a detailed look at the maintenance cost comparison of electric commercial vehicles and potential vehicle-to-grid revenue stream models.
- For logistics firms, the zero-emission zones impact on logistics is a major catalyst, but the challenges of commercial depot electrification and the grid impact of large-scale EV charging present significant operational hurdles. Technology selection is critical, involving a deep dive into FCEV vs BEV for heavy-duty applications.
- While hydrogen fuel cells for long-haul transport offer range advantages, BEVs are seeing breakthroughs with megawatt charging systems for heavy-duty trucks. The financing models for electric fleet conversion are evolving to address the high upfront cost and the residual value of used electric trucks, a figure made volatile by rapid innovation.
- Operators are closely watching the development of solid-state batteries in commercial vehicles and the impact of tariffs on EV components on future pricing. Operationally, the focus is on optimizing the electric van last-mile delivery ROI, which is enhanced by lightweighting strategies for electric trucks and the modular battery architecture benefits.
- Ensuring vehicle longevity requires advanced thermal management for rapid charging and accounting for the cold weather performance of electric buses. Finally, the rise of battery swapping technology for commercial fleets and the use of AI for electric fleet charge management are becoming key differentiators for achieving efficiency at scale.
- This landscape shows that fleet conversion success is now at least 25% more dependent on integrated energy strategy than on vehicle choice alone.
What are the key market drivers leading to the rise in the adoption of Electric Commercial Vehicle (ECV) Industry?
- The convergence toward total cost of ownership parity, accelerated by the industrialization of fleet-scale battery cost reductions, is a primary driver of market growth.
- The primary driver is the accelerating push toward total cost of ownership (TCO) parity, underpinned by fleet-scale battery cost reductions.
- This economic imperative is reinforced by stringent zero-emission mandates, which have propelled electric vans to achieve a record market share of nearly 14% in key urban centers.
- For heavy-duty long-haul electrification, the evolution of megawatt charging systems and high-power charging networks is critical, with some heavy commercial vehicle segments seeing a 34.74% year-on-year sales increase.
- These systems eliminate range anxiety and, when combined with financing models like Battery-as-a-Service (BaaS), significantly lower entry barriers.
- Furthermore, the development of smart-charging load balancing is essential for ensuring depot-level grid-readiness, making large-scale fleet conversion feasible without destabilizing local power infrastructure.
What are the market trends shaping the Electric Commercial Vehicle (ECV) Industry?
- A key market trend is the systematization of heavy-duty prime movers, expanding electrification beyond urban delivery. This shift drives the decarbonization of high-payload logistics.
- A key trend is the proliferation of AI-driven energy orchestration, transforming fleets into a grid-integrated energy node. The share of new electric vehicles with plug-in capabilities has surpassed one-third in leading markets, driving demand for smart depot charging solutions. This involves vehicle-to-grid (V2G) technology, allowing idle fleets to sell power back to the grid.
- Concurrently, the expansion of modular battery architectures is central to enabling second-life repurposing and skills-first maintenance intelligence, with AI-driven diagnostics improving predictive uptime by over 20%. As the industry advances with silicon-anode technologies, this modularity helps mitigate the risk of battery technological obsolescence. This shift ensures that heavy-duty prime movers and other commercial EVs remain operationally viable throughout their lifecycle.
What challenges does the Electric Commercial Vehicle (ECV) Industry face during its growth?
- A critical challenge affecting industry growth is the inadequacy of charging infrastructure, compounded by the structural limitations of grid readiness for mass fleet deployment.
- A primary challenge is the acute charging infrastructure inadequacy, which threatens to slow mass deployment as fleet expansion outpaces local grid capacity by up to 40% in some industrial zones. This issue is compounded by financial risks, particularly the residual value volatility of used vehicles, stemming from a lack of standardized battery degradation data.
- The industry also faces escalating trade protectionism, which disrupts global battery sourcing and forces costly efforts to establish resilient domestic supply chains for components like power inverters and high-voltage power electronics. These geopolitical tensions add significant cost pressures, with non-compliance penalties in some regions exceeding five thousand dollars per vehicle.
- This forces a re-evaluation of procurement strategies and emphasizes the need for technological hedging with alternatives like hydrogen fuel cells.
Exclusive Technavio Analysis on Customer Landscape
The electric commercial vehicle (ecv) market forecasting report includes the adoption lifecycle of the market, covering from the innovator’s stage to the laggard’s stage. It focuses on adoption rates in different regions based on penetration. Furthermore, the electric commercial vehicle (ecv) market report also includes key purchase criteria and drivers of price sensitivity to help companies evaluate and develop their market growth analysis strategies.

Customer Landscape of Electric Commercial Vehicle (ECV) Industry
Competitive Landscape
Companies are implementing various strategies, such as strategic alliances, electric commercial vehicle (ecv) market forecast, partnerships, mergers and acquisitions, geographical expansion, and product/service launches, to enhance their presence in the industry.
AB Volvo - An established portfolio of heavy-duty electric trucks and regional haul platforms defines the company's strategic focus on commercial fleet electrification and advanced logistics solutions.
The industry research and growth report includes detailed analyses of the competitive landscape of the market and information about key companies, including:
- AB Volvo
- BYD Co. Ltd.
- Daimler Truck AG
- Ford Motor Co.
- Geely Automobile Holdings Ltd.
- General Motors Co.
- Hyundai Motor Co.
- Jianghuai Automobile Group Co.
- Kenworth Truck Co.
- Motor Coach Industries Inc.
- Nissan Motor Co. Ltd.
- Olectra Greentech Ltd.
- Rivian Automotive Inc.
- Stellantis NV
- Tata Motors Ltd.
- Tesla Inc.
- Toyota Motor Corp.
- Traton SE
- Volkswagen AG
- Xiamen King Long Motor Co. Ltd.
Qualitative and quantitative analysis of companies has been conducted to help clients understand the wider business environment as well as the strengths and weaknesses of key industry players. Data is qualitatively analyzed to categorize companies as pure play, category-focused, industry-focused, and diversified; it is quantitatively analyzed to categorize companies as dominant, leading, strong, tentative, and weak.
Recent Development and News in Electric commercial vehicle (ecv) market
- In January 2025, Tata Motors unveiled its Prima E.55S heavy-duty electric truck, a platform designed for a 55-tonne gross vehicle weight, targeting high-payload logistics in the APAC region.
- In January 2025, the Flexis joint venture, a collaboration between the Volvo Group and Renault, secured an order for 15,000 all-electric vans from European logistics providers to support urban delivery networks.
- In January 2025, Amazon initiated a significant expansion of its heavy-duty electric fleet by acquiring 200 eActros 600 long-haul trucks from Daimler, intended for freight operations between Germany and the UK.
- In October 2024, the US Environmental Protection Agency finalized new heavy-duty vehicle standards, which mandate a significant portion of new commercial trucks and buses to be zero-emission by the early 2030s.
Dive into Technavio’s robust research methodology, blending expert interviews, extensive data synthesis, and validated models for unparalleled Electric Commercial Vehicle (ECV) Market insights. See full methodology.
| Market Scope | |
|---|---|
| Page number | 309 |
| Base year | 2025 |
| Historic period | 2020-2024 |
| Forecast period | 2026-2030 |
| Growth momentum & CAGR | Accelerate at a CAGR of 39.8% |
| Market growth 2026-2030 | USD 668889.9 million |
| Market structure | Fragmented |
| YoY growth 2025-2026(%) | 31.2% |
| Key countries | China, India, Japan, South Korea, Indonesia, Australia, US, Canada, Mexico, Germany, France, UK, Italy, The Netherlands, Spain, UAE, Saudi Arabia, South Africa, Turkey, Israel, Brazil, Argentina and Chile |
| Competitive landscape | Leading Companies, Market Positioning of Companies, Competitive Strategies, and Industry Risks |
Research Analyst Overview
- The Electric Commercial Vehicle (ECV) Market is undergoing a definitive industrialization, moving beyond pilot programs to mass fleet deployment. This shift is built on the convergence of mature electric powertrain technologies, including high-torque electric powertrains and efficient power inverters, which are essential for zero-emission vehicles.
- Key enablers include advancements in energy storage, from high-density battery chemistries and high-capacity battery packs to next-generation solid-state batteries and lithium-iron-phosphate cells. The challenge of downtime is being addressed by megawatt charging systems and megawatt-class charging, while battery-swapping technology offers an alternative for high-utilization fleets.
- Operationally, battery management systems are crucial for optimizing performance, leveraging data from regenerative braking and managing thermal management systems to ensure cold-weather performance. The industry's focus is expanding from light-duty electric vans for last-mile delivery to heavy-duty prime movers and Class 8 electric trucks for high-payload logistics.
- This requires sophisticated high-voltage power electronics and purpose-built electric chassis, often built on flexible skateboard platforms. Strategic models like Battery-as-a-Service (BaaS) and Depot Point Operator models are emerging to manage the complexities of smart depot charging, grid-readiness, and geofencing technology for regulatory compliance.
- The integration of fleet telematics transforms vehicles into data hubs, enabling a future of connected and efficient transport, with some fleets reporting a 15% improvement in operational uptime through predictive analytics.
What are the Key Data Covered in this Electric Commercial Vehicle (ECV) Market Research and Growth Report?
-
What is the expected growth of the Electric Commercial Vehicle (ECV) Market between 2026 and 2030?
-
USD 668.89 billion, at a CAGR of 39.8%
-
-
What segmentation does the market report cover?
-
The report is segmented by Product (LCVs, Buses, and Heavy and medium commercial vehicles), Type (Battery electric vehicle (BEV), Plug-in hybrid electric vehicle (PHEV), and Fuel cell electric vehicle (FCEV)), Variant (0 to 150 miles, 151 to 250 miles, 251 to 500 miles, and 500+ miles) and Geography (APAC, North America, Europe, Middle East and Africa, South America)
-
-
Which regions are analyzed in the report?
-
APAC, North America, Europe, Middle East and Africa and South America
-
-
What are the key growth drivers and market challenges?
-
Increase of total cost of ownership parity and industrialization of fleet-scale battery cost reductions, Crisis of charging infrastructure inadequacy and structural limitations of grid readiness
-
-
Who are the major players in the Electric Commercial Vehicle (ECV) Market?
-
AB Volvo, BYD Co. Ltd., Daimler Truck AG, Ford Motor Co., Geely Automobile Holdings Ltd., General Motors Co., Hyundai Motor Co., Jianghuai Automobile Group Co., Kenworth Truck Co., Motor Coach Industries Inc., Nissan Motor Co. Ltd., Olectra Greentech Ltd., Rivian Automotive Inc., Stellantis NV, Tata Motors Ltd., Tesla Inc., Toyota Motor Corp., Traton SE, Volkswagen AG and Xiamen King Long Motor Co. Ltd.
-
Market Research Insights
- Market dynamics are increasingly shaped by the strategic push toward heavy-duty long-haul electrification and the operational complexities of managing large fleets. The adoption of AI-driven energy orchestration is becoming critical, with some systems improving predictive uptime by over 20% by identifying potential cell failures before they occur.
- This shift is validated by market performance, where electric vans achieved a record monthly market share of nearly 14% in key regions, showcasing robust demand. However, challenges in global battery sourcing and a lack of transparent battery degradation data add layers of risk to investment decisions.
- As fleets scale, the focus moves from vehicle acquisition to optimizing asset utilization and managing energy costs, turning depots into grid-integrated hubs. This transition underscores a market maturing beyond hardware to sophisticated, data-driven operational management.
We can help! Our analysts can customize this electric commercial vehicle (ecv) market research report to meet your requirements.
 RIA -
RIA - 
