Electric Coolant Pump For Passenger Cars Market Analysis, Size, and Forecast 2026-2030: APAC (China, Japan, and India), Europe (Germany, UK, and France), North America (US, Canada, and Mexico), South America (Brazil, Argentina, and Colombia), Middle East and Africa (South Africa, UAE, and Saudi Arabia), and Rest of World (ROW)

Electric Coolant Pump For Passenger Cars Market Analysis, Size, and Forecast 2026-2030:
APAC (China, Japan, and India), Europe (Germany, UK, and France), North America (US, Canada, and Mexico), South America (Brazil, Argentina, and Colombia), Middle East and Africa (South Africa, UAE, and Saudi Arabia), and Rest of World (ROW)

Published: Dec 2025 293 Pages SKU: IRTNTR70183

Market Overview at a Glance

$45.20 B
Market Opportunity
23.8%
CAGR 2025 - 2030
49.2%
APAC Growth
$16.10 B
ICE powertrain segment 2024

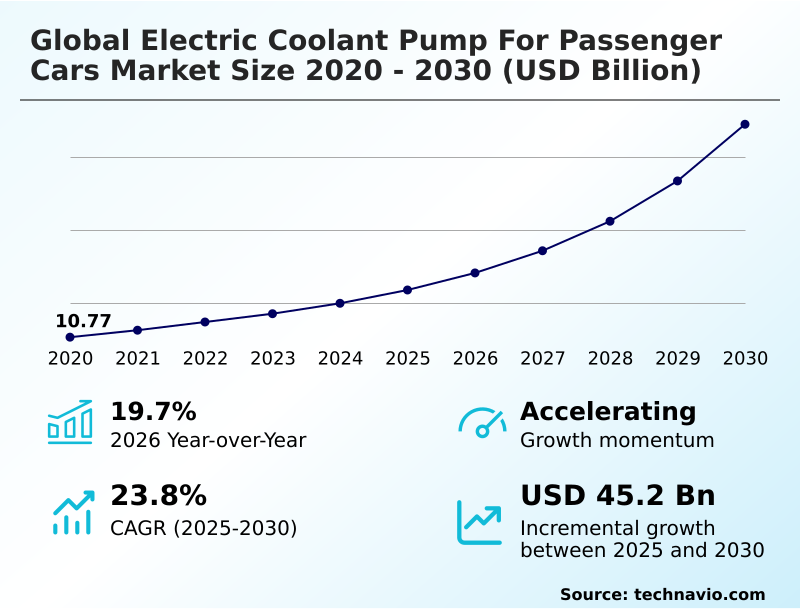
Electric Coolant Pump For Passenger Cars Market Size 2026-2030

The electric coolant pump for passenger cars market size is valued to increase by USD 45.20 billion, at a CAGR of 23.8% from 2025 to 2030. Rapid electrification of mechanical components will drive the electric coolant pump for passenger cars market.

Major Market Trends & Insights

  • APAC dominated the market and accounted for a 49.2% growth during the forecast period.
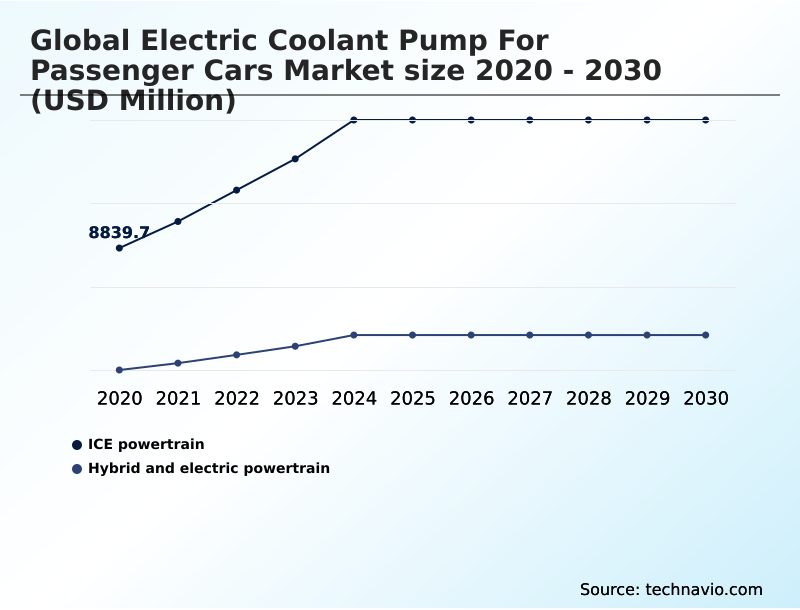
  • By Application - ICE powertrain segment was valued at USD 16.10 billion in 2024
  • By Type - Battery electric vehicle segment accounted for the largest market revenue share in 2024

Market Size & Forecast

  • Market Opportunities: USD 58.07 billion
  • Market Future Opportunities: USD 45.20 billion
  • CAGR from 2025 to 2030 : 23.8%

Market Summary

  • The electric coolant pump for passenger cars market is undergoing a significant transformation, driven by the shift towards electrification and more stringent emissions regulations. These pumps are critical mechatronic devices within a modern vehicle's thermal management system, providing precise on-demand coolant flow to vital areas like the battery, power electronics, and engine.
  • Unlike traditional belt-driven pumps, their independent operation allows for optimized powertrain cooling, leading to improved fuel efficiency and reduced parasitic losses. A key trend is the development of intelligent pumps with CAN bus integration, enabling dynamic control and diagnostics.
  • For instance, in a hybrid vehicle navigating heavy traffic, the system can prioritize high-voltage component cooling even when the engine is off, a scenario impossible with mechanical systems. However, the industry faces challenges related to the higher initial cost and the need for robust designs to prevent recalls.
  • The push for more compact, lightweight, and efficient solutions using advanced materials continues to shape the competitive landscape, as suppliers work to meet the evolving demands of next-generation powertrain architecture.

What will be the Size of the Electric Coolant Pump For Passenger Cars Market during the forecast period?

Get Key Insights on Market Forecast (PDF) Request Free Sample

How is the Electric Coolant Pump For Passenger Cars Market Segmented?

The electric coolant pump for passenger cars industry research report provides comprehensive data (region-wise segment analysis), with forecasts and estimates in "USD million" for the period 2026-2030, as well as historical data from 2020-2024 for the following segments.

  • Application
    • ICE powertrain
    • Hybrid and electric powertrain
  • Type
    • Battery electric vehicle
    • Plug-in hybrid electric vehicle
    • Hybrid electric vehicle
  • Distribution channel
    • OEMs
    • Aftermarket
  • Geography
    • APAC
      • China
      • Japan
      • India
    • Europe
      • Germany
      • UK
      • France
    • North America
      • US
      • Canada
      • Mexico
    • South America
      • Brazil
      • Argentina
      • Colombia
    • Middle East and Africa
      • South Africa
      • UAE
      • Saudi Arabia
    • Rest of World (ROW)

By Application Insights

The ice powertrain segment is estimated to witness significant growth during the forecast period.

The internal combustion engine (ICE) powertrain segment represents a transitional space for electric coolant pump adoption, primarily concentrated in the luxury vehicle category.

Unlike their mechanical counterparts, these advanced electromechanical components offer on-demand coolant flow, decoupling cooling performance from engine speed.

This capability is critical for optimizing engine temperature control and improving real-world driving efficiency, contributing to incremental gains in fuel economy and vehicular emissions reduction.

Although adoption is limited by a higher unit cost, which can be up to 300% greater than conventional pumps, the integration of these systems is a key strategy for automakers to meet stringent emissions control technology mandates.

The focus is on enhancing vehicle performance through precise powertrain cooling without a complete overhaul of the existing powertrain architecture.

Request Free Sample

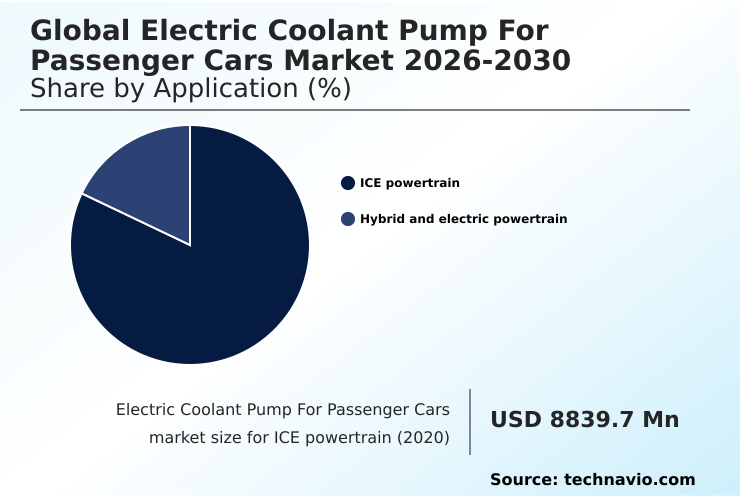
The ICE powertrain segment was valued at USD 16.10 billion in 2024 and showed a gradual increase during the forecast period.

Request Free Sample

Regional Analysis

APAC is estimated to contribute 49.2% to the growth of the global market during the forecast period.Technavio’s analysts have elaborately explained the regional trends and drivers that shape the market during the forecast period.

See How Electric Coolant Pump For Passenger Cars Market Demand is Rising in APAC Request Free Sample

APAC is set to contribute 49% of the market's incremental growth, driven by massive investments in powertrain electrification.

In this region, advanced thermal architecture is evolving rapidly to support high-density batteries, with a focus on compact pump design and robust fluid transport systems for automotive electronics cooling.

In contrast, Europe's growth is propelled by stringent emission reduction technologies, mandating the use of systems that enhance real-world driving efficiency. North America is accelerating with significant investments in connected mobility solutions and domestic supply chains.

The development of advanced driver-assistance systems in all regions also creates new cooling demands, pushing for more sophisticated thermal front end modules and integrated automotive systems to manage multiple heat sources effectively.

Market Dynamics

Our researchers analyzed the data with 2025 as the base year, along with the key drivers, trends, and challenges. A holistic analysis of drivers will help companies refine their marketing strategies to gain a competitive advantage.

  • Navigating the complexities of the global electric coolant pump for passenger cars market requires a deep understanding of evolving vehicle technologies. A primary focus is on the electric coolant pump for BEV battery cooling, a critical function for range and safety, especially with the rise of systems that must support fast charging.
  • The challenges of electric coolant pump system integration are significant, as engineers work to combine the main vs auxiliary electric coolant pump function into cohesive thermal management in advanced hybrid powertrains.
  • The benefits of a variable speed electric coolant pump, such as reducing parasitic loss with electric pumps, are a key driver for adoption, directly improving fuel efficiency with electric water pumps. The aftermarket electric coolant pump replacement cost remains a consideration for long-term ownership.
  • From a technical perspective, the reliability testing for mechatronic coolant pumps is intense, and a brushless dc motor design for automotive pumps is now standard for efficiency. Diagnostics through a CAN bus controlled electric water pump are simplifying maintenance, though the impact of SiC modules on cooling systems introduces new thermal demands.
  • This complexity is evident when comparing thermal designs; a modern BEV may employ up to three distinct cooling loops managed by intelligent pumps, whereas a traditional ICE vehicle uses just one, showcasing a threefold increase in system intricacy that directly impacts supply chain and service strategies.

What are the key market drivers leading to the rise in the adoption of Electric Coolant Pump For Passenger Cars Industry?

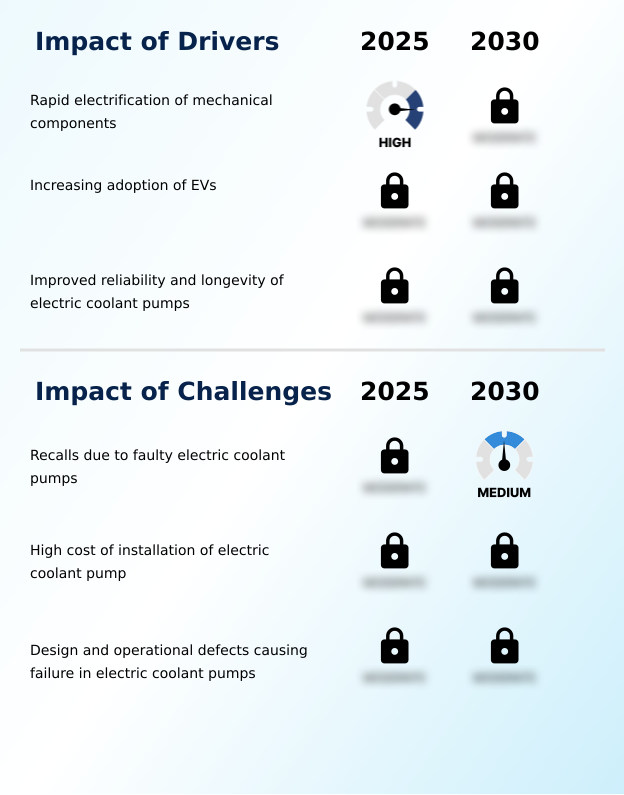
  • The rapid electrification of mechanical components is a primary driver for the market, as automakers replace conventional parts with more efficient and controllable electronic systems.

  • The rapid pace of powertrain electrification is the principal driver, compelling a shift to advanced thermal management. As automakers integrate more powerful electronics and pursue greater vehicle efficiency gains, the need for precise high-voltage component cooling becomes non-negotiable.
  • Technologies like the silicon carbide power module are increasing thermal density management requirements, necessitating dedicated liquid cooling circuits. This move toward on-demand component operation, managed through electronic control unit integration, can improve system efficiency by up to 20%.
  • The adoption of brushless DC motor designs with variable speed operation further supports these efficiency goals, making electric pumps essential for battery temperature regulation and achieving broader sustainable energy alternatives.
  • The goal is a 10% reduction in parasitic losses compared to mechanical systems.

What are the market trends shaping the Electric Coolant Pump For Passenger Cars Industry?

  • Improvements in automotive electric pump systems, including advanced designs and materials, represent a significant market trend. This evolution is enhancing vehicle performance and efficiency.

  • A primary trend is the rising integration of electric pumps with comprehensive thermal management systems to achieve greater thermal management optimization. Automakers are shifting toward a holistic vehicle thermal architecture that incorporates integrated heat exchangers and advanced coolant formulations to improve efficient heat transfer by over 15%.
  • This automotive system development involves using intelligent pump features with LIN bus communication for precise control. Innovations also focus on lightweight component design, with some new pumps achieving a weight reduction of 30% through the use of advanced composites.
  • These improvements in hybrid vehicle cooling solutions and next-generation powertrain designs are critical for enhancing thermal stability solutions and overall EV thermal efficiency, enabling more compact and powerful vehicle platforms.

What challenges does the Electric Coolant Pump For Passenger Cars Industry face during its growth?

  • Vehicle recalls stemming from faulty electric coolant pumps present a significant challenge, impacting manufacturer costs, brand reputation, and consumer confidence in the technology.

  • A significant market challenge involves recalls due to design defects in the mechatronic device, which can increase warranty claim costs by over 40%. Failures linked to inadequate sealing compromise vehicle operational safety and demand stringent automotive-grade production standards for thermal event prevention.
  • The complexity of CAN bus integration also presents hurdles for the independent repair sector, where accurate diagnosis often requires specific diagnostic equipment updates. Furthermore, the high cost of automotive aftermarket parts for these systems can deter timely replacements.
  • Ensuring the reliability of redundant cooling circuits and the chemical resistance of materials without escalating costs remains a key engineering obstacle, vital for maintaining consumer trust and system longevity.

Exclusive Technavio Analysis on Customer Landscape

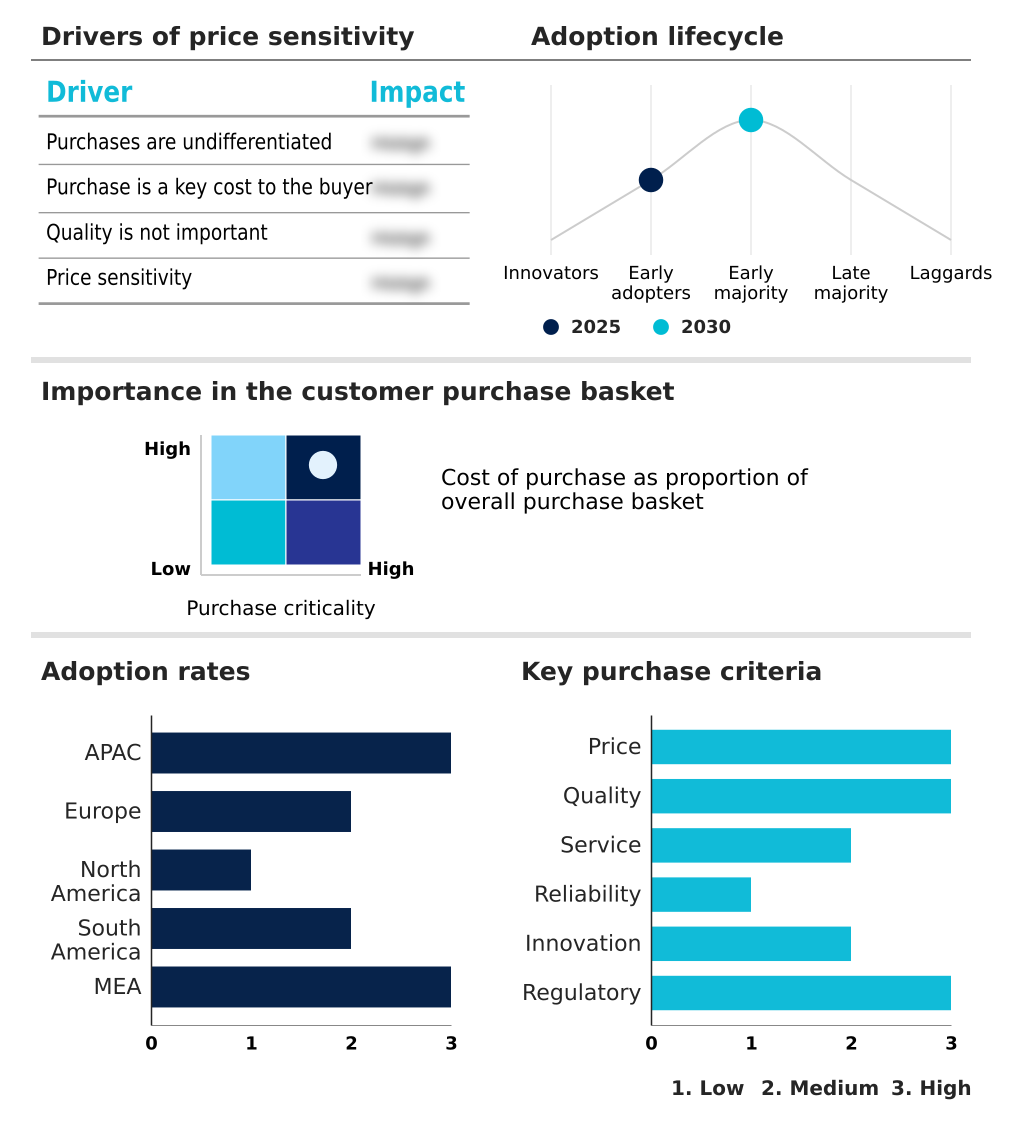
The electric coolant pump for passenger cars market forecasting report includes the adoption lifecycle of the market, covering from the innovator’s stage to the laggard’s stage. It focuses on adoption rates in different regions based on penetration. Furthermore, the electric coolant pump for passenger cars market report also includes key purchase criteria and drivers of price sensitivity to help companies evaluate and develop their market growth analysis strategies.

Customer Landscape of Electric Coolant Pump For Passenger Cars Industry

Competitive Landscape

Companies are implementing various strategies, such as strategic alliances, electric coolant pump for passenger cars market forecast, partnerships, mergers and acquisitions, geographical expansion, and product/service launches, to enhance their presence in the industry.

AISIN Corp. - Key offerings feature advanced thermal management systems, including intelligent electric coolant pumps designed for enhanced vehicle performance, efficiency gains, and powertrain component reliability across diverse automotive platforms.

The industry research and growth report includes detailed analyses of the competitive landscape of the market and information about key companies, including:

  • AISIN Corp.
  • Buhler Motor GmbH
  • Continental AG
  • Davies Craig Pty Ltd.
  • Gates Corp.
  • GMB CORP.
  • Hanon Systems
  • Johnson Electric Holdings Ltd.
  • MAHLE GmbH
  • Mikuni Corp.
  • Nidec Corp.
  • Rheinmetall AG
  • Robert Bosch GmbH
  • Sanhua Holding Group Co. Ltd.
  • Schaeffler AG
  • Sogefi Spa
  • TI Fluid Systems Plc
  • Valeo SA
  • VOVYO TECHNOLOGY Co. Ltd.

Qualitative and quantitative analysis of companies has been conducted to help clients understand the wider business environment as well as the strengths and weaknesses of key industry players. Data is qualitatively analyzed to categorize companies as pure play, category-focused, industry-focused, and diversified; it is quantitatively analyzed to categorize companies as dominant, leading, strong, tentative, and weak.

Recent Development and News in Electric coolant pump for passenger cars market

  • In August 2024, BMW initiated a recall for approximately 720,000 vehicles due to a fault where water ingress into the electric coolant pump's connector could cause short-circuiting and increase fire risk.
  • In November 2024, Gates Corp. launched its next-generation electric water pump technology, featuring a more compact design optimized for hybrid and battery electric vehicle thermal management systems.
  • In December 2024, the government of India launched a new Production Linked Incentive (PLI) scheme for the auto sector, specifically targeting domestic manufacturing of critical EV components, including electric pumps.
  • In March 2025, MAHLE GmbH introduced a new line of smart electric coolant pumps with integrated sensor technology and a proprietary brushless DC motor, reducing weight and improving operational efficiency.

Dive into Technavio’s robust research methodology, blending expert interviews, extensive data synthesis, and validated models for unparalleled Electric Coolant Pump For Passenger Cars Market insights. See full methodology.

Market Scope
Page number 293
Base year 2025
Historic period 2020-2024
Forecast period 2026-2030
Growth momentum & CAGR Accelerate at a CAGR of 23.8%
Market growth 2026-2030 USD 45195.7 million
Market structure Fragmented
YoY growth 2025-2026(%) 19.7%
Key countries China, Japan, India, South Korea, Australia, Indonesia, Germany, UK, France, Italy, Spain, The Netherlands, US, Canada, Mexico, Brazil, Argentina, Colombia, South Africa, UAE, Saudi Arabia, Israel and Turkey
Competitive landscape Leading Companies, Market Positioning of Companies, Competitive Strategies, and Industry Risks

Request Free Sample

Research Analyst Overview

  • The market is fundamentally reshaping vehicle powertrain architecture. At its core, the electric coolant pump is a critical mechatronic device, enabling on-demand coolant flow essential for battery thermal management and high-voltage component cooling. Unlike legacy systems, the variable speed operation of a brushless DC motor allows for a significant reduction in parasitic losses, directly improving vehicle efficiency.
  • The integration of these pumps into a broader thermal management system, often via CAN bus or LIN bus communication, is now standard. This shift supports advanced thermal architecture required for next-generation vehicles. Intelligent pump features, managed through electronic control unit integration, provide precise coolant flow regulation and enhance powertrain component reliability.
  • For example, using lightweight pump materials in a compact pump design has been shown to reduce component weight by up to 30%, a critical factor in extending electric vehicle range. The industry's focus is on managing increased thermal density and improving heat transfer efficiency while ensuring the reliability of these complex systems.

What are the Key Data Covered in this Electric Coolant Pump For Passenger Cars Market Research and Growth Report?

  • What is the expected growth of the Electric Coolant Pump For Passenger Cars Market between 2026 and 2030?

    • USD 45.20 billion, at a CAGR of 23.8%

  • What segmentation does the market report cover?

    • The report is segmented by Application (ICE powertrain, and Hybrid and electric powertrain), Type (Battery electric vehicle, Plug-in hybrid electric vehicle, and Hybrid electric vehicle), Distribution Channel (OEMs, and Aftermarket) and Geography (APAC, Europe, North America, South America, Middle East and Africa)

  • Which regions are analyzed in the report?

    • APAC, Europe, North America, South America and Middle East and Africa

  • What are the key growth drivers and market challenges?

    • Rapid electrification of mechanical components, Recalls due to faulty electric coolant pumps

  • Who are the major players in the Electric Coolant Pump For Passenger Cars Market?

    • AISIN Corp., Buhler Motor GmbH, Continental AG, Davies Craig Pty Ltd., Gates Corp., GMB CORP., Hanon Systems, Johnson Electric Holdings Ltd., MAHLE GmbH, Mikuni Corp., Nidec Corp., Rheinmetall AG, Robert Bosch GmbH, Sanhua Holding Group Co. Ltd., Schaeffler AG, Sogefi Spa, TI Fluid Systems Plc, Valeo SA and VOVYO TECHNOLOGY Co. Ltd.

Market Research Insights

  • The market's momentum is driven by the imperative for enhanced EV thermal efficiency and the adoption of sophisticated hybrid vehicle cooling solutions. The move towards advanced thermal management is delivering measurable outcomes, with some integrated systems reducing energy consumption by 15% compared to legacy designs.
  • Intelligent pump control, a key element of this shift, contributes to a 10% improvement in battery temperature regulation under dynamic load conditions. This optimization of automotive electronics cooling is critical as automakers pursue greater powertrain component reliability.
  • The ongoing refinement of these technologies is not just about performance but also about enabling new vehicle capabilities and meeting increasingly stringent environmental mandates across global markets.

We can help! Our analysts can customize this electric coolant pump for passenger cars market research report to meet your requirements.

Get in touch

1. Executive Summary

1.1 Market overview

Executive Summary - Chart on Market Overview
Executive Summary - Data Table on Market Overview
Executive Summary - Chart on Global Market Characteristics
Executive Summary - Chart on Market by Geography
Executive Summary - Chart on Market Segmentation by Application
Executive Summary - Chart on Market Segmentation by Type
Executive Summary - Chart on Market Segmentation by Distribution Channel
Executive Summary - Chart on Incremental Growth
Executive Summary - Data Table on Incremental Growth
Executive Summary - Chart on Company Market Positioning

2. Technavio Analysis

2.1 Analysis of price sensitivity, lifecycle, customer purchase basket, adoption rates, and purchase criteria

2.2 Criticality of inputs and Factors of differentiation

Chart on Overview on criticality of inputs and factors of differentiation

2.3 Factors of disruption

Chart on Overview on factors of disruption

2.4 Impact of drivers and challenges

Chart on Impact of drivers and challenges in 2025 and 2030

3. Market Landscape

3.1 Market ecosystem

Chart on Parent Market
Data Table on - Parent Market

3.2 Market characteristics

Chart on Market characteristics analysis

3.3 Value chain analysis

Chart on Value chain analysis

4. Market Sizing

4.1 Market definition

Data Table on Offerings of companies included in the market definition

4.2 Market segment analysis

Market segments

4.3 Market size 2025

4.4 Market outlook: Forecast for 2025-2030

Chart on Global - Market size and forecast 2025-2030 ($ million)
Data Table on Global - Market size and forecast 2025-2030 ($ million)
Chart on Global Market: Year-over-year growth 2025-2030 (%)
Data Table on Global Market: Year-over-year growth 2025-2030 (%)

5. Historic Market Size

5.1 Global Electric Coolant Pump For Passenger Cars Market 2020 - 2024

Historic Market Size - Data Table on Global Electric Coolant Pump For Passenger Cars Market 2020 - 2024 ($ million)

5.2 Application segment analysis 2020 - 2024

Historic Market Size - Application Segment 2020 - 2024 ($ million)

5.3 Type segment analysis 2020 - 2024

Historic Market Size - Type Segment 2020 - 2024 ($ million)

5.4 Distribution Channel segment analysis 2020 - 2024

Historic Market Size - Distribution Channel Segment 2020 - 2024 ($ million)

5.5 Geography segment analysis 2020 - 2024

Historic Market Size - Geography Segment 2020 - 2024 ($ million)

5.6 Country segment analysis 2020 - 2024

Historic Market Size - Country Segment 2020 - 2024 ($ million)

6. Qualitative Analysis

6.1 The AI impact on Global Electric Coolant Pump for Passenger Cars Market

7. Five Forces Analysis

7.1 Five forces summary

Five forces analysis - Comparison between 2025 and 2030

7.2 Bargaining power of buyers

Bargaining power of buyers - Impact of key factors 2025 and 2030

7.3 Bargaining power of suppliers

Bargaining power of suppliers - Impact of key factors in 2025 and 2030

7.4 Threat of new entrants

Threat of new entrants - Impact of key factors in 2025 and 2030

7.5 Threat of substitutes

Threat of substitutes - Impact of key factors in 2025 and 2030

7.6 Threat of rivalry

Threat of rivalry - Impact of key factors in 2025 and 2030

7.7 Market condition

Chart on Market condition - Five forces 2025 and 2030

8. Market Segmentation by Application

8.1 Market segments

Chart on Application - Market share 2025-2030 (%)
Data Table on Application - Market share 2025-2030 (%)

8.2 Comparison by Application

Chart on Comparison by Application
Data Table on Comparison by Application

8.3 ICE powertrain - Market size and forecast 2025-2030

Chart on ICE powertrain - Market size and forecast 2025-2030 ($ million)
Data Table on ICE powertrain - Market size and forecast 2025-2030 ($ million)
Chart on ICE powertrain - Year-over-year growth 2025-2030 (%)
Data Table on ICE powertrain - Year-over-year growth 2025-2030 (%)

8.4 Hybrid and electric powertrain - Market size and forecast 2025-2030

Chart on Hybrid and electric powertrain - Market size and forecast 2025-2030 ($ million)
Data Table on Hybrid and electric powertrain - Market size and forecast 2025-2030 ($ million)
Chart on Hybrid and electric powertrain - Year-over-year growth 2025-2030 (%)
Data Table on Hybrid and electric powertrain - Year-over-year growth 2025-2030 (%)

8.5 Market opportunity by Application

Market opportunity by Application ($ million)
Data Table on Market opportunity by Application ($ million)

9. Market Segmentation by Type

9.1 Market segments

Chart on Type - Market share 2025-2030 (%)
Data Table on Type - Market share 2025-2030 (%)

9.2 Comparison by Type

Chart on Comparison by Type
Data Table on Comparison by Type

9.3 Battery electric vehicle - Market size and forecast 2025-2030

Chart on Battery electric vehicle - Market size and forecast 2025-2030 ($ million)
Data Table on Battery electric vehicle - Market size and forecast 2025-2030 ($ million)
Chart on Battery electric vehicle - Year-over-year growth 2025-2030 (%)
Data Table on Battery electric vehicle - Year-over-year growth 2025-2030 (%)

9.4 Plug-in hybrid electric vehicle - Market size and forecast 2025-2030

Chart on Plug-in hybrid electric vehicle - Market size and forecast 2025-2030 ($ million)
Data Table on Plug-in hybrid electric vehicle - Market size and forecast 2025-2030 ($ million)
Chart on Plug-in hybrid electric vehicle - Year-over-year growth 2025-2030 (%)
Data Table on Plug-in hybrid electric vehicle - Year-over-year growth 2025-2030 (%)

9.5 Hybrid electric vehicle - Market size and forecast 2025-2030

Chart on Hybrid electric vehicle - Market size and forecast 2025-2030 ($ million)
Data Table on Hybrid electric vehicle - Market size and forecast 2025-2030 ($ million)
Chart on Hybrid electric vehicle - Year-over-year growth 2025-2030 (%)
Data Table on Hybrid electric vehicle - Year-over-year growth 2025-2030 (%)

9.6 Market opportunity by Type

Market opportunity by Type ($ million)
Data Table on Market opportunity by Type ($ million)

10. Market Segmentation by Distribution Channel

10.1 Market segments

Chart on Distribution Channel - Market share 2025-2030 (%)
Data Table on Distribution Channel - Market share 2025-2030 (%)

10.2 Comparison by Distribution Channel

Chart on Comparison by Distribution Channel
Data Table on Comparison by Distribution Channel

10.3 OEMs - Market size and forecast 2025-2030

Chart on OEMs - Market size and forecast 2025-2030 ($ million)
Data Table on OEMs - Market size and forecast 2025-2030 ($ million)
Chart on OEMs - Year-over-year growth 2025-2030 (%)
Data Table on OEMs - Year-over-year growth 2025-2030 (%)

10.4 Aftermarket - Market size and forecast 2025-2030

Chart on Aftermarket - Market size and forecast 2025-2030 ($ million)
Data Table on Aftermarket - Market size and forecast 2025-2030 ($ million)
Chart on Aftermarket - Year-over-year growth 2025-2030 (%)
Data Table on Aftermarket - Year-over-year growth 2025-2030 (%)

10.5 Market opportunity by Distribution Channel

Market opportunity by Distribution Channel ($ million)
Data Table on Market opportunity by Distribution Channel ($ million)

11. Customer Landscape

11.1 Customer landscape overview

Analysis of price sensitivity, lifecycle, customer purchase basket, adoption rates, and purchase criteria

12. Geographic Landscape

12.1 Geographic segmentation

Chart on Market share by geography 2025-2030 (%)
Data Table on Market share by geography 2025-2030 (%)

12.2 Geographic comparison

Chart on Geographic comparison
Data Table on Geographic comparison

12.3 APAC - Market size and forecast 2025-2030

Chart on APAC - Market size and forecast 2025-2030 ($ million)
Data Table on APAC - Market size and forecast 2025-2030 ($ million)
Chart on APAC - Year-over-year growth 2025-2030 (%)
Data Table on APAC - Year-over-year growth 2025-2030 (%)
Chart on Regional Comparison - APAC
Data Table on Regional Comparison - APAC

12.3.1 China - Market size and forecast 2025-2030

Chart on China - Market size and forecast 2025-2030 ($ million)
Data Table on China - Market size and forecast 2025-2030 ($ million)
Chart on China - Year-over-year growth 2025-2030 (%)
Data Table on China - Year-over-year growth 2025-2030 (%)

12.3.2 Japan - Market size and forecast 2025-2030

Chart on Japan - Market size and forecast 2025-2030 ($ million)
Data Table on Japan - Market size and forecast 2025-2030 ($ million)
Chart on Japan - Year-over-year growth 2025-2030 (%)
Data Table on Japan - Year-over-year growth 2025-2030 (%)

12.3.3 India - Market size and forecast 2025-2030

Chart on India - Market size and forecast 2025-2030 ($ million)
Data Table on India - Market size and forecast 2025-2030 ($ million)
Chart on India - Year-over-year growth 2025-2030 (%)
Data Table on India - Year-over-year growth 2025-2030 (%)

12.3.4 South Korea - Market size and forecast 2025-2030

Chart on South Korea - Market size and forecast 2025-2030 ($ million)
Data Table on South Korea - Market size and forecast 2025-2030 ($ million)
Chart on South Korea - Year-over-year growth 2025-2030 (%)
Data Table on South Korea - Year-over-year growth 2025-2030 (%)

12.3.5 Australia - Market size and forecast 2025-2030

Chart on Australia - Market size and forecast 2025-2030 ($ million)
Data Table on Australia - Market size and forecast 2025-2030 ($ million)
Chart on Australia - Year-over-year growth 2025-2030 (%)
Data Table on Australia - Year-over-year growth 2025-2030 (%)

12.3.6 Indonesia - Market size and forecast 2025-2030

Chart on Indonesia - Market size and forecast 2025-2030 ($ million)
Data Table on Indonesia - Market size and forecast 2025-2030 ($ million)
Chart on Indonesia - Year-over-year growth 2025-2030 (%)
Data Table on Indonesia - Year-over-year growth 2025-2030 (%)

12.4 Europe - Market size and forecast 2025-2030

Chart on Europe - Market size and forecast 2025-2030 ($ million)
Data Table on Europe - Market size and forecast 2025-2030 ($ million)
Chart on Europe - Year-over-year growth 2025-2030 (%)
Data Table on Europe - Year-over-year growth 2025-2030 (%)
Chart on Regional Comparison - Europe
Data Table on Regional Comparison - Europe

12.4.1 Germany - Market size and forecast 2025-2030

Chart on Germany - Market size and forecast 2025-2030 ($ million)
Data Table on Germany - Market size and forecast 2025-2030 ($ million)
Chart on Germany - Year-over-year growth 2025-2030 (%)
Data Table on Germany - Year-over-year growth 2025-2030 (%)

12.4.2 UK - Market size and forecast 2025-2030

Chart on UK - Market size and forecast 2025-2030 ($ million)
Data Table on UK - Market size and forecast 2025-2030 ($ million)
Chart on UK - Year-over-year growth 2025-2030 (%)
Data Table on UK - Year-over-year growth 2025-2030 (%)

12.4.3 France - Market size and forecast 2025-2030

Chart on France - Market size and forecast 2025-2030 ($ million)
Data Table on France - Market size and forecast 2025-2030 ($ million)
Chart on France - Year-over-year growth 2025-2030 (%)
Data Table on France - Year-over-year growth 2025-2030 (%)

12.4.4 Italy - Market size and forecast 2025-2030

Chart on Italy - Market size and forecast 2025-2030 ($ million)
Data Table on Italy - Market size and forecast 2025-2030 ($ million)
Chart on Italy - Year-over-year growth 2025-2030 (%)
Data Table on Italy - Year-over-year growth 2025-2030 (%)

12.4.5 Spain - Market size and forecast 2025-2030

Chart on Spain - Market size and forecast 2025-2030 ($ million)
Data Table on Spain - Market size and forecast 2025-2030 ($ million)
Chart on Spain - Year-over-year growth 2025-2030 (%)
Data Table on Spain - Year-over-year growth 2025-2030 (%)

12.4.6 The Netherlands - Market size and forecast 2025-2030

Chart on The Netherlands - Market size and forecast 2025-2030 ($ million)
Data Table on The Netherlands - Market size and forecast 2025-2030 ($ million)
Chart on The Netherlands - Year-over-year growth 2025-2030 (%)
Data Table on The Netherlands - Year-over-year growth 2025-2030 (%)

12.5 North America - Market size and forecast 2025-2030

Chart on North America - Market size and forecast 2025-2030 ($ million)
Data Table on North America - Market size and forecast 2025-2030 ($ million)
Chart on North America - Year-over-year growth 2025-2030 (%)
Data Table on North America - Year-over-year growth 2025-2030 (%)
Chart on Regional Comparison - North America
Data Table on Regional Comparison - North America

12.5.1 US - Market size and forecast 2025-2030

Chart on US - Market size and forecast 2025-2030 ($ million)
Data Table on US - Market size and forecast 2025-2030 ($ million)
Chart on US - Year-over-year growth 2025-2030 (%)
Data Table on US - Year-over-year growth 2025-2030 (%)

12.5.2 Canada - Market size and forecast 2025-2030

Chart on Canada - Market size and forecast 2025-2030 ($ million)
Data Table on Canada - Market size and forecast 2025-2030 ($ million)
Chart on Canada - Year-over-year growth 2025-2030 (%)
Data Table on Canada - Year-over-year growth 2025-2030 (%)

12.5.3 Mexico - Market size and forecast 2025-2030

Chart on Mexico - Market size and forecast 2025-2030 ($ million)
Data Table on Mexico - Market size and forecast 2025-2030 ($ million)
Chart on Mexico - Year-over-year growth 2025-2030 (%)
Data Table on Mexico - Year-over-year growth 2025-2030 (%)

12.6 South America - Market size and forecast 2025-2030

Chart on South America - Market size and forecast 2025-2030 ($ million)
Data Table on South America - Market size and forecast 2025-2030 ($ million)
Chart on South America - Year-over-year growth 2025-2030 (%)
Data Table on South America - Year-over-year growth 2025-2030 (%)
Chart on Regional Comparison - South America
Data Table on Regional Comparison - South America

12.6.1 Brazil - Market size and forecast 2025-2030

Chart on Brazil - Market size and forecast 2025-2030 ($ million)
Data Table on Brazil - Market size and forecast 2025-2030 ($ million)
Chart on Brazil - Year-over-year growth 2025-2030 (%)
Data Table on Brazil - Year-over-year growth 2025-2030 (%)

12.6.2 Argentina - Market size and forecast 2025-2030

Chart on Argentina - Market size and forecast 2025-2030 ($ million)
Data Table on Argentina - Market size and forecast 2025-2030 ($ million)
Chart on Argentina - Year-over-year growth 2025-2030 (%)
Data Table on Argentina - Year-over-year growth 2025-2030 (%)

12.6.3 Colombia - Market size and forecast 2025-2030

Chart on Colombia - Market size and forecast 2025-2030 ($ million)
Data Table on Colombia - Market size and forecast 2025-2030 ($ million)
Chart on Colombia - Year-over-year growth 2025-2030 (%)
Data Table on Colombia - Year-over-year growth 2025-2030 (%)

12.7 Middle East and Africa - Market size and forecast 2025-2030

Chart on Middle East and Africa - Market size and forecast 2025-2030 ($ million)
Data Table on Middle East and Africa - Market size and forecast 2025-2030 ($ million)
Chart on Middle East and Africa - Year-over-year growth 2025-2030 (%)
Data Table on Middle East and Africa - Year-over-year growth 2025-2030 (%)
Chart on Regional Comparison - Middle East and Africa
Data Table on Regional Comparison - Middle East and Africa

12.7.1 South Africa - Market size and forecast 2025-2030

Chart on South Africa - Market size and forecast 2025-2030 ($ million)
Data Table on South Africa - Market size and forecast 2025-2030 ($ million)
Chart on South Africa - Year-over-year growth 2025-2030 (%)
Data Table on South Africa - Year-over-year growth 2025-2030 (%)

12.7.2 UAE - Market size and forecast 2025-2030

Chart on UAE - Market size and forecast 2025-2030 ($ million)
Data Table on UAE - Market size and forecast 2025-2030 ($ million)
Chart on UAE - Year-over-year growth 2025-2030 (%)
Data Table on UAE - Year-over-year growth 2025-2030 (%)

12.7.3 Saudi Arabia - Market size and forecast 2025-2030

Chart on Saudi Arabia - Market size and forecast 2025-2030 ($ million)
Data Table on Saudi Arabia - Market size and forecast 2025-2030 ($ million)
Chart on Saudi Arabia - Year-over-year growth 2025-2030 (%)
Data Table on Saudi Arabia - Year-over-year growth 2025-2030 (%)

12.7.4 Israel - Market size and forecast 2025-2030

Chart on Israel - Market size and forecast 2025-2030 ($ million)
Data Table on Israel - Market size and forecast 2025-2030 ($ million)
Chart on Israel - Year-over-year growth 2025-2030 (%)
Data Table on Israel - Year-over-year growth 2025-2030 (%)

12.7.5 Turkey - Market size and forecast 2025-2030

Chart on Turkey - Market size and forecast 2025-2030 ($ million)
Data Table on Turkey - Market size and forecast 2025-2030 ($ million)
Chart on Turkey - Year-over-year growth 2025-2030 (%)
Data Table on Turkey - Year-over-year growth 2025-2030 (%)

12.8 Market opportunity by geography

Market opportunity by geography ($ million)
Data Tables on Market opportunity by geography ($ million)

13. Drivers, Challenges, and Opportunity

13.1 Market drivers

Rapid electrification of mechanical components
Increasing adoption of EVs
Improved reliability and longevity of electric coolant pumps

13.2 Market challenges

Recalls due to faulty electric coolant pumps
High cost of installation of electric coolant pump
Design and operational defects causing failure in electric coolant pumps

13.3 Impact of drivers and challenges

Impact of drivers and challenges in 2025 and 2030

13.4 Market opportunities

Improvements in automotive electric pump system
Rising integration with thermal management systems
Use of advanced materials for automotive pumps

14. Competitive Landscape

14.1 Overview

14.2

Overview on criticality of inputs and factors of differentiation

14.3 Landscape disruption

Overview on factors of disruption

14.4 Industry risks

Impact of key risks on business

15. Competitive Analysis

15.1 Companies profiled

Companies covered

15.2 Company ranking index

15.3 Market positioning of companies

Matrix on companies position and classification

15.4 AISIN Corp.

AISIN Corp. - Overview
AISIN Corp. - Business segments
AISIN Corp. - Key news
AISIN Corp. - Key offerings
AISIN Corp. - Segment focus
SWOT

15.5 Buhler Motor GmbH

Buhler Motor GmbH - Overview
Buhler Motor GmbH - Product / Service
Buhler Motor GmbH - Key offerings
SWOT

15.6 Continental AG

Continental AG - Overview
Continental AG - Business segments
Continental AG - Key news
Continental AG - Key offerings
Continental AG - Segment focus
SWOT

15.7 Gates Corp.

Gates Corp. - Overview
Gates Corp. - Business segments
Gates Corp. - Key offerings
Gates Corp. - Segment focus
SWOT

15.8 GMB CORP.

GMB CORP. - Overview
GMB CORP. - Product / Service
GMB CORP. - Key offerings
SWOT

15.9 Hanon Systems

Hanon Systems - Overview
Hanon Systems - Business segments
Hanon Systems - Key news
Hanon Systems - Key offerings
Hanon Systems - Segment focus
SWOT

15.10 Johnson Electric Holdings Ltd.

Johnson Electric Holdings Ltd. - Overview
Johnson Electric Holdings Ltd. - Business segments
Johnson Electric Holdings Ltd. - Key news
Johnson Electric Holdings Ltd. - Key offerings
Johnson Electric Holdings Ltd. - Segment focus
SWOT

15.11 MAHLE GmbH

MAHLE GmbH - Overview
MAHLE GmbH - Business segments
MAHLE GmbH - Key news
MAHLE GmbH - Key offerings
MAHLE GmbH - Segment focus
SWOT

15.12 Mikuni Corp.

Mikuni Corp. - Overview
Mikuni Corp. - Business segments
Mikuni Corp. - Key offerings
Mikuni Corp. - Segment focus
SWOT

15.13 Nidec Corp.

Nidec Corp. - Overview
Nidec Corp. - Business segments
Nidec Corp. - Key offerings
Nidec Corp. - Segment focus
SWOT

15.14 Rheinmetall AG

Rheinmetall AG - Overview
Rheinmetall AG - Business segments
Rheinmetall AG - Key offerings
Rheinmetall AG - Segment focus
SWOT

15.15 Robert Bosch GmbH

Robert Bosch GmbH - Overview
Robert Bosch GmbH - Product / Service
Robert Bosch GmbH - Key news
Robert Bosch GmbH - Key offerings
SWOT

15.16 Sogefi Spa

Sogefi Spa - Overview
Sogefi Spa - Business segments
Sogefi Spa - Key offerings
Sogefi Spa - Segment focus
SWOT

15.17 TI Fluid Systems Plc

TI Fluid Systems Plc - Overview
TI Fluid Systems Plc - Business segments
TI Fluid Systems Plc - Key offerings
TI Fluid Systems Plc - Segment focus
SWOT

15.18 Valeo SA

Valeo SA - Overview
Valeo SA - Business segments
Valeo SA - Key news
Valeo SA - Key offerings
Valeo SA - Segment focus
SWOT

16. Appendix

16.1 Scope of the report

Market definition
Objectives
Notes and caveats

16.2 Inclusions and exclusions checklist

Inclusions checklist
Exclusions checklist

16.3 Currency conversion rates for US$

16.4 Research methodology

16.5 Data procurement

Information sources

16.6 Data validation

16.7 Validation techniques employed for market sizing

16.8 Data synthesis

16.9 360 degree market analysis

16.10 List of abbreviations

Research Methodology

Technavio presents a detailed picture of the market by way of study, synthesis, and summation of data from multiple sources. The analysts have presented the various facets of the market with a particular focus on identifying the key industry influencers. The data thus presented is comprehensive, reliable, and the result of extensive research, both primary and secondary.

INFORMATION SOURCES

Primary sources

  • Manufacturers and suppliers
  • Channel partners
  • Industry experts
  • Strategic decision makers

Secondary sources

  • Industry journals and periodicals
  • Government data
  • Financial reports of key industry players
  • Historical data
  • Press releases

DATA ANALYSIS

Data Synthesis

  • Collation of data
  • Estimation of key figures
  • Analysis of derived insights

Data Validation

  • Triangulation with data models
  • Reference against proprietary databases
  • Corroboration with industry experts

REPORT WRITING

Qualitative

  • Market drivers
  • Market challenges
  • Market trends
  • Five forces analysis

Quantitative

  • Market size and forecast
  • Market segmentation
  • Geographical insights
  • Competitive landscape

Interested in this report?

Get your sample now to see our research methodology and insights!

Download Now

Frequently Asked Questions

Electric Coolant Pump For Passenger Cars market growth will increase by USD 45195.7 million during 2026-2030 .

The Electric Coolant Pump For Passenger Cars market is expected to grow at a CAGR of 23.8% during 2026-2030 .

Electric Coolant Pump For Passenger Cars market is segmented by Application (ICE powertrain, Hybrid and electric powertrain) Type (Battery electric vehicle, Plug-in hybrid electric vehicle, Hybrid electric vehicle) Distribution channel (OEMs, Aftermarket)

AISIN Corp., Buhler Motor GmbH, Continental AG, Davies Craig Pty Ltd., Gates Corp., GMB CORP., Hanon Systems, Johnson Electric Holdings Ltd., MAHLE GmbH, Mikuni Corp., Nidec Corp., Rheinmetall AG, Robert Bosch GmbH, Sanhua Holding Group Co. Ltd., Schaeffler AG, Sogefi Spa, TI Fluid Systems Plc, Valeo SA, VOVYO TECHNOLOGY Co. Ltd. are a few of the key vendors in the Electric Coolant Pump For Passenger Cars market.

APAC will register the highest growth rate of 49.2% among the other regions. Therefore, the Electric Coolant Pump For Passenger Cars market in APAC is expected to garner significant business opportunities for the vendors during the forecast period.

China, Japan, India, South Korea, Australia, Indonesia, Germany, UK, France, Italy, Spain, The Netherlands, US, Canada, Mexico, Brazil, Argentina, Colombia, South Africa, UAE, Saudi Arabia, Israel, Turkey

  • Rapid electrification of mechanical components is the driving factor this market.

The Electric Coolant Pump For Passenger Cars market vendors should focus on grabbing business opportunities from the Application segment as it accounted for the largest market share in the base year.