Electric Vehicle Charger Market Analysis, Size, and Forecast 2026-2030: APAC (China, Japan, and India), North America (US, Canada, and Mexico), Europe (Germany, UK, and France), South America (Brazil, Argentina, and Colombia), Middle East and Africa (Saudi Arabia, UAE, and South Africa), and Rest of World (ROW)

Electric Vehicle Charger Market Analysis, Size, and Forecast 2026-2030:
APAC (China, Japan, and India), North America (US, Canada, and Mexico), Europe (Germany, UK, and France), South America (Brazil, Argentina, and Colombia), Middle East and Africa (Saudi Arabia, UAE, and South Africa), and Rest of World (ROW)

Published: May 2026 291 Pages SKU: IRTNTR44786

Market Overview at a Glance

$82.90 B
Market Opportunity
36.2%
CAGR 2025 - 2030
44.7%
APAC Growth
$14.96 B
Residential segment 2024

Electric Vehicle Charger Market Size 2026-2030

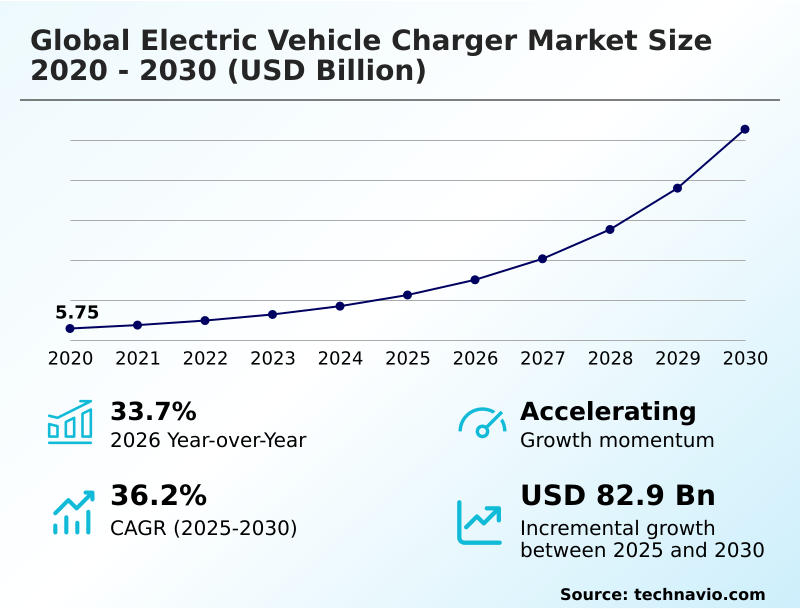
The Electric Vehicle Charger Market size was valued at USD 22.50 billion in 2025, growing at a CAGR of 36.2% during the forecast period 2026-2030.

Major Market Trends & Insights

  • APAC dominated the market and accounted for a 44.7% growth during the forecast period.
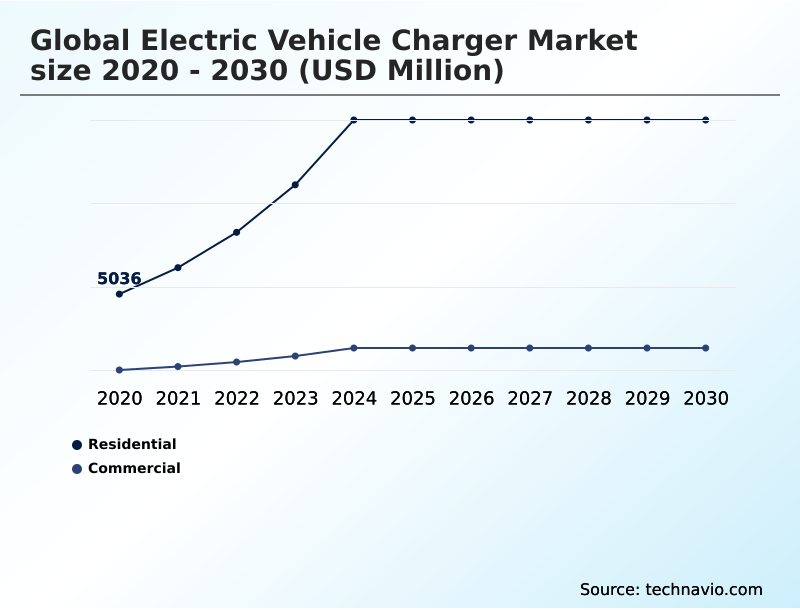
  • By End-user - Residential segment was valued at USD 14.96 billion in 2024
  • By Type - Fast charger segment accounted for the largest market revenue share in 2024

Market Size & Forecast

  • Historic Market Opportunities 2020-2024: USD 99.66 billion
  • Market Future Opportunities 2025-2030: USD 82.90 billion
  • CAGR from 2025 to 2030 : 36.2%

Market Summary

  • The electric vehicle charger market is defined by rapid infrastructure expansion, with residential installations outpacing public stations by a ratio of nearly 10-to-1. Deployment of smart charging systems, which can reduce household energy costs by up to 20% through off-peak scheduling, exemplifies the market's technological maturation.
  • A primary driver is the stringent emissions regulations in key automotive regions, which legally mandate a shift to zero-emission vehicles and, by extension, necessitate a robust charging network.
  • However, this growth is constrained by the significant challenge of grid modernization; the high power demands of multiple fast chargers can increase localized grid stress by over 50%, risking outages without substantial upgrades. This dynamic creates a complex operational environment where hardware innovation must be balanced with foundational energy infrastructure capabilities to ensure sustainable market development.

What will be the Size of the Electric Vehicle Charger Market during the forecast period?

Get Key Insights on Market Forecast (PDF) Request Free Sample

How is the Electric Vehicle Charger Market Segmented?

The electric vehicle charger industry research report provides comprehensive data (region-wise segment analysis), with forecasts and analysis for the period 2026-2030, as well as historical data from 2020-2024 for the following segments.

  • End-user
    • Residential
    • Commercial
  • Type
    • Fast charger
    • Slow charger
  • Vehicle type
    • BEV
    • PHEV
    • HEV
  • Geography
    • APAC
      • China
      • Japan
      • India
    • North America
      • US
      • Canada
      • Mexico
    • Europe
      • Germany
      • UK
      • France
    • South America
      • Brazil
      • Argentina
      • Colombia
    • Middle East and Africa
      • Saudi Arabia
      • UAE
      • South Africa
    • Rest of World (ROW)

How is the Electric Vehicle Charger Market Segmented by End-user?

The residential segment is estimated to witness significant growth during the forecast period.

The residential segment accounts for over 85% of all charging sessions, establishing it as the foundational component of the electric vehicle charger market.

This dominance is due to the convenience and cost-effectiveness of overnight charging, with smart charging functionalities reducing household energy bills by an average of 15% through off-peak scheduling.

Adoption is primarily driven by homeowners installing Level 2 AC charging systems, which are compatible with nearly all electric vehicles. In contrast to the commercial sector's focus on high-speed DC fast charging, residential solutions prioritize steady, battery-preserving power delivery.

The growth of vehicle-to-home (V2H) technology is also transforming this segment, allowing homes to draw power from car batteries during grid outages, thereby increasing household energy resilience.

Request Free Sample

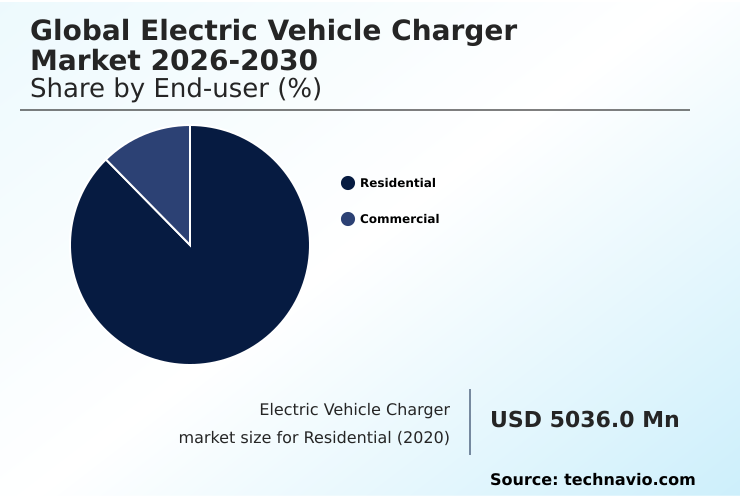
The Residential segment was valued at USD 14.96 billion in 2024 and showed a gradual increase during the forecast period.

Request Free Sample

How demand for the Electric Vehicle Charger market is rising in the leading region?

APAC is estimated to contribute 44.7% to the growth of the global market during the forecast period.Technavio’s analysts have elaborately explained the regional trends and drivers that shape the market during the forecast period.

See How Electric Vehicle Charger Market demand is rising in APAC Request Free Sample

The global electric vehicle charger market exhibits significant geographic disparity, with APAC accounting for over 44% of the incremental growth, a figure nearly double that of Europe.

This dominance is driven by China, which alone represents over 35% of new global installations, propelled by aggressive government mandates for a comprehensive public charging network and charging infrastructure deployment.

In contrast, the North American market, contributing around 24% of growth, shows a higher reliance on residential charging infrastructure, with private home chargers outnumbering public ones by a ratio of 9-to-1.

This difference reflects contrasting consumer behaviors and urban densities, where European strategies focus more on destination charging and interoperability standards to support cross-border travel, while APAC prioritizes high-power charging hubs for urban mobility and EV fleet charging solutions.

What are the key Drivers, Trends, and Challenges in the Electric Vehicle Charger Market?

Our researchers analyzed the data with 2025 as the base year, along with the key drivers, trends, and challenges. A holistic analysis of drivers will help companies refine their marketing strategies to gain a competitive advantage.

  • Understanding the nuances between charger types is critical for deployment strategy, where the level 2 vs dc fast charging speed difference dictates suitability for specific locations. DC fast chargers, for instance, can replenish 80% of a battery in under 30 minutes, whereas Level 2 systems require several hours, making them better suited for residential or workplace settings.
  • The cost of commercial ev charging station installation is a major consideration for businesses, with hardware and grid upgrades often exceeding initial projections by 20-30% without proper site evaluation. As the market matures, v2g technology business models are emerging, allowing fleet operators to generate revenue by selling stored energy back to the grid during peak demand.
  • This is enabled by open standards like the ocpp for smart charging networks, which ensures interoperability between different hardware and software vendors. For large-scale operations, a well-defined ev fleet depot charging design is essential for minimizing downtime and optimizing energy consumption.
  • The benefits of bidirectional ev chargers extend beyond commercial use, offering homeowners a source of backup power and enhancing overall grid resilience.

What are the key market drivers leading to the rise in the adoption of Electric Vehicle Charger Industry?

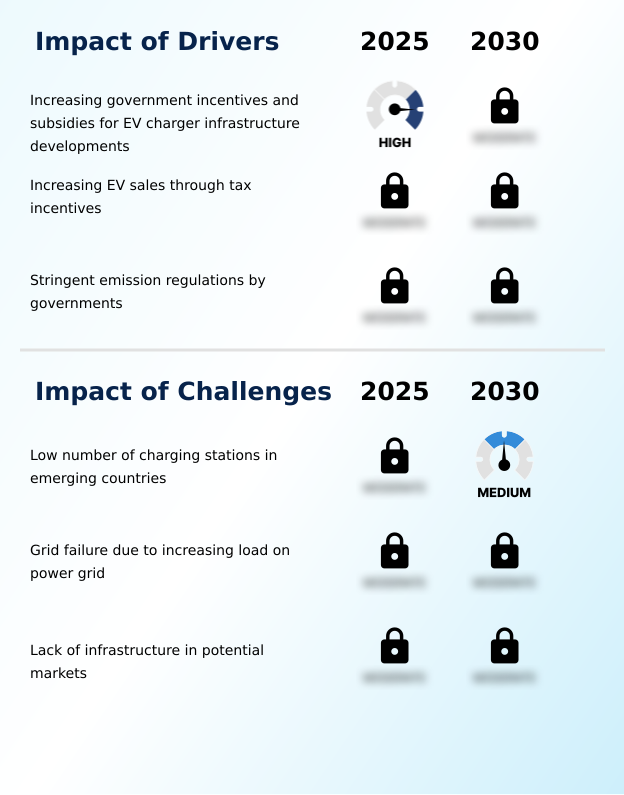
  • The increasing availability of government incentives and subsidies for EV charger infrastructure development is a primary driver fueling market expansion.

  • Government mandates and financial incentives are the primary drivers accelerating the deployment of electric vehicle charger infrastructure, with some national programs subsidizing up to 80% of residential EVSE installation costs.
  • This direct fiscal support lowers the initial investment barrier for consumers and businesses, directly causing a 30% year-over-year increase in charger sales in supported regions.
  • Furthermore, stringent emissions regulations are compelling automotive OEMs to expand their EV offerings, which creates a guaranteed and growing customer base for Charge Point Operators (CPOs).
  • The expansion of the public charging network is a direct effect of these policies, as governments link EV sales targets to mandatory infrastructure build-outs.
  • This regulatory pressure ensures that the network expands in tandem with the vehicle fleet, supporting both residential and commercial charging services.

What are the market trends shaping the Electric Vehicle Charger Industry?

  • The rise of both open and closed platforms by electric vehicle charger solution providers is a key market trend, influencing network interoperability and user experience.

  • A defining trend in the electric vehicle charger market is the strategic pivot toward integrated energy management, where smart charging adoption has improved grid efficiency by 15% in pilot programs. This shift is driven by the need to manage the high electrical loads from DC fast charging stations, which can draw over 350 kW per session.
  • Consequently, a growing number of installations incorporate stationary energy storage, often using second-life EV batteries, to buffer grid demand and reduce operational costs for CPOs by up to 25%. This evolution from simple power delivery to sophisticated grid-interactive systems is creating new service models, such as Vehicle-to-Grid (V2G) platforms.
  • Such platforms enable EV owners to sell power back to the grid, transforming vehicles into distributed energy assets and enhancing electrical grid resilience. The use of an on-board charger and liquid-cooled cables is also becoming more prevalent.

What challenges does the Electric Vehicle Charger Industry face during its growth?

  • The insufficient number of charging stations in emerging countries presents a significant challenge to the industry's growth and global adoption.

  • A significant challenge constraining the growth of the electric vehicle charger market is the inadequacy of existing electrical grid infrastructure, where upgrading a single urban substation to support high-power charging hubs can cost 50% more than the chargers themselves.
  • The deployment of multiple DC fast charging units in a concentrated area can increase peak load on local distribution networks by over 200%, creating a high risk of brownouts and equipment failure. This issue is compounded by complex and slow permitting processes, which can delay new station deployments by 6-12 months.
  • Without substantial investment in grid modernization and streamlined regulatory approvals, the pace of infrastructure expansion cannot meet the demand generated by rising EV sales, particularly for commercial charging services and EV fleet charging solutions. This creates a bottleneck that limits market potential.

Exclusive Technavio Analysis on Customer Landscape

The electric vehicle charger market forecasting report includes the adoption lifecycle of the market, covering from the innovator’s stage to the laggard’s stage. It focuses on adoption rates in different regions based on penetration. Furthermore, the electric vehicle charger market report also includes key purchase criteria and drivers of price sensitivity to help companies evaluate and develop their market growth analysis strategies.

Customer Landscape of Electric Vehicle Charger Industry

Competitive Landscape

Companies are implementing various strategies, such as strategic alliances, electric vehicle charger market forecast, partnerships, mergers and acquisitions, geographical expansion, and product/service launches, to enhance their presence in the industry.

ABB Ltd. - Offerings include a range of Terra DC fast chargers and AC Wallbox solutions, catering to both commercial and residential electric vehicle charging requirements.

The industry research and growth report includes detailed analyses of the competitive landscape of the market and information about key companies, including:

  • ABB Ltd.
  • ADS TEC Energy Plc
  • Allego NV
  • Blink Charging Co.
  • ChargePoint Holdings Inc.
  • Delta Electronics Inc.
  • EDF Energy
  • ENGIE SA
  • EO Charging
  • EVgo Inc.
  • Hyundai Motor Group
  • Kempower Oyj
  • Leviton Manufacturing Co. Inc.
  • Robert Bosch GmbH
  • Schneider Electric SE
  • Siemens AG
  • TE Connectivity plc
  • Tesla Inc.
  • Wallbox NV

Qualitative and quantitative analysis of companies has been conducted to help clients understand the wider business environment as well as the strengths and weaknesses of key industry players. Data is qualitatively analyzed to categorize companies as pure play, category-focused, industry-focused, and diversified; it is quantitatively analyzed to categorize companies as dominant, leading, strong, tentative, and weak.

Market Intelligence Radar: High-Impact Developments & Growth Signals

  • In the Electrical Components and Equipment industry, the mandatory adoption of enhanced energy efficiency standards for power electronics has directly improved the performance of EV chargers, with new designs showing a 3-5% reduction in energy loss during charging sessions.
  • The increasing integration of Industrial IoT (IIoT) capabilities into electrical equipment now enables remote monitoring and predictive maintenance for charging networks, reducing CPO operational costs by up to 15% through optimized service schedules and improved charging network reliability.
  • A shift toward modular designs in electrical hardware manufacturing allows for more scalable and cost-effective production of EVSE, enabling faster charging infrastructure deployment to meet regional demand fluctuations, particularly for workplace charging.
  • Growing regulatory focus on circular economy principles has spurred the development of systems that use second-life batteries from other applications for stationary energy storage at charging hubs, enhancing grid stability management.

Dive into Technavio’s robust research methodology, blending expert interviews, extensive data synthesis, and validated models for unparalleled Electric Vehicle Charger Market insights. See full methodology.

Market Scope
Page number 291
Base year 2025
Historic period 2020-2024
Forecast period 2026-2030
Growth momentum & CAGR Accelerate at a CAGR of 36.2%
Market growth 2026-2030 USD 82897.2 million
Market structure Fragmented
YoY growth 2025-2026(%) 33.7%
Key countries China, Japan, India, South Korea, Australia, Indonesia, US, Canada, Mexico, Germany, UK, France, Italy, Spain, The Netherlands, Brazil, Argentina, Colombia, Saudi Arabia, UAE, South Africa, Israel and Turkey
Competitive landscape Leading Companies, Market Positioning of Companies, Competitive Strategies, and Industry Risks

Request Free Sample

Research Analyst Overview

  • The electric vehicle charger ecosystem operates through a multi-layered value chain, with raw material suppliers providing over 70% of essential semiconductors and power electronics to equipment manufacturers. These manufacturers, in turn, produce EVSE hardware that must comply with standards set by regulatory bodies, such as ISO 15118 for secure communication.
  • The equipment is then sold through direct channels or distributors to end-users in residential and commercial segments, with commercial applications showing a 15% higher adoption rate of DC fast chargers. Charge Point Operators (CPOs) manage network operations and billing, interacting with utility companies to implement demand response programs.
  • The entire ecosystem is supported by software developers creating energy management platforms and logistics firms handling the complex deployment of charging infrastructure.

What are the Key Data Covered in this Electric Vehicle Charger Market Research and Growth Report?

  • What is the expected growth of the Electric Vehicle Charger Market between 2026 and 2030?

    • The Electric Vehicle Charger Market is expected to grow by USD 82.90 billion during 2026-2030, registering a CAGR of 36.2%. Year-over-year growth in 2026 is estimated at 33.7%%. This acceleration is shaped by increasing government incentives and subsidies for ev charger infrastructure developments, which is intensifying demand across multiple end-use verticals covered in the report.

  • What segmentation does the market report cover?

    • The report is segmented by End-user (Residential, and Commercial), Type (Fast charger, and Slow charger), Vehicle Type (BEV, PHEV, and HEV) and Geography (APAC, North America, Europe, South America, Middle East and Africa). Among these, the Residential segment is estimated to witness significant growth during the forecast period, driven by rising adoption across key application areas. Each segment includes detailed qualitative and quantitative analysis, along with historical data from 2020-2024 and forecasts through 2030 with year-over-year growth rates.

  • Which regions are analyzed in the report?

    • The report covers APAC, North America, Europe, South America and Middle East and Africa. APAC is estimated to contribute 44.7% to market growth during the forecast period. Country-level analysis includes China, Japan, India, South Korea, Australia, Indonesia, US, Canada, Mexico, Germany, UK, France, Italy, Spain, The Netherlands, Brazil, Argentina, Colombia, Saudi Arabia, UAE, South Africa, Israel and Turkey, with dedicated market size tables and year-over-year growth for each.

  • What are the key growth drivers and market challenges?

    • The primary driver is increasing government incentives and subsidies for ev charger infrastructure developments, which is accelerating investment and industry demand. The main challenge is low number of charging stations in emerging countries, creating operational barriers for key market participants. The report quantifies the impact of each driver and challenge across 2026 and 2030 with comparative analysis.

  • Who are the major players in the Electric Vehicle Charger Market?

    • Key vendors include ABB Ltd., ADS TEC Energy Plc, Allego NV, Blink Charging Co., ChargePoint Holdings Inc., Delta Electronics Inc., EDF Energy, ENGIE SA, EO Charging, EVgo Inc., Hyundai Motor Group, Kempower Oyj, Leviton Manufacturing Co. Inc., Robert Bosch GmbH, Schneider Electric SE, Siemens AG, TE Connectivity plc, Tesla Inc. and Wallbox NV. The report provides qualitative and quantitative analysis categorizing companies as dominant, leading, strong, tentative, and weak based on their market positioning. Company profiles include business segment analysis, SWOT assessment, key offerings, and recent strategic developments.

Market Research Insights

  • The competitive landscape of the electric vehicle charger market is characterized by a high degree of fragmentation, with the top ten vendors accounting for less than 60% of the total market share.
  • Leading players such as ABB and Schneider Electric are solidifying their positions by launching advanced high-power charging systems tailored for commercial fleets, which now represent over 30% of new installations. This focus on industrial applications addresses the growing demand from logistics and public transit for reliable depot charging solutions.
  • These strategic moves respond directly to the industry-wide push for faster turnaround times and greater operational efficiency. However, all vendors face the persistent challenge of ensuring interoperability across different vehicle platforms and software ecosystems, compelling them to adapt their product roadmaps toward open standards like OCPP.

We can help! Our analysts can customize this electric vehicle charger market research report to meet your requirements.

Get in touch

1. Executive Summary

1.1 Market overview

Executive Summary - Chart on Market Overview
Executive Summary - Data Table on Market Overview
Executive Summary - Chart on Global Market Characteristics
Executive Summary - Chart on Market by Geography
Executive Summary - Chart on Market Segmentation by End-user
Executive Summary - Chart on Market Segmentation by Type
Executive Summary - Chart on Market Segmentation by Vehicle Type
Executive Summary - Chart on Incremental Growth
Executive Summary - Data Table on Incremental Growth
Executive Summary - Chart on Company Market Positioning

2. Technavio Analysis

2.1 Analysis of price sensitivity, lifecycle, customer purchase basket, adoption rates, and purchase criteria

2.2 Criticality of inputs and Factors of differentiation

Chart on Overview on criticality of inputs and factors of differentiation

2.3 Factors of disruption

Chart on Overview on factors of disruption

2.4 Impact of drivers and challenges

Chart on Impact of drivers and challenges in 2025 and 2030

3. Market Landscape

3.1 Market ecosystem

Chart on Parent Market
Data Table on - Parent Market

3.2 Market characteristics

Chart on Market characteristics analysis

3.3 Value chain analysis

Chart on Value chain analysis

4. Market Sizing

4.1 Market definition

Data Table on Offerings of companies included in the market definition

4.2 Market segment analysis

Market segments

4.3 Market size 2025

4.4 Market outlook: Forecast for 2025-2030

Chart on Global - Market size and forecast 2025-2030 ($ million)
Data Table on Global - Market size and forecast 2025-2030 ($ million)
Chart on Global Market: Year-over-year growth 2025-2030 (%)
Data Table on Global Market: Year-over-year growth 2025-2030 (%)

5. Historic Market Size

5.1 Global Electric Vehicle Charger Market 2020 - 2024

Historic Market Size - Data Table on Global Electric Vehicle Charger Market 2020 - 2024 ($ million)

5.2 End-user segment analysis 2020 - 2024

Historic Market Size - End-user Segment 2020 - 2024 ($ million)

5.3 Type segment analysis 2020 - 2024

Historic Market Size - Type Segment 2020 - 2024 ($ million)

5.4 Vehicle Type segment analysis 2020 - 2024

Historic Market Size - Vehicle Type Segment 2020 - 2024 ($ million)

5.5 Geography segment analysis 2020 - 2024

Historic Market Size - Geography Segment 2020 - 2024 ($ million)

5.6 Country segment analysis 2020 - 2024

Historic Market Size - Country Segment 2020 - 2024 ($ million)

6. Qualitative Analysis

6.1 Impact of AI on Global Electric Vehicle Charger Market

7. Five Forces Analysis

7.1 Five forces summary

Five forces analysis - Comparison between 2025 and 2030

7.2 Bargaining power of buyers

Bargaining power of buyers - Impact of key factors 2025 and 2030

7.3 Bargaining power of suppliers

Bargaining power of suppliers - Impact of key factors in 2025 and 2030

7.4 Threat of new entrants

Threat of new entrants - Impact of key factors in 2025 and 2030

7.5 Threat of substitutes

Threat of substitutes - Impact of key factors in 2025 and 2030

7.6 Threat of rivalry

Threat of rivalry - Impact of key factors in 2025 and 2030

7.7 Market condition

Chart on Market condition - Five forces 2025 and 2030

8. Market Segmentation by End-user

8.1 Market segments

Chart on End-user - Market share 2025-2030 (%)
Data Table on End-user - Market share 2025-2030 (%)

8.2 Comparison by End-user

Chart on Comparison by End-user
Data Table on Comparison by End-user

8.3 Residential - Market size and forecast 2025-2030

Chart on Residential - Market size and forecast 2025-2030 ($ million)
Data Table on Residential - Market size and forecast 2025-2030 ($ million)
Chart on Residential - Year-over-year growth 2025-2030 (%)
Data Table on Residential - Year-over-year growth 2025-2030 (%)

8.4 Commercial - Market size and forecast 2025-2030

Chart on Commercial - Market size and forecast 2025-2030 ($ million)
Data Table on Commercial - Market size and forecast 2025-2030 ($ million)
Chart on Commercial - Year-over-year growth 2025-2030 (%)
Data Table on Commercial - Year-over-year growth 2025-2030 (%)

8.5 Market opportunity by End-user

Market opportunity by End-user ($ million)
Data Table on Market opportunity by End-user ($ million)

9. Market Segmentation by Type

9.1 Market segments

Chart on Type - Market share 2025-2030 (%)
Data Table on Type - Market share 2025-2030 (%)

9.2 Comparison by Type

Chart on Comparison by Type
Data Table on Comparison by Type

9.3 Fast charger - Market size and forecast 2025-2030

Chart on Fast charger - Market size and forecast 2025-2030 ($ million)
Data Table on Fast charger - Market size and forecast 2025-2030 ($ million)
Chart on Fast charger - Year-over-year growth 2025-2030 (%)
Data Table on Fast charger - Year-over-year growth 2025-2030 (%)

9.4 Slow charger - Market size and forecast 2025-2030

Chart on Slow charger - Market size and forecast 2025-2030 ($ million)
Data Table on Slow charger - Market size and forecast 2025-2030 ($ million)
Chart on Slow charger - Year-over-year growth 2025-2030 (%)
Data Table on Slow charger - Year-over-year growth 2025-2030 (%)

9.5 Market opportunity by Type

Market opportunity by Type ($ million)
Data Table on Market opportunity by Type ($ million)

10. Market Segmentation by Vehicle Type

10.1 Market segments

Chart on Vehicle Type - Market share 2025-2030 (%)
Data Table on Vehicle Type - Market share 2025-2030 (%)

10.2 Comparison by Vehicle Type

Chart on Comparison by Vehicle Type
Data Table on Comparison by Vehicle Type

10.3 BEV - Market size and forecast 2025-2030

Chart on BEV - Market size and forecast 2025-2030 ($ million)
Data Table on BEV - Market size and forecast 2025-2030 ($ million)
Chart on BEV - Year-over-year growth 2025-2030 (%)
Data Table on BEV - Year-over-year growth 2025-2030 (%)

10.4 PHEV - Market size and forecast 2025-2030

Chart on PHEV - Market size and forecast 2025-2030 ($ million)
Data Table on PHEV - Market size and forecast 2025-2030 ($ million)
Chart on PHEV - Year-over-year growth 2025-2030 (%)
Data Table on PHEV - Year-over-year growth 2025-2030 (%)

10.5 HEV - Market size and forecast 2025-2030

Chart on HEV - Market size and forecast 2025-2030 ($ million)
Data Table on HEV - Market size and forecast 2025-2030 ($ million)
Chart on HEV - Year-over-year growth 2025-2030 (%)
Data Table on HEV - Year-over-year growth 2025-2030 (%)

10.6 Market opportunity by Vehicle Type

Market opportunity by Vehicle Type ($ million)
Data Table on Market opportunity by Vehicle Type ($ million)

11. Customer Landscape

11.1 Customer landscape overview

Analysis of price sensitivity, lifecycle, customer purchase basket, adoption rates, and purchase criteria

12. Geographic Landscape

12.1 Geographic segmentation

Chart on Market share by geography 2025-2030 (%)
Data Table on Market share by geography 2025-2030 (%)

12.2 Geographic comparison

Chart on Geographic comparison
Data Table on Geographic comparison

12.3 APAC - Market size and forecast 2025-2030

Chart on APAC - Market size and forecast 2025-2030 ($ million)
Data Table on APAC - Market size and forecast 2025-2030 ($ million)
Chart on APAC - Year-over-year growth 2025-2030 (%)
Data Table on APAC - Year-over-year growth 2025-2030 (%)
Chart on Regional Comparison - APAC
Data Table on Regional Comparison - APAC

12.3.1 China - Market size and forecast 2025-2030

Chart on China - Market size and forecast 2025-2030 ($ million)
Data Table on China - Market size and forecast 2025-2030 ($ million)
Chart on China - Year-over-year growth 2025-2030 (%)
Data Table on China - Year-over-year growth 2025-2030 (%)

12.3.2 Japan - Market size and forecast 2025-2030

Chart on Japan - Market size and forecast 2025-2030 ($ million)
Data Table on Japan - Market size and forecast 2025-2030 ($ million)
Chart on Japan - Year-over-year growth 2025-2030 (%)
Data Table on Japan - Year-over-year growth 2025-2030 (%)

12.3.3 India - Market size and forecast 2025-2030

Chart on India - Market size and forecast 2025-2030 ($ million)
Data Table on India - Market size and forecast 2025-2030 ($ million)
Chart on India - Year-over-year growth 2025-2030 (%)
Data Table on India - Year-over-year growth 2025-2030 (%)

12.3.4 South Korea - Market size and forecast 2025-2030

Chart on South Korea - Market size and forecast 2025-2030 ($ million)
Data Table on South Korea - Market size and forecast 2025-2030 ($ million)
Chart on South Korea - Year-over-year growth 2025-2030 (%)
Data Table on South Korea - Year-over-year growth 2025-2030 (%)

12.3.5 Australia - Market size and forecast 2025-2030

Chart on Australia - Market size and forecast 2025-2030 ($ million)
Data Table on Australia - Market size and forecast 2025-2030 ($ million)
Chart on Australia - Year-over-year growth 2025-2030 (%)
Data Table on Australia - Year-over-year growth 2025-2030 (%)

12.3.6 Indonesia - Market size and forecast 2025-2030

Chart on Indonesia - Market size and forecast 2025-2030 ($ million)
Data Table on Indonesia - Market size and forecast 2025-2030 ($ million)
Chart on Indonesia - Year-over-year growth 2025-2030 (%)
Data Table on Indonesia - Year-over-year growth 2025-2030 (%)

12.4 North America - Market size and forecast 2025-2030

Chart on North America - Market size and forecast 2025-2030 ($ million)
Data Table on North America - Market size and forecast 2025-2030 ($ million)
Chart on North America - Year-over-year growth 2025-2030 (%)
Data Table on North America - Year-over-year growth 2025-2030 (%)
Chart on Regional Comparison - North America
Data Table on Regional Comparison - North America

12.4.1 US - Market size and forecast 2025-2030

Chart on US - Market size and forecast 2025-2030 ($ million)
Data Table on US - Market size and forecast 2025-2030 ($ million)
Chart on US - Year-over-year growth 2025-2030 (%)
Data Table on US - Year-over-year growth 2025-2030 (%)

12.4.2 Canada - Market size and forecast 2025-2030

Chart on Canada - Market size and forecast 2025-2030 ($ million)
Data Table on Canada - Market size and forecast 2025-2030 ($ million)
Chart on Canada - Year-over-year growth 2025-2030 (%)
Data Table on Canada - Year-over-year growth 2025-2030 (%)

12.4.3 Mexico - Market size and forecast 2025-2030

Chart on Mexico - Market size and forecast 2025-2030 ($ million)
Data Table on Mexico - Market size and forecast 2025-2030 ($ million)
Chart on Mexico - Year-over-year growth 2025-2030 (%)
Data Table on Mexico - Year-over-year growth 2025-2030 (%)

12.5 Europe - Market size and forecast 2025-2030

Chart on Europe - Market size and forecast 2025-2030 ($ million)
Data Table on Europe - Market size and forecast 2025-2030 ($ million)
Chart on Europe - Year-over-year growth 2025-2030 (%)
Data Table on Europe - Year-over-year growth 2025-2030 (%)
Chart on Regional Comparison - Europe
Data Table on Regional Comparison - Europe

12.5.1 Germany - Market size and forecast 2025-2030

Chart on Germany - Market size and forecast 2025-2030 ($ million)
Data Table on Germany - Market size and forecast 2025-2030 ($ million)
Chart on Germany - Year-over-year growth 2025-2030 (%)
Data Table on Germany - Year-over-year growth 2025-2030 (%)

12.5.2 UK - Market size and forecast 2025-2030

Chart on UK - Market size and forecast 2025-2030 ($ million)
Data Table on UK - Market size and forecast 2025-2030 ($ million)
Chart on UK - Year-over-year growth 2025-2030 (%)
Data Table on UK - Year-over-year growth 2025-2030 (%)

12.5.3 France - Market size and forecast 2025-2030

Chart on France - Market size and forecast 2025-2030 ($ million)
Data Table on France - Market size and forecast 2025-2030 ($ million)
Chart on France - Year-over-year growth 2025-2030 (%)
Data Table on France - Year-over-year growth 2025-2030 (%)

12.5.4 Italy - Market size and forecast 2025-2030

Chart on Italy - Market size and forecast 2025-2030 ($ million)
Data Table on Italy - Market size and forecast 2025-2030 ($ million)
Chart on Italy - Year-over-year growth 2025-2030 (%)
Data Table on Italy - Year-over-year growth 2025-2030 (%)

12.5.5 Spain - Market size and forecast 2025-2030

Chart on Spain - Market size and forecast 2025-2030 ($ million)
Data Table on Spain - Market size and forecast 2025-2030 ($ million)
Chart on Spain - Year-over-year growth 2025-2030 (%)
Data Table on Spain - Year-over-year growth 2025-2030 (%)

12.5.6 The Netherlands - Market size and forecast 2025-2030

Chart on The Netherlands - Market size and forecast 2025-2030 ($ million)
Data Table on The Netherlands - Market size and forecast 2025-2030 ($ million)
Chart on The Netherlands - Year-over-year growth 2025-2030 (%)
Data Table on The Netherlands - Year-over-year growth 2025-2030 (%)

12.6 South America - Market size and forecast 2025-2030

Chart on South America - Market size and forecast 2025-2030 ($ million)
Data Table on South America - Market size and forecast 2025-2030 ($ million)
Chart on South America - Year-over-year growth 2025-2030 (%)
Data Table on South America - Year-over-year growth 2025-2030 (%)
Chart on Regional Comparison - South America
Data Table on Regional Comparison - South America

12.6.1 Brazil - Market size and forecast 2025-2030

Chart on Brazil - Market size and forecast 2025-2030 ($ million)
Data Table on Brazil - Market size and forecast 2025-2030 ($ million)
Chart on Brazil - Year-over-year growth 2025-2030 (%)
Data Table on Brazil - Year-over-year growth 2025-2030 (%)

12.6.2 Argentina - Market size and forecast 2025-2030

Chart on Argentina - Market size and forecast 2025-2030 ($ million)
Data Table on Argentina - Market size and forecast 2025-2030 ($ million)
Chart on Argentina - Year-over-year growth 2025-2030 (%)
Data Table on Argentina - Year-over-year growth 2025-2030 (%)

12.6.3 Colombia - Market size and forecast 2025-2030

Chart on Colombia - Market size and forecast 2025-2030 ($ million)
Data Table on Colombia - Market size and forecast 2025-2030 ($ million)
Chart on Colombia - Year-over-year growth 2025-2030 (%)
Data Table on Colombia - Year-over-year growth 2025-2030 (%)

12.7 Middle East and Africa - Market size and forecast 2025-2030

Chart on Middle East and Africa - Market size and forecast 2025-2030 ($ million)
Data Table on Middle East and Africa - Market size and forecast 2025-2030 ($ million)
Chart on Middle East and Africa - Year-over-year growth 2025-2030 (%)
Data Table on Middle East and Africa - Year-over-year growth 2025-2030 (%)
Chart on Regional Comparison - Middle East and Africa
Data Table on Regional Comparison - Middle East and Africa

12.7.1 Saudi Arabia - Market size and forecast 2025-2030

Chart on Saudi Arabia - Market size and forecast 2025-2030 ($ million)
Data Table on Saudi Arabia - Market size and forecast 2025-2030 ($ million)
Chart on Saudi Arabia - Year-over-year growth 2025-2030 (%)
Data Table on Saudi Arabia - Year-over-year growth 2025-2030 (%)

12.7.2 UAE - Market size and forecast 2025-2030

Chart on UAE - Market size and forecast 2025-2030 ($ million)
Data Table on UAE - Market size and forecast 2025-2030 ($ million)
Chart on UAE - Year-over-year growth 2025-2030 (%)
Data Table on UAE - Year-over-year growth 2025-2030 (%)

12.7.3 South Africa - Market size and forecast 2025-2030

Chart on South Africa - Market size and forecast 2025-2030 ($ million)
Data Table on South Africa - Market size and forecast 2025-2030 ($ million)
Chart on South Africa - Year-over-year growth 2025-2030 (%)
Data Table on South Africa - Year-over-year growth 2025-2030 (%)

12.7.4 Israel - Market size and forecast 2025-2030

Chart on Israel - Market size and forecast 2025-2030 ($ million)
Data Table on Israel - Market size and forecast 2025-2030 ($ million)
Chart on Israel - Year-over-year growth 2025-2030 (%)
Data Table on Israel - Year-over-year growth 2025-2030 (%)

12.7.5 Turkey - Market size and forecast 2025-2030

Chart on Turkey - Market size and forecast 2025-2030 ($ million)
Data Table on Turkey - Market size and forecast 2025-2030 ($ million)
Chart on Turkey - Year-over-year growth 2025-2030 (%)
Data Table on Turkey - Year-over-year growth 2025-2030 (%)

12.8 Market opportunity by geography

Market opportunity by geography ($ million)
Data Tables on Market opportunity by geography ($ million)

13. Drivers, Challenges, and Opportunity

13.1 Market drivers

Increasing government incentives and subsidies for EV charger infrastructure developments
Increasing EV sales through tax incentives
Stringent emission regulations by governments

13.2 Market challenges

Low number of charging stations in emerging countries
Grid failure due to increasing load on power grid
Lack of infrastructure in potential markets

13.3 Impact of drivers and challenges

Impact of drivers and challenges in 2025 and 2030

13.4 Market opportunities

Rise in open and closed platforms by EV charger solution providers
Increasing use of renewable energy for powering EV charging stations
Rising demand for ultracapacitors in EV energy storage systems

14. Competitive Landscape

14.1 Overview

14.2

Overview on criticality of inputs and factors of differentiation

14.3 Landscape disruption

Overview on factors of disruption

14.4 Industry risks

Impact of key risks on business

15. Competitive Analysis

15.1 Companies profiled

Companies covered

15.2 Company ranking index

15.3 Market positioning of companies

Matrix on companies position and classification

15.4 ABB Ltd.

ABB Ltd. - Overview
ABB Ltd. - Business segments
ABB Ltd. - Key news
ABB Ltd. - Key offerings
ABB Ltd. - Segment focus
SWOT

15.5 Blink Charging Co.

Blink Charging Co. - Overview
Blink Charging Co. - Product / Service
Blink Charging Co. - Key news
Blink Charging Co. - Key offerings
SWOT

15.6 ChargePoint Holdings Inc.

ChargePoint Holdings Inc. - Overview
ChargePoint Holdings Inc. - Product / Service
ChargePoint Holdings Inc. - Key news
ChargePoint Holdings Inc. - Key offerings
SWOT

15.7 Delta Electronics Inc.

Delta Electronics Inc. - Overview
Delta Electronics Inc. - Business segments
Delta Electronics Inc. - Key offerings
Delta Electronics Inc. - Segment focus
SWOT

15.8 EDF Energy

EDF Energy - Overview
EDF Energy - Product / Service
EDF Energy - Key offerings
SWOT

15.9 EO Charging

EO Charging - Overview
EO Charging - Product / Service
EO Charging - Key offerings
SWOT

15.10 EVgo Inc.

EVgo Inc. - Overview
EVgo Inc. - Product / Service
EVgo Inc. - Key offerings
SWOT

15.11 Hyundai Motor Group

Hyundai Motor Group - Overview
Hyundai Motor Group - Business segments
Hyundai Motor Group - Key news
Hyundai Motor Group - Key offerings
Hyundai Motor Group - Segment focus
SWOT

15.12 Leviton Manufacturing Co. Inc.

Leviton Manufacturing Co. Inc. - Overview
Leviton Manufacturing Co. Inc. - Product / Service
Leviton Manufacturing Co. Inc. - Key offerings
SWOT

15.13 Robert Bosch GmbH

Robert Bosch GmbH - Overview
Robert Bosch GmbH - Product / Service
Robert Bosch GmbH - Key offerings
SWOT

15.14 Schneider Electric SE

Schneider Electric SE - Overview
Schneider Electric SE - Business segments
Schneider Electric SE - Key news
Schneider Electric SE - Key offerings
Schneider Electric SE - Segment focus
SWOT

15.15 Siemens AG

Siemens AG - Overview
Siemens AG - Business segments
Siemens AG - Key news
Siemens AG - Key offerings
Siemens AG - Segment focus
SWOT

15.16 TE Connectivity plc

TE Connectivity plc - Overview
TE Connectivity plc - Business segments
TE Connectivity plc - Key news
TE Connectivity plc - Key offerings
TE Connectivity plc - Segment focus
SWOT

15.17 Tesla Inc.

Tesla Inc. - Overview
Tesla Inc. - Business segments
Tesla Inc. - Key news
Tesla Inc. - Key offerings
Tesla Inc. - Segment focus
SWOT

15.18 Wallbox NV

Wallbox NV - Overview
Wallbox NV - Business segments
Wallbox NV - Key offerings
Wallbox NV - Segment focus
SWOT

16. Appendix

16.1 Scope of the report

Market definition
Objectives
Notes and caveats

16.2 Inclusions and exclusions checklist

Inclusions checklist
Exclusions checklist

16.3 Currency conversion rates for US$

16.4 Research methodology

16.5 Data procurement

Information sources

16.6 Data validation

16.7 Validation techniques employed for market sizing

16.8 Data synthesis

16.9 360 degree market analysis

16.10 List of abbreviations

Research Methodology

Technavio presents a detailed picture of the market by way of study, synthesis, and summation of data from multiple sources. The analysts have presented the various facets of the market with a particular focus on identifying the key industry influencers. The data thus presented is comprehensive, reliable, and the result of extensive research, both primary and secondary.

INFORMATION SOURCES

Primary sources

  • Manufacturers and suppliers
  • Channel partners
  • Industry experts
  • Strategic decision makers

Secondary sources

  • Industry journals and periodicals
  • Government data
  • Financial reports of key industry players
  • Historical data
  • Press releases

DATA ANALYSIS

Data Synthesis

  • Collation of data
  • Estimation of key figures
  • Analysis of derived insights

Data Validation

  • Triangulation with data models
  • Reference against proprietary databases
  • Corroboration with industry experts

REPORT WRITING

Qualitative

  • Market drivers
  • Market challenges
  • Market trends
  • Five forces analysis

Quantitative

  • Market size and forecast
  • Market segmentation
  • Geographical insights
  • Competitive landscape

Interested in this report?

Get your sample now to see our research methodology and insights!

Download Now

Frequently Asked Questions

Electric Vehicle Charger market growth will increase by USD 82897.2 million during 2026-2030.

The Electric Vehicle Charger market is expected to grow at a CAGR of 36.2% during 2026-2030.

Electric Vehicle Charger market is segmented by End-user (Residential, Commercial) Type (Fast charger, Slow charger) Vehicle type (BEV, PHEV, HEV)

ABB Ltd., ADS TEC Energy Plc, Allego NV, Blink Charging Co., ChargePoint Holdings Inc., Delta Electronics Inc., EDF Energy, ENGIE SA, EO Charging, EVgo Inc., Hyundai Motor Group, Kempower Oyj, Leviton Manufacturing Co. Inc., Robert Bosch GmbH, Schneider Electric SE, Siemens AG, TE Connectivity plc, Tesla Inc., Wallbox NV are a few of the key vendors in the Electric Vehicle Charger market.

APAC will register the highest growth rate of 44.7% among the other regions. Therefore, the Electric Vehicle Charger market in APAC is expected to garner significant business opportunities for the vendors during the forecast period.

China, Japan, India, South Korea, Australia, Indonesia, US, Canada, Mexico, Germany, UK, France, Italy, Spain, The Netherlands, Brazil, Argentina, Colombia, Saudi Arabia, UAE, South Africa, Israel, Turkey

  • Increasing government incentives and subsidies for EV charger infrastructure developments is the driving factor this market.

The Electric Vehicle Charger market vendors should focus on grabbing business opportunities from the End-user segment as it accounted for the largest market share in the base year.
RIA - Research AI Assistant
Ask RIA