Electric Vehicle (Ev) Transmission System Market Size 2024-2028
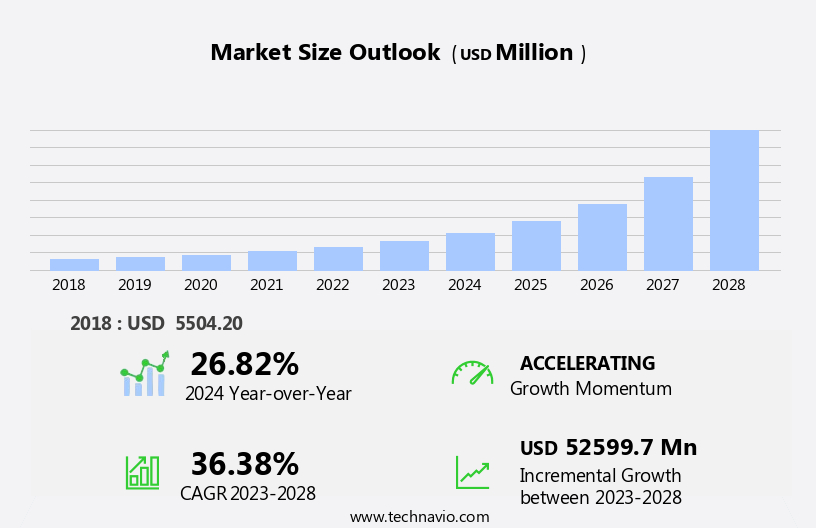
The electric vehicle (ev) transmission system market size is forecast to increase by USD 52.6 billion at a CAGR of 36.38% between 2023 and 2028.
- The market is experiencing significant growth driven by the increasing demand for Battery Electric Vehicles (BEVs) and the rise in popularity of e-axle systems. The e-axle, an integrated electric motor and transmission system, offers improved efficiency, reduced complexity, and enhanced performance, making it a preferred choice for automakers. However, the market growth is not without challenges. The lack of adequate supporting infrastructure for EVs, including charging stations and battery swapping facilities, poses a significant obstacle to widespread adoption. Additionally, the high cost of EVs and their transmission systems remains a barrier to entry for many consumers. To capitalize on market opportunities and navigate challenges effectively, companies should focus on developing innovative solutions to address infrastructure gaps and reduce production costs.
- Strategic partnerships and collaborations with charging infrastructure providers and governments can help accelerate market penetration. Furthermore, advancements in battery technology and the integration of renewable energy sources into the charging infrastructure can help mitigate range anxiety and reduce the overall carbon footprint of EVs. In summary, the EV Transmission System market is poised for growth, driven by the increasing popularity of BEVs and e-axle systems. However, the lack of supporting infrastructure and high production costs present significant challenges that require innovative solutions and strategic partnerships to overcome. Companies that successfully address these challenges will be well-positioned to capitalize on the market's potential and drive sustainable growth.
What will be the Size of the Electric Vehicle (Ev) Transmission System Market during the forecast period?

Request Free Sample
- The market is experiencing significant growth, driven by advancements in EV development and the increasing focus on sustainability. EV propulsion systems, including electric drivetrains and powertrains, are at the forefront of this trend, with smart charging and range enhancement technologies also playing crucial roles.The industry analysis encompasses electric vehicle production, cost, servicing, charging infrastructure, supply chain, ownership costs, reliability, standards, durability, architecture, and safety regulations.
- Additionally, telematics and OTA updates are essential components of the EV market, contributing to its continuous evolution. EV policy and maintenance are also significant factors influencing market dynamics.
How is this Electric Vehicle (Ev) Transmission System Industry segmented?
The electric vehicle (ev) transmission system industry research report provides comprehensive data (region-wise segment analysis), with forecasts and estimates in "USD million" for the period 2024-2028, as well as historical data from 2018-2022 for the following segments.
- Type
- Single-speed transmission
- Multi-speed transmission
- Application
- Battery electric vehicle (BEV)
- Plug-in hybrid electric vehicle (PHEV)
- Fuel cell electric vehicle (FCEV)
- End-User
- OEMs
- Aftermarket
- Fleet Operators
- Motor Type
- Direct Drive
- Integrated Motors
- Hybrid Systems
- Vehicle Type
- Passenger EVs
- Commercial EVs
- Two-Wheelers
- E-Buses
- Geography
- North America
- Europe
- France
- Germany
- Italy
- Norway
- Spain
- UK
- Middle East and Africa
- APAC
- China
- India
- Japan
- South Korea
- South America
- Rest of World (ROW)
By Type Insights
The single-speed transmission segment is estimated to witness significant growth during the forecast period.
The single-speed transmission segment dominates the market due to its widespread adoption in all-EVs. In 2022, this transmission type was the preferred choice for numerous EV manufacturers, including General Motors Co., Ford Motor Co., and Volkswagen AG. The less complex design of single-speed transmission systems is a significant factor driving their adoption. Electric motors generate maximum torque at low speeds, making single-speed transmission systems ideal for EV applications. EV regulations and safety features are crucial factors influencing the market's growth. Power output, charging infrastructure, and EV technology innovation are also essential elements shaping the market's dynamics.
Government incentives and subsidies play a vital role in boosting EV adoption, while the development of advanced software and connectivity features enhances the driving experience. EV powertrains, including electric motors, power electronics, and battery life, are undergoing continuous advancements to improve vehicle performance, efficiency, and range. The integration of electric axles, torque vectoring, and regenerative braking systems further optimizes power transmission and energy consumption. Heavy-duty vehicles are also transitioning to electric automotive powertrains to reduce energy consumption and comply with evolving regulations. The market for EV charging networks, including Level 1, 2, and 3 charging, is expanding to cater to the growing demand for convenient and efficient charging solutions.
The future of the EV transmission system market lies in the integration of autonomous driving systems, advanced driver assistance systems, and multi-speed transmissions, such as dual-clutch transmissions (DCTs), to enhance vehicle performance and efficiency. The market is expected to grow significantly as the adoption of EVs continues to increase.

Download Free Sample Report
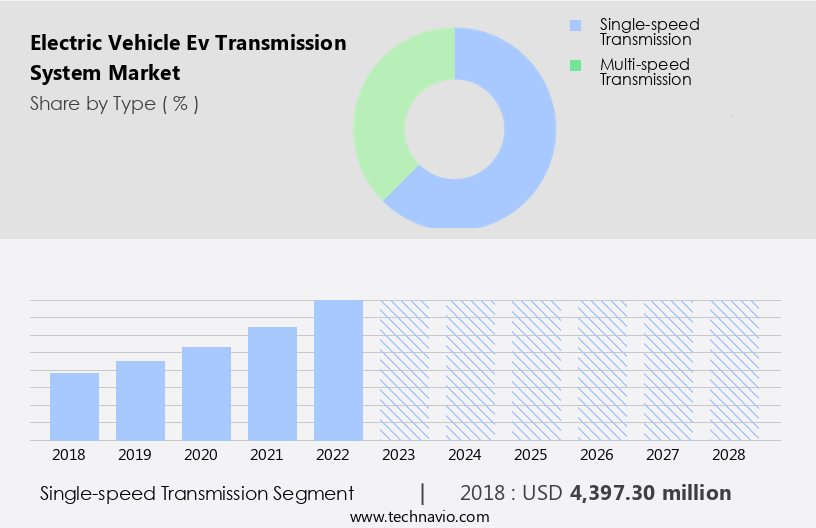
The Single-speed transmission segment was valued at USD 4.4 billion in 2018 and showed a gradual increase during the forecast period.
Regional Analysis
APAC is estimated to contribute 50% to the growth of the global market during the forecast period.Technavio's analysts have elaborately explained the regional trends and drivers that shape the market during the forecast period.

View Free PDF Sample
The market is experiencing significant growth, particularly in the Asia Pacific (APAC) region. This region is currently the largest market segment due to the strong adoption of EVs in countries like China and Japan. Factors driving this trend include government initiatives to reduce pollution, increasing stringent carbon emission norms, the expansion of EV charging infrastructure, and the participation of foreign and local Original Equipment Manufacturers (OEMs) to make EV technology more efficient and cost-effective. In China, the government considers EVs as an essential solution to combat air pollution in urban areas such as Beijing and Shanghai. Consequently, various measures have been implemented to promote EV sales, including subsidies, tax incentives, and the development of charging infrastructure.
Moreover, the increasing demand for EVs with advanced features, such as torque vectoring, electric axles, and regenerative braking, is further fueling market growth. The integration of electric motors, power electronics, and battery life management systems into EV powertrains is also contributing to the market's expansion. Additionally, the adoption of autonomous driving technology, electric vehicle software, and connectivity features is expected to create new opportunities for market growth. The EV market's growth is also influenced by factors such as fuel economy, charging infrastructure, and safety concerns. Governments and organizations are investing in research and development to improve battery performance, electric vehicle efficiency, and safety features.
Market Dynamics
Our researchers analyzed the data with 2023 as the base year, along with the key drivers, trends, and challenges. A holistic analysis of drivers will help companies refine their marketing strategies to gain a competitive advantage.
What are the key market drivers leading to the rise in the adoption of Electric Vehicle (Ev) Transmission System Industry?
- The significant surge in demand for battery electric vehicles (BEVs) serves as the primary catalyst for market growth.
- The market has experienced notable growth in recent years, as evidenced by the increasing year-over-year sales of Battery Electric Vehicles (BEVs). BEVs, which utilize all-electric powertrains and related systems and components, accounted for over 6% of global EV sales in 2021. This figure represents a significant increase from the approximately 2.5 million units sold in 2020. Norway led the sales of BEVs, with Iceland and Sweden following closely. Factors contributing to this growth include advancements in EV technologies, enhancements to charging infrastructure, and improving socioeconomic conditions. These elements are anticipated to continue fueling the demand for BEVs throughout the forecast period.
- The global sales of BEVs reached 4.2 million units in 2021, reflecting the market's robust growth. The increasing adoption of electric vehicles and advancements in related technologies are expected to further drive market expansion. As the world transitions towards more sustainable transportation solutions, the EV Transmission System Market is poised for continued growth.
What are the market trends shaping the Electric Vehicle (Ev) Transmission System Industry?
- The e-axle system's rising popularity represents a significant market trend in the automotive industry, signifying a shift towards more efficient and environmentally friendly powertrain solutions.
- The market is experiencing significant growth due to the increasing demand for EVs with higher efficiency and extended driving ranges. Lightweighting and larger battery sizes are key factors driving this trend. To optimally utilize vehicle space for larger batteries, innovative solutions such as integrating electric motors into the rigid rear axle are being explored. This integration can reduce vehicle weight by up to 100 kg.
- Furthermore, advancements in e-axle systems, which combine an electric motor and a rigid rear axle into a single streamlined module, are enhancing efficiency even further. These developments are crucial in addressing consumer concerns for increased range and improved performance in EVs.
What challenges does the Electric Vehicle (Ev) Transmission System Industry face during its growth?
- The insufficient development of essential infrastructure for electric vehicles (EVs) represents a significant obstacle to the industry's expansion. This challenge encompasses the need for improved charging station availability, reliable power grids, and supportive government policies. Addressing these infrastructure gaps is crucial for fostering market growth and widespread EV adoption.
- The market is witnessing significant growth due to the increasing demand for electric motorcycles and other types of EVs, including cars and scooters. However, the lack of proper charging infrastructure poses a major challenge. Long charge times and the inability to support different charging ports are among the other obstacles hindering the widespread adoption of electric motorcycles. This issue is particularly impacting the sales of high-performance electric motorcycles to mainstream customers.
- The absence of charging infrastructure continues to be a persistent barrier, negatively affecting the market growth. Despite these challenges, the increasing popularity of EVs and advancements in charging technology offer promising opportunities for market participants.
Exclusive Customer Landscape
The electric vehicle (ev) transmission system market forecasting report includes the adoption lifecycle of the market, covering from the innovator's stage to the laggard's stage. It focuses on adoption rates in different regions based on penetration. Furthermore, the electric vehicle (ev) transmission system market report also includes key purchase criteria and drivers of price sensitivity to help companies evaluate and develop their market growth analysis strategies.

Customer Landscape
Key Companies & Market Insights
Companies are implementing various strategies, such as strategic alliances, electric vehicle (ev) transmission system market forecast, partnerships, mergers and acquisitions, geographical expansion, and product/service launches, to enhance their presence in the industry.
The industry research and growth report includes detailed analyses of the competitive landscape of the market and information about key companies, including:
- AVL List GmbH (Germany, operations)
- Bosch GmbH (Germany)
- BorgWarner Inc. (United States)
- BYD Company Limited (China)
- Dana Incorporated (United States)
- Eaton Corporation plc (United States, operations)
- Elaphe Propulsion Technologies (Germany, operations)
- GKN Automotive (United Kingdom)
- Li Auto Inc. (China)
- Magna International Inc. (United States, operations)
- NIO Inc. (China)
- SAIC Motor Corporation (China)
- Schaeffler Technologies AG (Germany)
- Tesla Inc. (United States)
- TREMEC Corporation (United States)
- Valeo Siemens eAutomotive (Germany)
- Xpeng Motors (China)
- Xtrac Ltd. (United Kingdom)
- ZF Friedrichshafen AG (Germany)
- Zhejiang Geely Holding Group (China)
Qualitative and quantitative analysis of companies has been conducted to help clients understand the wider business environment as well as the strengths and weaknesses of key industry players. Data is qualitatively analyzed to categorize companies as pure play, category-focused, industry-focused, and diversified; it is quantitatively analyzed to categorize companies as dominant, leading, strong, tentative, and weak.
Recent Development and News in Electric Vehicle (Ev) Transmission System Market
- In February 2025, Schaeffler AG, a leading automotive and industrial supplier, announced the expansion of its e-mobility portfolio with the launch of its new compact electric drive system. This transmission system is designed to cater to the growing demand for compact electric vehicles (EVs), offering improved efficiency and reduced weight. The system's modular design enables easy integration into various vehicle architectures, making it a versatile solution for OEMs (Original Equipment Manufacturers) (BusinessWire, 2025).
- In December 2024, Magna International, a global automotive supplier, entered into a technological collaboration with Siemens Energy to develop a high-performance, compact, and lightweight transmission system for electric vehicles.
- This collaboration aims to combine Magna's automotive expertise with Siemens Energy's power electronics know-how, resulting in an advanced transmission system that delivers increased power density and efficiency (Magna International Press Release, 2024).
- In August 2024, Continental AG, a leading automotive technology company, acquired Vitesco Technologies, a global automotive technology supplier specializing in electric drives, transmissions, and thermal management systems. This acquisition is expected to strengthen Continental's position in the e-mobility market and provide a broader product portfolio, enabling the company to offer comprehensive solutions for electric vehicle drivetrains (Continental AG Press Release, 2024).
- In May 2024, CATL (Contemporary Amperex Technology Co.Limited), the world's largest producer of lithium-ion batteries for electric vehicles, announced the development of its in-house transmission system. The new system is designed to be compact, lightweight, and highly efficient, offering significant improvements in power density and reducing the overall weight of electric vehicles. This strategic move is expected to provide CATL with a competitive edge in the EV market by offering integrated battery and transmission solutions (CATL Press Release, 2024).
Research Analyst Overview
The Electric Drive Systems market is experiencing rapid growth, integral to the broader Electric Vehicle Components sector. Efficient EV System Integration is crucial within the overall Electric Vehicle Architecture, influencing EV Design and performance. Rigorous EV Testing and EV Validation ensure the reliability and safety of these systems before Electric Vehicle Manufacturing and EV Production. The EV Supply Chain plays a vital role in sourcing materials and components. The EV Aftermarket is emerging, focusing on EV Maintenance, EV Repair, and Electric Vehicle Servicing. EV Sustainability and reduced EV Emissions are key drivers, impacting Electric Vehicle Cost and EV Ownership Costs. Enhancing Electric Vehicle Reliability and Electric Vehicle Durability, alongside EV Range Enhancement technologies and Over-the-Air (OTA) Updates, are critical for consumer adoption. EV Telematics and Vehicle-to-Grid (V2G) Technology represent future advancements, guided by EV Standards and EV Safety Regulations.
Tier 1 suppliers are investing heavily in research and development to create more efficient electric axles, electric gearboxes, and battery life-extending technologies. Regenerative braking is also becoming more advanced, allowing EVs to recover more energy during braking and extend their range. Efficiency and energy consumption are essential considerations for the EV market. EVs are generally more efficient than traditional internal combustion engine vehicles, but there is still room for improvement. Innovations in power electronics and electric vehicle transmissions are helping to reduce energy consumption and improve overall performance. The EV market is also seeing advancements in EV technology related to autonomous driving.
Electric powertrains offer unique advantages for autonomous vehicles, including smooth acceleration and quiet operation. However, there are challenges to overcome, such as battery life and charging infrastructure. In conclusion, the EV market is experiencing significant growth due to a combination of regulatory pressures, infrastructure development, and technological innovation. The focus on improving power output, reducing energy consumption, and enhancing safety features is driving competition among manufacturers and suppliers. The future of the EV market looks promising, with continued advancements in technology and infrastructure expected to accelerate its growth.
Dive into Technavio's robust research methodology, blending expert interviews, extensive data synthesis, and validated models for unparalleled Electric Vehicle (Ev) Transmission System Market insights. See full methodology.
Market Scope
|
Report Coverage
|
Details
|
Page number
|
180
|
Base year
|
2023
|
Historic period
|
2018-2022 |
Forecast period
|
2024-2028
|
Growth momentum & CAGR
|
Accelerate at a CAGR of 36.38%
|
Market growth 2024-2028
|
USD 52599.7 million
|
Market structure
|
Fragmented
|
YoY growth 2023-2024(%)
|
26.82
|
Key countries
|
China, US, Norway, Germany, UKUS, China, Japan, Germany, France, Spain, Canada, India, South Korea, France, Japan, Italy, Brazil, UAE, UK, Spain, Rest of World (ROW), and Mexico
|
Competitive landscape
|
Leading Companies, Market Positioning of Companies, Competitive Strategies, and Industry Risks
|
Request Free Sample
What are the Key Data Covered in this Electric Vehicle (Ev) Transmission System Market Research and Growth Report?
- CAGR of the Electric Vehicle (Ev) Transmission System industry during the forecast period
- Detailed information on factors that will drive the growth and forecasting between 2024 and 2028
- Precise estimation of the size of the market and its contribution of the industry in focus to the parent market
- Accurate predictions about upcoming growth and trends and changes in consumer behaviour
- Growth of the market across APAC, Europe, North America, South America, and Middle East and Africa
- Thorough analysis of the market's competitive landscape and detailed information about companies
- Comprehensive analysis of factors that will challenge the electric vehicle (ev) transmission system market growth of industry companies
We can help! Our analysts can customize this electric vehicle (ev) transmission system market research report to meet your requirements.
Get in touch
1 Executive Summary
- 1.1 Market overview
- Executive Summary - Chart on Market Overview
- Executive Summary - Data Table on Market Overview
- Executive Summary - Chart on Global Market Characteristics
- Executive Summary - Chart on Market by Geography
- Executive Summary - Chart on Market Segmentation by Type
- Executive Summary - Chart on Market Segmentation by Application
- Executive Summary - Chart on Incremental Growth
- Executive Summary - Data Table on Incremental Growth
- Executive Summary - Chart on Company Market Positioning
2 Market Landscape
- 2.1 Market ecosystem
- Parent Market
- Data Table on - Parent Market
- 2.2 Market characteristics
- Market characteristics analysis
3 Market Sizing
- 3.1 Market definition
- Offerings of companies included in the market definition
- 3.2 Market segment analysis
- 3.4 Market outlook: Forecast for 2023-2028
- Chart on Global - Market size and forecast 2023-2028 ($ million)
- Data Table on Global - Market size and forecast 2023-2028 ($ million)
- Chart on Global Market: Year-over-year growth 2023-2028 (%)
- Data Table on Global Market: Year-over-year growth 2023-2028 (%)
4 Historic Market Size
- 4.1 Global Electric Vehicle (EV) Transmission System Market 2018 - 2022
- Historic Market Size - Data Table on Global Electric Vehicle (EV) Transmission System Market 2018 - 2022 ($ million)
- 4.2 Type segment analysis 2018 - 2022
- Historic Market Size - Type Segment 2018 - 2022 ($ million)
- 4.3 Application segment analysis 2018 - 2022
- Historic Market Size - Application Segment 2018 - 2022 ($ million)
- 4.4 Geography segment analysis 2018 - 2022
- Historic Market Size - Geography Segment 2018 - 2022 ($ million)
- 4.5 Country segment analysis 2018 - 2022
- Historic Market Size - Country Segment 2018 - 2022 ($ million)
5 Five Forces Analysis
- 5.1 Five forces summary
- Five forces analysis - Comparison between 2023 and 2028
- 5.2 Bargaining power of buyers
- Bargaining power of buyers - Impact of key factors 2023 and 2028
- 5.3 Bargaining power of suppliers
- Bargaining power of suppliers - Impact of key factors in 2023 and 2028
- 5.4 Threat of new entrants
- Threat of new entrants - Impact of key factors in 2023 and 2028
- 5.5 Threat of substitutes
- Threat of substitutes - Impact of key factors in 2023 and 2028
- 5.6 Threat of rivalry
- Threat of rivalry - Impact of key factors in 2023 and 2028
- 5.7 Market condition
- Chart on Market condition - Five forces 2023 and 2028
6 Market Segmentation by Type
- 6.1 Market segments
- Chart on Type - Market share (2023-2028) (%)
- Data Table on Type - Market share (2023-2028) (%)
- 6.2 Comparison by Type
- Chart on Comparison by Type
- Data Table on Comparison by Type
- 6.3 Single-speed transmission - Market size and forecast (2023-2028)
- Chart on Single-speed transmission - Market size and forecast (2023-2028) ($ million)
- Data Table on Single-speed transmission - Market size and forecast (2023-2028) ($ million)
- Chart on Single-speed transmission - Year-over-year growth (2023-2028) (%)
- Data Table on Single-speed transmission - Year-over-year growth (2023-2028) (%)
- 6.4 Multi-speed transmission - Market size and forecast (2023-2028)
- Chart on Multi-speed transmission - Market size and forecast (2023-2028) ($ million)
- Data Table on Multi-speed transmission - Market size and forecast (2023-2028) ($ million)
- Chart on Multi-speed transmission - Year-over-year growth (2023-2028) (%)
- Data Table on Multi-speed transmission - Year-over-year growth (2023-2028) (%)
- 6.5 Market opportunity by Type
- Market opportunity by Type ($ million)
- Data Table on Market opportunity by Type ($ million)
7 Market Segmentation by Application
- 7.1 Market segments
- Chart on Application - Market share (2023-2028) (%)
- Data Table on Application - Market share (2023-2028) (%)
- 7.2 Comparison by Application
- Chart on Comparison by Application
- Data Table on Comparison by Application
- 7.3 Battery electric vehicle (BEV) - Market size and forecast (2023-2028)
- Chart on Battery electric vehicle (BEV) - Market size and forecast (2023-2028) ($ million)
- Data Table on Battery electric vehicle (BEV) - Market size and forecast (2023-2028) ($ million)
- Chart on Battery electric vehicle (BEV) - Year-over-year growth (2023-2028) (%)
- Data Table on Battery electric vehicle (BEV) - Year-over-year growth (2023-2028) (%)
- 7.4 Plug-in hybrid electric vehicle (PHEV) - Market size and forecast (2023-2028)
- Chart on Plug-in hybrid electric vehicle (PHEV) - Market size and forecast (2023-2028) ($ million)
- Data Table on Plug-in hybrid electric vehicle (PHEV) - Market size and forecast (2023-2028) ($ million)
- Chart on Plug-in hybrid electric vehicle (PHEV) - Year-over-year growth (2023-2028) (%)
- Data Table on Plug-in hybrid electric vehicle (PHEV) - Year-over-year growth (2023-2028) (%)
- 7.5 Fuel cell electric vehicle (FCEV) - Market size and forecast (2023-2028)
- Chart on Fuel cell electric vehicle (FCEV) - Market size and forecast (2023-2028) ($ million)
- Data Table on Fuel cell electric vehicle (FCEV) - Market size and forecast (2023-2028) ($ million)
- Chart on Fuel cell electric vehicle (FCEV) - Year-over-year growth (2023-2028) (%)
- Data Table on Fuel cell electric vehicle (FCEV) - Year-over-year growth (2023-2028) (%)
- 7.6 Market opportunity by Application
- Market opportunity by Application ($ million)
- Data Table on Market opportunity by Application ($ million)
8 Market Segmentation by End-User
- 8.1 Market segments
- Chart on End-User - Market share (2023-2028) (%)
- Data Table on End-User - Market share (2023-2028) (%)
- 8.2 Comparison by End-User
- Chart on Comparison by End-User
- Data Table on Comparison by End-User
- 8.3 OEMs - Market size and forecast (2023-2028)
- Chart on OEMs - Market size and forecast (2023-2028) ($ million)
- Data Table on OEMs - Market size and forecast (2023-2028) ($ million)
- Chart on OEMs - Year-over-year growth (2023-2028) (%)
- Data Table on OEMs - Year-over-year growth (2023-2028) (%)
- 8.4 Aftermarket - Market size and forecast (2023-2028)
- Chart on Aftermarket - Market size and forecast (2023-2028) ($ million)
- Data Table on Aftermarket - Market size and forecast (2023-2028) ($ million)
- Chart on Aftermarket - Year-over-year growth (2023-2028) (%)
- Data Table on Aftermarket - Year-over-year growth (2023-2028) (%)
- 8.5 Fleet Operators - Market size and forecast (2023-2028)
- Chart on Fleet Operators - Market size and forecast (2023-2028) ($ million)
- Data Table on Fleet Operators - Market size and forecast (2023-2028) ($ million)
- Chart on Fleet Operators - Year-over-year growth (2023-2028) (%)
- Data Table on Fleet Operators - Year-over-year growth (2023-2028) (%)
- 8.6 Market opportunity by End-User
- Market opportunity by End-User ($ million)
- Data Table on Market opportunity by End-User ($ million)
9 Market Segmentation by Motor Type
- 9.1 Market segments
- Chart on Motor Type - Market share (2023-2028) (%)
- Data Table on Motor Type - Market share (2023-2028) (%)
- 9.2 Comparison by Motor Type
- Chart on Comparison by Motor Type
- Data Table on Comparison by Motor Type
- 9.3 Direct Drive - Market size and forecast (2023-2028)
- Chart on Direct Drive - Market size and forecast (2023-2028) ($ million)
- Data Table on Direct Drive - Market size and forecast (2023-2028) ($ million)
- Chart on Direct Drive - Year-over-year growth (2023-2028) (%)
- Data Table on Direct Drive - Year-over-year growth (2023-2028) (%)
- 9.4 Integrated Motors - Market size and forecast (2023-2028)
- Chart on Integrated Motors - Market size and forecast (2023-2028) ($ million)
- Data Table on Integrated Motors - Market size and forecast (2023-2028) ($ million)
- Chart on Integrated Motors - Year-over-year growth (2023-2028) (%)
- Data Table on Integrated Motors - Year-over-year growth (2023-2028) (%)
- 9.5 Hybrid Systems - Market size and forecast (2023-2028)
- Chart on Hybrid Systems - Market size and forecast (2023-2028) ($ million)
- Data Table on Hybrid Systems - Market size and forecast (2023-2028) ($ million)
- Chart on Hybrid Systems - Year-over-year growth (2023-2028) (%)
- Data Table on Hybrid Systems - Year-over-year growth (2023-2028) (%)
- 9.6 Market opportunity by Motor Type
- Market opportunity by Motor Type ($ million)
- Data Table on Market opportunity by Motor Type ($ million)
10 Market Segmentation by Vehicle Type
- 10.1 Market segments
- Chart on Vehicle Type - Market share (2023-2028) (%)
- Data Table on Vehicle Type - Market share (2023-2028) (%)
- 10.2 Comparison by Vehicle Type
- Chart on Comparison by Vehicle Type
- Data Table on Comparison by Vehicle Type
- 10.3 Passenger EVs - Market size and forecast (2023-2028)
- Chart on Passenger EVs - Market size and forecast (2023-2028) ($ million)
- Data Table on Passenger EVs - Market size and forecast (2023-2028) ($ million)
- Chart on Passenger EVs - Year-over-year growth (2023-2028) (%)
- Data Table on Passenger EVs - Year-over-year growth (2023-2028) (%)
- 10.4 Commercial EVs - Market size and forecast (2023-2028)
- Chart on Commercial EVs - Market size and forecast (2023-2028) ($ million)
- Data Table on Commercial EVs - Market size and forecast (2023-2028) ($ million)
- Chart on Commercial EVs - Year-over-year growth (2023-2028) (%)
- Data Table on Commercial EVs - Year-over-year growth (2023-2028) (%)
- 10.5 Two-Wheelers - Market size and forecast (2023-2028)
- Chart on Two-Wheelers - Market size and forecast (2023-2028) ($ million)
- Data Table on Two-Wheelers - Market size and forecast (2023-2028) ($ million)
- Chart on Two-Wheelers - Year-over-year growth (2023-2028) (%)
- Data Table on Two-Wheelers - Year-over-year growth (2023-2028) (%)
- 10.6 E-Buses - Market size and forecast (2023-2028)
- Chart on E-Buses - Market size and forecast (2023-2028) ($ million)
- Data Table on E-Buses - Market size and forecast (2023-2028) ($ million)
- Chart on E-Buses - Year-over-year growth (2023-2028) (%)
- Data Table on E-Buses - Year-over-year growth (2023-2028) (%)
- 10.7 Market opportunity by Vehicle Type
- Market opportunity by Vehicle Type ($ million)
- Data Table on Market opportunity by Vehicle Type ($ million)
11 Customer Landscape
- 11.1 Customer landscape overview
- Analysis of price sensitivity, lifecycle, customer purchase basket, adoption rates, and purchase criteria
12 Geographic Landscape
- 12.1 Geographic segmentation
- Chart on Market share by geography 2023-2028 (%)
- Data Table on Market share by geography 2023-2028 (%)
- 12.2 Geographic comparison
- Chart on Geographic comparison
- Data Table on Geographic comparison
- 12.3 APAC - Market size and forecast 2023-2028
- Chart on APAC - Market size and forecast 2023-2028 ($ million)
- Data Table on APAC - Market size and forecast 2023-2028 ($ million)
- Chart on APAC - Year-over-year growth 2023-2028 (%)
- Data Table on APAC - Year-over-year growth 2023-2028 (%)
- 12.4 Europe - Market size and forecast 2023-2028
- Chart on Europe - Market size and forecast 2023-2028 ($ million)
- Data Table on Europe - Market size and forecast 2023-2028 ($ million)
- Chart on Europe - Year-over-year growth 2023-2028 (%)
- Data Table on Europe - Year-over-year growth 2023-2028 (%)
- 12.5 North America - Market size and forecast 2023-2028
- Chart on North America - Market size and forecast 2023-2028 ($ million)
- Data Table on North America - Market size and forecast 2023-2028 ($ million)
- Chart on North America - Year-over-year growth 2023-2028 (%)
- Data Table on North America - Year-over-year growth 2023-2028 (%)
- 12.6 South America - Market size and forecast 2023-2028
- Chart on South America - Market size and forecast 2023-2028 ($ million)
- Data Table on South America - Market size and forecast 2023-2028 ($ million)
- Chart on South America - Year-over-year growth 2023-2028 (%)
- Data Table on South America - Year-over-year growth 2023-2028 (%)
- 12.7 Middle East and Africa - Market size and forecast 2023-2028
- Chart on Middle East and Africa - Market size and forecast 2023-2028 ($ million)
- Data Table on Middle East and Africa - Market size and forecast 2023-2028 ($ million)
- Chart on Middle East and Africa - Year-over-year growth 2023-2028 (%)
- Data Table on Middle East and Africa - Year-over-year growth 2023-2028 (%)
- 12.8 China - Market size and forecast 2023-2028
- Chart on China - Market size and forecast 2023-2028 ($ million)
- Data Table on China - Market size and forecast 2023-2028 ($ million)
- Chart on China - Year-over-year growth 2023-2028 (%)
- Data Table on China - Year-over-year growth 2023-2028 (%)
- 12.9 US - Market size and forecast 2023-2028
- Chart on US - Market size and forecast 2023-2028 ($ million)
- Data Table on US - Market size and forecast 2023-2028 ($ million)
- Chart on US - Year-over-year growth 2023-2028 (%)
- Data Table on US - Year-over-year growth 2023-2028 (%)
- 12.10 Norway - Market size and forecast 2023-2028
- Chart on Norway - Market size and forecast 2023-2028 ($ million)
- Data Table on Norway - Market size and forecast 2023-2028 ($ million)
- Chart on Norway - Year-over-year growth 2023-2028 (%)
- Data Table on Norway - Year-over-year growth 2023-2028 (%)
- 12.11 Germany - Market size and forecast 2023-2028
- Chart on Germany - Market size and forecast 2023-2028 ($ million)
- Data Table on Germany - Market size and forecast 2023-2028 ($ million)
- Chart on Germany - Year-over-year growth 2023-2028 (%)
- Data Table on Germany - Year-over-year growth 2023-2028 (%)
- 12.12 UK - Market size and forecast 2023-2028
- Chart on UK - Market size and forecast 2023-2028 ($ million)
- Data Table on UK - Market size and forecast 2023-2028 ($ million)
- Chart on UK - Year-over-year growth 2023-2028 (%)
- Data Table on UK - Year-over-year growth 2023-2028 (%)
- 12.13 Market opportunity by geography
- Market opportunity by geography ($ million)
- Data Tables on Market opportunity by geography ($ million)
- 12.14 UKUS - Market size and forecast (2023-2028)
- Chart on UKUS - Market size and forecast (2023-2028) ($ million)
- Data Table on UKUS - Market size and forecast (2023-2028) ($ million)
- Chart on UKUS - Year-over-year growth (2023-2028) (%)
- Data Table on UKUS - Year-over-year growth (2023-2028) (%)
- 12.15 Canada - Market size and forecast (2023-2028)
- Chart on Canada - Market size and forecast (2023-2028) ($ million)
- Data Table on Canada - Market size and forecast (2023-2028) ($ million)
- Chart on Canada - Year-over-year growth (2023-2028) (%)
- Data Table on Canada - Year-over-year growth (2023-2028) (%)
- 12.16 India - Market size and forecast (2023-2028)
- Chart on India - Market size and forecast (2023-2028) ($ million)
- Data Table on India - Market size and forecast (2023-2028) ($ million)
- Chart on India - Year-over-year growth (2023-2028) (%)
- Data Table on India - Year-over-year growth (2023-2028) (%)
- 12.17 South Korea - Market size and forecast (2023-2028)
- Chart on South Korea - Market size and forecast (2023-2028) ($ million)
- Data Table on South Korea - Market size and forecast (2023-2028) ($ million)
- Chart on South Korea - Year-over-year growth (2023-2028) (%)
- Data Table on South Korea - Year-over-year growth (2023-2028) (%)
- 12.18 France - Market size and forecast (2023-2028)
- Chart on France - Market size and forecast (2023-2028) ($ million)
- Data Table on France - Market size and forecast (2023-2028) ($ million)
- Chart on France - Year-over-year growth (2023-2028) (%)
- Data Table on France - Year-over-year growth (2023-2028) (%)
- 12.19 Japan - Market size and forecast (2023-2028)
- Chart on Japan - Market size and forecast (2023-2028) ($ million)
- Data Table on Japan - Market size and forecast (2023-2028) ($ million)
- Chart on Japan - Year-over-year growth (2023-2028) (%)
- Data Table on Japan - Year-over-year growth (2023-2028) (%)
- 12.20 Italy - Market size and forecast (2023-2028)
- Chart on Italy - Market size and forecast (2023-2028) ($ million)
- Data Table on Italy - Market size and forecast (2023-2028) ($ million)
- Chart on Italy - Year-over-year growth (2023-2028) (%)
- Data Table on Italy - Year-over-year growth (2023-2028) (%)
- 12.21 Brazil - Market size and forecast (2023-2028)
- Chart on Brazil - Market size and forecast (2023-2028) ($ million)
- Data Table on Brazil - Market size and forecast (2023-2028) ($ million)
- Chart on Brazil - Year-over-year growth (2023-2028) (%)
- Data Table on Brazil - Year-over-year growth (2023-2028) (%)
- 12.22 UAE - Market size and forecast (2023-2028)
- Chart on UAE - Market size and forecast (2023-2028) ($ million)
- Data Table on UAE - Market size and forecast (2023-2028) ($ million)
- Chart on UAE - Year-over-year growth (2023-2028) (%)
- Data Table on UAE - Year-over-year growth (2023-2028) (%)
- 12.23 Spain - Market size and forecast (2023-2028)
- Chart on Spain - Market size and forecast (2023-2028) ($ million)
- Data Table on Spain - Market size and forecast (2023-2028) ($ million)
- Chart on Spain - Year-over-year growth (2023-2028) (%)
- Data Table on Spain - Year-over-year growth (2023-2028) (%)
- 12.24 Rest of World (ROW) - Market size and forecast (2023-2028)
- Chart on Rest of World (ROW) - Market size and forecast (2023-2028) ($ million)
- Data Table on Rest of World (ROW) - Market size and forecast (2023-2028) ($ million)
- Chart on Rest of World (ROW) - Year-over-year growth (2023-2028) (%)
- Data Table on Rest of World (ROW) - Year-over-year growth (2023-2028) (%)
13 Drivers, Challenges, and Opportunity/Restraints
- 13.3 Impact of drivers and challenges
- Impact of drivers and challenges in 2023 and 2028
- 13.4 Market opportunities/restraints
14 Competitive Landscape
- 14.2 Competitive Landscape
- Overview on criticality of inputs and factors of differentiation
- 14.3 Landscape disruption
- Overview on factors of disruption
- 14.4 Industry risks
- Impact of key risks on business
15 Competitive Analysis
- 15.2 Market positioning of companies
- Matrix on companies position and classification
- 15.3 Bosch GmbH (Germany)
- Bosch GmbH (Germany) - Overview
- Bosch GmbH (Germany) - Product / Service
- Bosch GmbH (Germany) - Key offerings
- 15.4 GKN Automotive (United Kingdom)
- GKN Automotive (United Kingdom) - Overview
- GKN Automotive (United Kingdom) - Product / Service
- GKN Automotive (United Kingdom) - Key offerings
- 15.5 BorgWarner Inc. (United States)
- BorgWarner Inc. (United States) - Overview
- BorgWarner Inc. (United States) - Product / Service
- BorgWarner Inc. (United States) - Key offerings
- 15.6 Dana Incorporated (United States)
- Dana Incorporated (United States) - Overview
- Dana Incorporated (United States) - Product / Service
- Dana Incorporated (United States) - Key offerings
- 15.7 Tesla Inc. (United States)
- Tesla Inc. (United States) - Overview
- Tesla Inc. (United States) - Product / Service
- Tesla Inc. (United States) - Key offerings
- 15.8 Eaton Corporation plc (United States, operations)
- Eaton Corporation plc (United States, operations) - Overview
- Eaton Corporation plc (United States, operations) - Product / Service
- Eaton Corporation plc (United States, operations) - Key offerings
- 15.9 AVL List GmbH (Germany, operations)
- AVL List GmbH (Germany, operations) - Overview
- AVL List GmbH (Germany, operations) - Product / Service
- AVL List GmbH (Germany, operations) - Key offerings
- 15.10 Magna International Inc. (United States, operations)
- Magna International Inc. (United States, operations) - Overview
- Magna International Inc. (United States, operations) - Product / Service
- Magna International Inc. (United States, operations) - Key offerings
- 15.11 NIO Inc. (China)
- NIO Inc. (China) - Overview
- NIO Inc. (China) - Product / Service
- NIO Inc. (China) - Key offerings
- 15.12 BYD Company Limited (China)
- BYD Company Limited (China) - Overview
- BYD Company Limited (China) - Product / Service
- BYD Company Limited (China) - Key offerings
- 15.13 Xpeng Motors (China)
- Xpeng Motors (China) - Overview
- Xpeng Motors (China) - Product / Service
- Xpeng Motors (China) - Key offerings
- 15.14 Li Auto Inc. (China)
- Li Auto Inc. (China) - Overview
- Li Auto Inc. (China) - Product / Service
- Li Auto Inc. (China) - Key offerings
- 15.15 Zhejiang Geely Holding Group (China)
- Zhejiang Geely Holding Group (China) - Overview
- Zhejiang Geely Holding Group (China) - Product / Service
- Zhejiang Geely Holding Group (China) - Key offerings
- 15.16 SAIC Motor Corporation (China)
- SAIC Motor Corporation (China) - Overview
- SAIC Motor Corporation (China) - Product / Service
- SAIC Motor Corporation (China) - Key offerings
- 15.17 Valeo Siemens eAutomotive (Germany)
- Valeo Siemens eAutomotive (Germany) - Overview
- Valeo Siemens eAutomotive (Germany) - Product / Service
- Valeo Siemens eAutomotive (Germany) - Key offerings
- 15.18 Schaeffler Technologies AG (Germany)
- Schaeffler Technologies AG (Germany) - Overview
- Schaeffler Technologies AG (Germany) - Product / Service
- Schaeffler Technologies AG (Germany) - Key offerings
- 15.19 ZF Friedrichshafen AG (Germany)
- ZF Friedrichshafen AG (Germany) - Overview
- ZF Friedrichshafen AG (Germany) - Product / Service
- ZF Friedrichshafen AG (Germany) - Key offerings
- 15.20 TREMEC Corporation (United States)
- TREMEC Corporation (United States) - Overview
- TREMEC Corporation (United States) - Product / Service
- TREMEC Corporation (United States) - Key offerings
- 15.21 Xtrac Ltd. (United Kingdom)
- Xtrac Ltd. (United Kingdom) - Overview
- Xtrac Ltd. (United Kingdom) - Product / Service
- Xtrac Ltd. (United Kingdom) - Key offerings
- 15.22 Elaphe Propulsion Technologies (Germany, operations)
- Elaphe Propulsion Technologies (Germany, operations) - Overview
- Elaphe Propulsion Technologies (Germany, operations) - Product / Service
- Elaphe Propulsion Technologies (Germany, operations) - Key offerings
- 15.23 AISIN CORP.
- AISIN CORP. - Overview
- AISIN CORP. - Product / Service
- AISIN CORP. - Key offerings
- 15.24 Allison Transmission Holdings Inc.
- Allison Transmission Holdings Inc. - Overview
- Allison Transmission Holdings Inc. - Product / Service
- Allison Transmission Holdings Inc. - Key offerings
- 15.25 AVL List GmbH
- AVL List GmbH - Overview
- AVL List GmbH - Product / Service
- AVL List GmbH - Key offerings
- 15.26 BorgWarner Inc.
- BorgWarner Inc. - Overview
- BorgWarner Inc. - Product / Service
- BorgWarner Inc. - Key offerings
- 15.27 Divgi TorqTransfer Systems
- Divgi TorqTransfer Systems - Overview
- Divgi TorqTransfer Systems - Product / Service
- Divgi TorqTransfer Systems - Key offerings
- 15.28 Eaton Corp. Plc
- Eaton Corp. Plc - Overview
- Eaton Corp. Plc - Product / Service
- Eaton Corp. Plc - Key offerings
- 15.29 GKN Automotive Ltd.
- GKN Automotive Ltd. - Overview
- GKN Automotive Ltd. - Product / Service
- GKN Automotive Ltd. - Key offerings
- 15.30 Hewland Engineering Ltd.
- Hewland Engineering Ltd. - Overview
- Hewland Engineering Ltd. - Product / Service
- Hewland Engineering Ltd. - Key offerings
- 15.31 Hitachi Ltd.
- Hitachi Ltd. - Overview
- Hitachi Ltd. - Product / Service
- Hitachi Ltd. - Key offerings
- 15.32 JATCO Ltd.
- JATCO Ltd. - Overview
- JATCO Ltd. - Product / Service
- JATCO Ltd. - Key offerings
- 15.33 Magna International Inc.
- Magna International Inc. - Overview
- Magna International Inc. - Product / Service
- Magna International Inc. - Key offerings
- 15.34 Magnetic Systems Technology
- Magnetic Systems Technology - Overview
- Magnetic Systems Technology - Product / Service
- Magnetic Systems Technology - Key offerings
- 15.35 Marposs Spa
- Marposs Spa - Overview
- Marposs Spa - Product / Service
- Marposs Spa - Key offerings
- 15.36 Mitsubishi Electric Corp.
- Mitsubishi Electric Corp. - Overview
- Mitsubishi Electric Corp. - Product / Service
- Mitsubishi Electric Corp. - Key offerings
- 15.37 OC Oerlikon Corp. AG
- OC Oerlikon Corp. AG - Overview
- OC Oerlikon Corp. AG - Product / Service
- OC Oerlikon Corp. AG - Key offerings
- 15.38 Ricardo Plc
- Ricardo Plc - Overview
- Ricardo Plc - Product / Service
- Ricardo Plc - Key offerings
- 15.39 Robert Bosch GmbH
- Robert Bosch GmbH - Overview
- Robert Bosch GmbH - Product / Service
- Robert Bosch GmbH - Key offerings
- 15.40 Schaeffler AG
- Schaeffler AG - Overview
- Schaeffler AG - Product / Service
- Schaeffler AG - Key offerings
- 15.41 Xtrac Ltd.
- Xtrac Ltd. - Overview
- Xtrac Ltd. - Product / Service
- Xtrac Ltd. - Key offerings
- 15.42 ZF Friedrichshafen AG
- ZF Friedrichshafen AG - Overview
- ZF Friedrichshafen AG - Product / Service
- ZF Friedrichshafen AG - Key offerings
16 Appendix
- 16.2 Inclusions and exclusions checklist
- Inclusions checklist
- Exclusions checklist
- 16.3 Currency conversion rates for US$
- Currency conversion rates for US$
- 16.4 Research methodology
- 16.7 Validation techniques employed for market sizing
- Validation techniques employed for market sizing
- 16.9 360 degree market analysis
- 360 degree market analysis
- 16.10 List of abbreviations