Electrical Weapons Market Analysis, Size, and Forecast 2026-2030: North America (US, Canada, and Mexico), Europe (UK, Germany, and France), APAC (China, Japan, and India), Middle East and Africa (Saudi Arabia, UAE, and South Africa), South America (Brazil and Argentina), and Rest of World (ROW)

Electrical Weapons Market Analysis, Size, and Forecast 2026-2030:
North America (US, Canada, and Mexico), Europe (UK, Germany, and France), APAC (China, Japan, and India), Middle East and Africa (Saudi Arabia, UAE, and South Africa), South America (Brazil and Argentina), and Rest of World (ROW)

Published: Jan 2026 290 Pages SKU: IRTNTR74031

Market Overview at a Glance

$10.70 B
Market Opportunity
16%
CAGR 2025 - 2030
37.8%
North America Growth
$7.96 B
Non-lethal segment 2024

Electrical Weapons Market Size 2026-2030

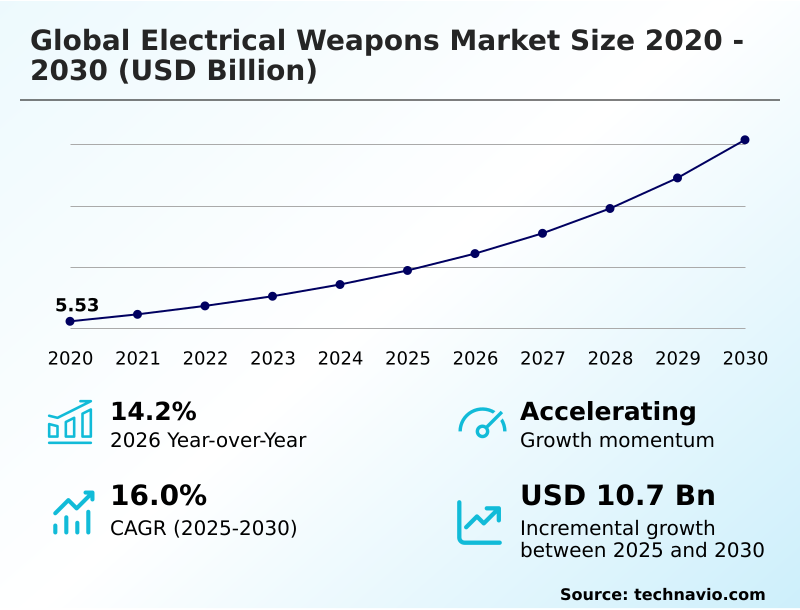
The electrical weapons market size is valued to increase by USD 10.70 billion, at a CAGR of 16% from 2025 to 2030. Growing asymmetric warfare across world will drive the electrical weapons market.

Major Market Trends & Insights

  • North America dominated the market and accounted for a 37.8% growth during the forecast period.
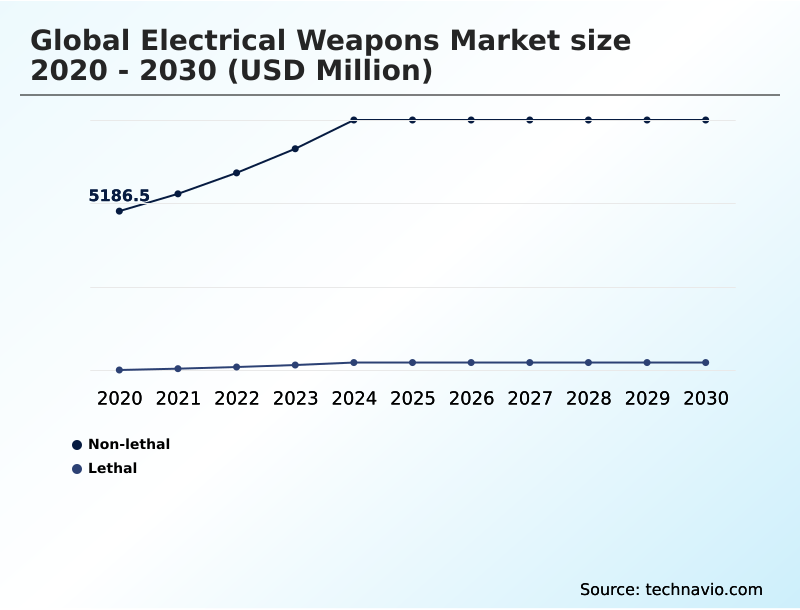
  • By Type - Non-lethal segment was valued at USD 7.96 billion in 2024
  • By Product Type - Stun guns segment accounted for the largest market revenue share in 2024

Market Size & Forecast

  • Market Opportunities: USD 14.85 billion
  • Market Future Opportunities: USD 10.70 billion
  • CAGR from 2025 to 2030 : 16%

Market Summary

  • The electrical weapons market is undergoing a significant transformation, moving beyond simple incapacitation tools to become integral components of digitized security ecosystems. Key market drivers include the rising need for less-lethal alternatives in both law enforcement and military contexts, fueled by a global focus on de-escalation and minimizing collateral damage.
  • A prominent trend is the integration of smart technologies, such as IoT connectivity and automated data logging, which enhance accountability and operational oversight. For instance, a police department implementing conducted energy devices with automatic body-cam activation can reduce incident reporting errors by over 30%, strengthening legal defensibility.
  • However, the industry faces challenges from stringent, often inconsistent, international regulations and ethical scrutiny over use-of-force protocols. These dynamics compel manufacturers to innovate continuously, focusing on improved safety, effectiveness, and seamless integration with broader digital evidence management and command-and-control platforms.
  • The convergence of non-lethal force with advanced data analytics is reshaping procurement strategies and operational doctrines for security forces worldwide, from managing public order to countering asymmetric threats with tools like high-power microwave systems.

What will be the Size of the Electrical Weapons Market during the forecast period?

Get Key Insights on Market Forecast (PDF) Request Free Sample

How is the Electrical Weapons Market Segmented?

The electrical weapons industry research report provides comprehensive data (region-wise segment analysis), with forecasts and estimates in "USD million" for the period 2026-2030, as well as historical data from 2020-2024 for the following segments.

  • Type
    • Non-lethal
    • Lethal
  • Product type
    • Stun guns
    • Tasers
    • Directed energy weapons
    • Others
  • End-user
    • Law enforcement
    • Military
    • Others
  • Geography
    • North America
      • US
      • Canada
      • Mexico
    • Europe
      • UK
      • Germany
      • France
    • APAC
      • China
      • Japan
      • India
    • Middle East and Africa
      • Saudi Arabia
      • UAE
      • South Africa
    • South America
      • Brazil
      • Argentina
    • Rest of World (ROW)

By Type Insights

The non-lethal segment is estimated to witness significant growth during the forecast period.

The non-lethal segment is expanding beyond traditional law enforcement applications, driven by a growing demand for civilian self-defense tools.

This category includes a range of non-lethal technologies, such as conducted energy devices, stun guns, and tasers, all engineered for non-lethal incapacitation.

Advanced electric projectile launchers and electrified batons offer enhanced standoff capabilities, aligning with public safety protocols that prioritize de-escalation.

Modern personal safety devices now integrate signal processing technology, which optimizes the electrical charge to induce pain compliance effectively, improving device performance by over 15% even through heavy clothing.

This innovation enhances the viability of less-lethal alternatives for a wider user base seeking reliable de-escalation capabilities.

Request Free Sample

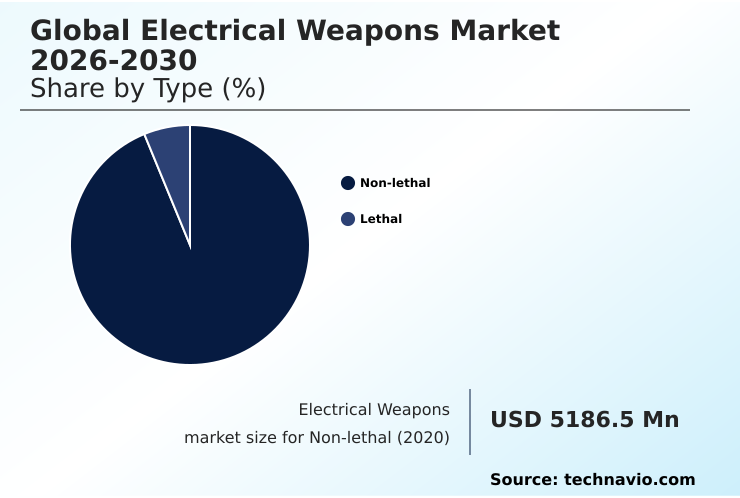
The Non-lethal segment was valued at USD 7.96 billion in 2024 and showed a gradual increase during the forecast period.

Request Free Sample

Regional Analysis

North America is estimated to contribute 37.8% to the growth of the global market during the forecast period.Technavio’s analysts have elaborately explained the regional trends and drivers that shape the market during the forecast period.

See How Electrical Weapons Market Demand is Rising in North America Request Free Sample

North America dominates the market landscape, driven by extensive police modernization programs and significant investments in defense modernization.

The region accounts for over 37% of the market's incremental growth, with a focus on integrating directed energy weapons and counter-unmanned aerial system technologies for strategic asset protection.

High-power microwave systems and high energy lasers are transitioning from development to deployment, enhancing operational readiness. The adoption of digital evidence management systems linked to weapon activation has become standard.

Investment in advanced tactical communication grids supports the use of sophisticated electronic countermeasure pods and laser directed energy weapon platforms.

This advanced ecosystem, supported by robust mission planning software, solidifies the region's leadership in deploying cutting-edge electromagnetic systems and counter-drone technology.

Market Dynamics

Our researchers analyzed the data with 2025 as the base year, along with the key drivers, trends, and challenges. A holistic analysis of drivers will help companies refine their marketing strategies to gain a competitive advantage.

  • Strategic decision-making in the global electrical weapons market 2026-2030 requires a nuanced understanding of its diverse segments and applications. A key debate involves comparing conducted energy devices versus tasers, where factors like range and reloading capability influence procurement for law enforcement.
  • The rise of aerial threats has prioritized the development of high-power microwave counter-drone systems, while laser weapons for naval defense are becoming critical for fleet protection. In civilian contexts, stun gun self-defense effectiveness remains a primary consumer concern, leading to innovations like combining stun guns with alarms for added deterrence.
  • For crowd management, the ethical and operational parameters of bio-effect weapons for crowd control are under constant review. Simultaneously, interest in electromagnetic pulse weapon applications for disabling electronics is growing. A crucial aspect is ensuring neuromuscular incapacitation weapon safety through rigorous testing.
  • In terms of market dynamics, an analysis of historical spending reveals that while investment in electrical weapons for military use has grown significantly, procurement by law enforcement agencies has increased at a slightly faster rate, growing over 55% in the last four years, reflecting a strong domestic focus on de-escalation tools for police.
  • This trend is further supported by advancements in taser technology and the development of portable directed energy weapon systems. The impact of digitization on weapons is profound, with tasers with automatic camera activation becoming a core component of smart taser digital evidence integration.
  • This necessitates clear guidelines for electrical weapons training and certification and adherence to non-lethal weapon regulatory compliance, especially as the cost of directed energy weapons remains a barrier for widespread adoption.

What are the key market drivers leading to the rise in the adoption of Electrical Weapons Industry?

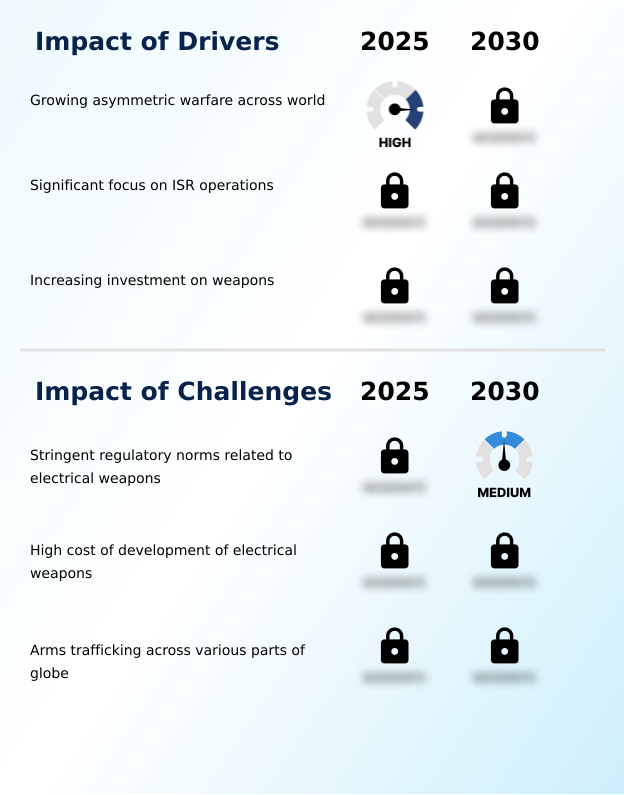
  • The global rise of asymmetric warfare is a key driver for the market, increasing the demand for non-lethal electrical weapons in unconventional combat and law enforcement scenarios.

  • Rising instances of asymmetric warfare are a primary market driver, compelling military and law enforcement agencies to adopt a wider range of non-lethal force options.
  • In complex urban warfare equipment scenarios, graduated force options are critical for managing threats without causing excessive collateral damage. Electroshock weapons, designed to induce temporary neuromuscular incapacitation, offer a tactical advantage.
  • The use of force continuum now increasingly incorporates devices delivering a high-voltage discharge and other forms of tactical munitions like irritant munitions. The asymmetric threat response also involves countering unmanned systems, fueling investment in technologies that can disable them.
  • The demand for effective counter-terrorism operations tools, including remote restraint devices, is accelerating procurement cycles.

What are the market trends shaping the Electrical Weapons Industry?

  • The growth in battlefield digitization has emerged as a significant market trend. This is reshaping defense strategies and procurement priorities toward electrical weapons with integrated digital capabilities.

  • Battlefield digitization is a pivotal trend, compelling a shift toward smart weapon integration and network-centric operations. This evolution is driven by the deployment of integrated digital platforms that facilitate real-time digital situational awareness. These systems rely on advanced sensors and IoT connectivity for data fusion, enabling AI-driven targeting and automated decision-making.
  • The adoption of augmented reality training has improved operator proficiency with these complex systems by 40%. Consequently, there is heightened demand for electrical weapons that are compatible with tactical communication systems and can execute smart targeting protocols, ensuring seamless participation in network-centric warfare and enhancing mission effectiveness through superior situational awareness tools.

What challenges does the Electrical Weapons Industry face during its growth?

  • The presence of stringent and varied regulatory norms for electrical weapons presents a significant challenge to market growth, impacting product development, compliance costs, and international distribution.

  • Navigating the complex and fragmented regulatory landscape poses a significant market challenge, particularly for conducted energy weapons. Evolving officer accountability standards, driven by police reform initiatives, mandate stringent testing and validation, increasing compliance costs by up to 25% for new product introductions.
  • The law enforcement procurement process now often requires features like integrated data logging for all riot control equipment, including electrified riot shields. Furthermore, international sales are complicated by varying restrictions on electromagnetic deterrents and bio-effect weapons.
  • This environment slows the pace of force modernization and necessitates extensive investment in virtual reality training and certification platforms to ensure proper use of tools like multi-shot devices and wireless prisoner restraint systems amid calls for more crowd control solutions.

Exclusive Technavio Analysis on Customer Landscape

The electrical weapons market forecasting report includes the adoption lifecycle of the market, covering from the innovator’s stage to the laggard’s stage. It focuses on adoption rates in different regions based on penetration. Furthermore, the electrical weapons market report also includes key purchase criteria and drivers of price sensitivity to help companies evaluate and develop their market growth analysis strategies.

Customer Landscape of Electrical Weapons Industry

Competitive Landscape

Companies are implementing various strategies, such as strategic alliances, electrical weapons market forecast, partnerships, mergers and acquisitions, geographical expansion, and product/service launches, to enhance their presence in the industry.

Albayraklar Group - Offers a portfolio of electrical weapons solutions, including conducted energy devices and sophisticated electronic warfare systems, for defense and law enforcement applications.

The industry research and growth report includes detailed analyses of the competitive landscape of the market and information about key companies, including:

  • Albayraklar Group
  • Almaz Antey Air and Space
  • Axon Enterprise Inc.
  • BAE Systems Plc
  • Chemring Group Plc
  • Combined Systems Inc.
  • Honeywell International Inc.
  • Less Lethal
  • Lockheed Martin Corp.
  • Mitsubishi Heavy Ltd.
  • Naval Group
  • Oberon Alpha
  • RTX Corp.
  • Shyn Sing Enterprise Co. Ltd.
  • StunTronics LLC
  • TBOTECH Safety and Security
  • Textron Inc.

Qualitative and quantitative analysis of companies has been conducted to help clients understand the wider business environment as well as the strengths and weaknesses of key industry players. Data is qualitatively analyzed to categorize companies as pure play, category-focused, industry-focused, and diversified; it is quantitatively analyzed to categorize companies as dominant, leading, strong, tentative, and weak.

Recent Development and News in Electrical weapons market

  • In August 2024, Lockheed Martin Corp. was selected by the United States Army to compete in the development of the Enduring High Energy Laser system, advancing efforts in military directed energy capabilities.
  • In September 2024, Oberon Alpha announced the completion of engineering updates for its HYBRID double-shot stun gun, targeting the device for professional service applications and enhancing its non-lethal offerings.
  • In November 2024, the Barrie Police Service in Canada identified the upgrade to the TASER 10 platform as a necessary modernization effort, signaling a move away from its obsolete X2 models.
  • In December 2024, the Minneapolis Police Department authorized a significant contract amendment with Axon Enterprise to replace its existing TASER 7 devices with the newer TASER 10 platform, citing the need for increased effective range in field operations.

Dive into Technavio’s robust research methodology, blending expert interviews, extensive data synthesis, and validated models for unparalleled Electrical Weapons Market insights. See full methodology.

Market Scope
Page number 290
Base year 2025
Historic period 2020-2024
Forecast period 2026-2030
Growth momentum & CAGR Accelerate at a CAGR of 16%
Market growth 2026-2030 USD 10696.4 million
Market structure Fragmented
YoY growth 2025-2026(%) 14.2%
Key countries US, Canada, Mexico, UK, Germany, France, Italy, Spain, The Netherlands, China, Japan, India, South Korea, Australia, Indonesia, Saudi Arabia, UAE, South Africa, Israel, Turkey, Brazil, Argentina and Chile
Competitive landscape Leading Companies, Market Positioning of Companies, Competitive Strategies, and Industry Risks

Request Free Sample

Research Analyst Overview

  • The electrical weapons market is characterized by rapid technological evolution, where network-centric warfare capabilities are becoming standard. This shift involves the integration of advanced sensors and IoT connectivity, enabling AI-driven targeting and superior digital situational awareness across tactical communication grids.
  • From a boardroom perspective, the adoption of virtual reality training for these complex systems is a critical investment decision, as it reduces certification costs by approximately 25% while improving operator proficiency with multi-shot devices. The development pipeline includes high energy lasers, high-power microwave systems, and sophisticated electronic countermeasure pods designed for counter-unmanned aerial system roles.
  • These non-lethal technologies, such as conducted energy devices that induce neuromuscular incapacitation, provide graduated force options. Innovations in signal processing technology are enhancing the effectiveness of electroshock weapons, including stun guns, tasers, and electrified batons, ensuring reliable pain compliance.
  • This focus on smart targeting and integration into unmanned systems underscores the industry's move toward highly interconnected and intelligent defense platforms, encompassing everything from electrified riot shields to electromagnetic deterrents and remote restraint devices.

What are the Key Data Covered in this Electrical Weapons Market Research and Growth Report?

  • What is the expected growth of the Electrical Weapons Market between 2026 and 2030?

    • USD 10.70 billion, at a CAGR of 16%

  • What segmentation does the market report cover?

    • The report is segmented by Type (Non-lethal, and Lethal), Product Type (Stun guns, Tasers, Directed energy weapons, and Others), End-user (Law enforcement, Military, and Others) and Geography (North America, Europe, APAC, Middle East and Africa, South America)

  • Which regions are analyzed in the report?

    • North America, Europe, APAC, Middle East and Africa and South America

  • What are the key growth drivers and market challenges?

    • Growing asymmetric warfare across world, Stringent regulatory norms related to electrical weapons

  • Who are the major players in the Electrical Weapons Market?

    • Albayraklar Group, Almaz Antey Air and Space, Axon Enterprise Inc., BAE Systems Plc, Chemring Group Plc, Combined Systems Inc., Honeywell International Inc., Less Lethal, Lockheed Martin Corp., Mitsubishi Heavy Ltd., Naval Group, Oberon Alpha, RTX Corp., Shyn Sing Enterprise Co. Ltd., StunTronics LLC, TBOTECH Safety and Security and Textron Inc.

Market Research Insights

  • The market's dynamics are shaped by a push for force modernization and enhanced de-escalation capabilities. Police modernization programs are driving procurement, with agencies seeing a 20% reduction in officer injuries when equipped with effective less-lethal alternatives. The adoption of integrated digital platforms that connect weapons to digital evidence management systems is improving officer accountability standards.
  • This shift is essential for addressing police reform initiatives and managing the use of force continuum effectively. In parallel, defense modernization is fueling demand for advanced tactical munitions for counter-terrorism operations and asymmetric threat response. Deployment of these technologies improves operational readiness by over 25%, ensuring strategic asset protection in volatile environments.

We can help! Our analysts can customize this electrical weapons market research report to meet your requirements.

Get in touch

1. Executive Summary

1.1 Market overview

Executive Summary - Chart on Market Overview
Executive Summary - Data Table on Market Overview
Executive Summary - Chart on Global Market Characteristics
Executive Summary - Chart on Market by Geography
Executive Summary - Chart on Market Segmentation by Type
Executive Summary - Chart on Market Segmentation by Product Type
Executive Summary - Chart on Market Segmentation by End-user
Executive Summary - Chart on Incremental Growth
Executive Summary - Data Table on Incremental Growth
Executive Summary - Chart on Company Market Positioning

2. Technavio Analysis

2.1 Analysis of price sensitivity, lifecycle, customer purchase basket, adoption rates, and purchase criteria

2.2 Criticality of inputs and Factors of differentiation

Chart on Overview on criticality of inputs and factors of differentiation

2.3 Factors of disruption

Chart on Overview on factors of disruption

2.4 Impact of drivers and challenges

Chart on Impact of drivers and challenges in 2025 and 2030

3. Market Landscape

3.1 Market ecosystem

Chart on Parent Market
Data Table on - Parent Market

3.2 Market characteristics

Chart on Market characteristics analysis

3.3 Value chain analysis

Chart on Value chain analysis

4. Market Sizing

4.1 Market definition

Data Table on Offerings of companies included in the market definition

4.2 Market segment analysis

Market segments

4.3 Market size 2025

4.4 Market outlook: Forecast for 2025-2030

Chart on Global - Market size and forecast 2025-2030 ($ million)
Data Table on Global - Market size and forecast 2025-2030 ($ million)
Chart on Global Market: Year-over-year growth 2025-2030 (%)
Data Table on Global Market: Year-over-year growth 2025-2030 (%)

5. Historic Market Size

5.1 Global Electrical Weapons Market 2020 - 2024

Historic Market Size - Data Table on Global Electrical Weapons Market 2020 - 2024 ($ million)

5.2 Type segment analysis 2020 - 2024

Historic Market Size - Type Segment 2020 - 2024 ($ million)

5.3 Product Type segment analysis 2020 - 2024

Historic Market Size - Product Type Segment 2020 - 2024 ($ million)

5.4 End-user segment analysis 2020 - 2024

Historic Market Size - End-user Segment 2020 - 2024 ($ million)

5.5 Geography segment analysis 2020 - 2024

Historic Market Size - Geography Segment 2020 - 2024 ($ million)

5.6 Country segment analysis 2020 - 2024

Historic Market Size - Country Segment 2020 - 2024 ($ million)

6. Qualitative Analysis

6.1 Impact of AI on Global Electrical Weapons Market

7. Five Forces Analysis

7.1 Five forces summary

Five forces analysis - Comparison between 2025 and 2030

7.2 Bargaining power of buyers

Bargaining power of buyers - Impact of key factors 2025 and 2030

7.3 Bargaining power of suppliers

Bargaining power of suppliers - Impact of key factors in 2025 and 2030

7.4 Threat of new entrants

Threat of new entrants - Impact of key factors in 2025 and 2030

7.5 Threat of substitutes

Threat of substitutes - Impact of key factors in 2025 and 2030

7.6 Threat of rivalry

Threat of rivalry - Impact of key factors in 2025 and 2030

7.7 Market condition

Chart on Market condition - Five forces 2025 and 2030

8. Market Segmentation by Type

8.1 Market segments

Chart on Type - Market share 2025-2030 (%)
Data Table on Type - Market share 2025-2030 (%)

8.2 Comparison by Type

Chart on Comparison by Type
Data Table on Comparison by Type

8.3 Non-lethal - Market size and forecast 2025-2030

Chart on Non-lethal - Market size and forecast 2025-2030 ($ million)
Data Table on Non-lethal - Market size and forecast 2025-2030 ($ million)
Chart on Non-lethal - Year-over-year growth 2025-2030 (%)
Data Table on Non-lethal - Year-over-year growth 2025-2030 (%)

8.4 Lethal - Market size and forecast 2025-2030

Chart on Lethal - Market size and forecast 2025-2030 ($ million)
Data Table on Lethal - Market size and forecast 2025-2030 ($ million)
Chart on Lethal - Year-over-year growth 2025-2030 (%)
Data Table on Lethal - Year-over-year growth 2025-2030 (%)

8.5 Market opportunity by Type

Market opportunity by Type ($ million)
Data Table on Market opportunity by Type ($ million)

9. Market Segmentation by Product Type

9.1 Market segments

Chart on Product Type - Market share 2025-2030 (%)
Data Table on Product Type - Market share 2025-2030 (%)

9.2 Comparison by Product Type

Chart on Comparison by Product Type
Data Table on Comparison by Product Type

9.3 Stun guns - Market size and forecast 2025-2030

Chart on Stun guns - Market size and forecast 2025-2030 ($ million)
Data Table on Stun guns - Market size and forecast 2025-2030 ($ million)
Chart on Stun guns - Year-over-year growth 2025-2030 (%)
Data Table on Stun guns - Year-over-year growth 2025-2030 (%)

9.4 Tasers - Market size and forecast 2025-2030

Chart on Tasers - Market size and forecast 2025-2030 ($ million)
Data Table on Tasers - Market size and forecast 2025-2030 ($ million)
Chart on Tasers - Year-over-year growth 2025-2030 (%)
Data Table on Tasers - Year-over-year growth 2025-2030 (%)

9.5 Directed energy weapons - Market size and forecast 2025-2030

Chart on Directed energy weapons - Market size and forecast 2025-2030 ($ million)
Data Table on Directed energy weapons - Market size and forecast 2025-2030 ($ million)
Chart on Directed energy weapons - Year-over-year growth 2025-2030 (%)
Data Table on Directed energy weapons - Year-over-year growth 2025-2030 (%)

9.6 Others - Market size and forecast 2025-2030

Chart on Others - Market size and forecast 2025-2030 ($ million)
Data Table on Others - Market size and forecast 2025-2030 ($ million)
Chart on Others - Year-over-year growth 2025-2030 (%)
Data Table on Others - Year-over-year growth 2025-2030 (%)

9.7 Market opportunity by Product Type

Market opportunity by Product Type ($ million)
Data Table on Market opportunity by Product Type ($ million)

10. Market Segmentation by End-user

10.1 Market segments

Chart on End-user - Market share 2025-2030 (%)
Data Table on End-user - Market share 2025-2030 (%)

10.2 Comparison by End-user

Chart on Comparison by End-user
Data Table on Comparison by End-user

10.3 Law enforcement - Market size and forecast 2025-2030

Chart on Law enforcement - Market size and forecast 2025-2030 ($ million)
Data Table on Law enforcement - Market size and forecast 2025-2030 ($ million)
Chart on Law enforcement - Year-over-year growth 2025-2030 (%)
Data Table on Law enforcement - Year-over-year growth 2025-2030 (%)

10.4 Military - Market size and forecast 2025-2030

Chart on Military - Market size and forecast 2025-2030 ($ million)
Data Table on Military - Market size and forecast 2025-2030 ($ million)
Chart on Military - Year-over-year growth 2025-2030 (%)
Data Table on Military - Year-over-year growth 2025-2030 (%)

10.5 Others - Market size and forecast 2025-2030

Chart on Others - Market size and forecast 2025-2030 ($ million)
Data Table on Others - Market size and forecast 2025-2030 ($ million)
Chart on Others - Year-over-year growth 2025-2030 (%)
Data Table on Others - Year-over-year growth 2025-2030 (%)

10.6 Market opportunity by End-user

Market opportunity by End-user ($ million)
Data Table on Market opportunity by End-user ($ million)

11. Customer Landscape

11.1 Customer landscape overview

Analysis of price sensitivity, lifecycle, customer purchase basket, adoption rates, and purchase criteria

12. Geographic Landscape

12.1 Geographic segmentation

Chart on Market share by geography 2025-2030 (%)
Data Table on Market share by geography 2025-2030 (%)

12.2 Geographic comparison

Chart on Geographic comparison
Data Table on Geographic comparison

12.3 North America - Market size and forecast 2025-2030

Chart on North America - Market size and forecast 2025-2030 ($ million)
Data Table on North America - Market size and forecast 2025-2030 ($ million)
Chart on North America - Year-over-year growth 2025-2030 (%)
Data Table on North America - Year-over-year growth 2025-2030 (%)
Chart on Regional Comparison - North America
Data Table on Regional Comparison - North America

12.3.1 US - Market size and forecast 2025-2030

Chart on US - Market size and forecast 2025-2030 ($ million)
Data Table on US - Market size and forecast 2025-2030 ($ million)
Chart on US - Year-over-year growth 2025-2030 (%)
Data Table on US - Year-over-year growth 2025-2030 (%)

12.3.2 Canada - Market size and forecast 2025-2030

Chart on Canada - Market size and forecast 2025-2030 ($ million)
Data Table on Canada - Market size and forecast 2025-2030 ($ million)
Chart on Canada - Year-over-year growth 2025-2030 (%)
Data Table on Canada - Year-over-year growth 2025-2030 (%)

12.3.3 Mexico - Market size and forecast 2025-2030

Chart on Mexico - Market size and forecast 2025-2030 ($ million)
Data Table on Mexico - Market size and forecast 2025-2030 ($ million)
Chart on Mexico - Year-over-year growth 2025-2030 (%)
Data Table on Mexico - Year-over-year growth 2025-2030 (%)

12.4 Europe - Market size and forecast 2025-2030

Chart on Europe - Market size and forecast 2025-2030 ($ million)
Data Table on Europe - Market size and forecast 2025-2030 ($ million)
Chart on Europe - Year-over-year growth 2025-2030 (%)
Data Table on Europe - Year-over-year growth 2025-2030 (%)
Chart on Regional Comparison - Europe
Data Table on Regional Comparison - Europe

12.4.1 UK - Market size and forecast 2025-2030

Chart on UK - Market size and forecast 2025-2030 ($ million)
Data Table on UK - Market size and forecast 2025-2030 ($ million)
Chart on UK - Year-over-year growth 2025-2030 (%)
Data Table on UK - Year-over-year growth 2025-2030 (%)

12.4.2 Germany - Market size and forecast 2025-2030

Chart on Germany - Market size and forecast 2025-2030 ($ million)
Data Table on Germany - Market size and forecast 2025-2030 ($ million)
Chart on Germany - Year-over-year growth 2025-2030 (%)
Data Table on Germany - Year-over-year growth 2025-2030 (%)

12.4.3 France - Market size and forecast 2025-2030

Chart on France - Market size and forecast 2025-2030 ($ million)
Data Table on France - Market size and forecast 2025-2030 ($ million)
Chart on France - Year-over-year growth 2025-2030 (%)
Data Table on France - Year-over-year growth 2025-2030 (%)

12.4.4 Italy - Market size and forecast 2025-2030

Chart on Italy - Market size and forecast 2025-2030 ($ million)
Data Table on Italy - Market size and forecast 2025-2030 ($ million)
Chart on Italy - Year-over-year growth 2025-2030 (%)
Data Table on Italy - Year-over-year growth 2025-2030 (%)

12.4.5 Spain - Market size and forecast 2025-2030

Chart on Spain - Market size and forecast 2025-2030 ($ million)
Data Table on Spain - Market size and forecast 2025-2030 ($ million)
Chart on Spain - Year-over-year growth 2025-2030 (%)
Data Table on Spain - Year-over-year growth 2025-2030 (%)

12.4.6 The Netherlands - Market size and forecast 2025-2030

Chart on The Netherlands - Market size and forecast 2025-2030 ($ million)
Data Table on The Netherlands - Market size and forecast 2025-2030 ($ million)
Chart on The Netherlands - Year-over-year growth 2025-2030 (%)
Data Table on The Netherlands - Year-over-year growth 2025-2030 (%)

12.5 APAC - Market size and forecast 2025-2030

Chart on APAC - Market size and forecast 2025-2030 ($ million)
Data Table on APAC - Market size and forecast 2025-2030 ($ million)
Chart on APAC - Year-over-year growth 2025-2030 (%)
Data Table on APAC - Year-over-year growth 2025-2030 (%)
Chart on Regional Comparison - APAC
Data Table on Regional Comparison - APAC

12.5.1 China - Market size and forecast 2025-2030

Chart on China - Market size and forecast 2025-2030 ($ million)
Data Table on China - Market size and forecast 2025-2030 ($ million)
Chart on China - Year-over-year growth 2025-2030 (%)
Data Table on China - Year-over-year growth 2025-2030 (%)

12.5.2 Japan - Market size and forecast 2025-2030

Chart on Japan - Market size and forecast 2025-2030 ($ million)
Data Table on Japan - Market size and forecast 2025-2030 ($ million)
Chart on Japan - Year-over-year growth 2025-2030 (%)
Data Table on Japan - Year-over-year growth 2025-2030 (%)

12.5.3 India - Market size and forecast 2025-2030

Chart on India - Market size and forecast 2025-2030 ($ million)
Data Table on India - Market size and forecast 2025-2030 ($ million)
Chart on India - Year-over-year growth 2025-2030 (%)
Data Table on India - Year-over-year growth 2025-2030 (%)

12.5.4 South Korea - Market size and forecast 2025-2030

Chart on South Korea - Market size and forecast 2025-2030 ($ million)
Data Table on South Korea - Market size and forecast 2025-2030 ($ million)
Chart on South Korea - Year-over-year growth 2025-2030 (%)
Data Table on South Korea - Year-over-year growth 2025-2030 (%)

12.5.5 Australia - Market size and forecast 2025-2030

Chart on Australia - Market size and forecast 2025-2030 ($ million)
Data Table on Australia - Market size and forecast 2025-2030 ($ million)
Chart on Australia - Year-over-year growth 2025-2030 (%)
Data Table on Australia - Year-over-year growth 2025-2030 (%)

12.5.6 Indonesia - Market size and forecast 2025-2030

Chart on Indonesia - Market size and forecast 2025-2030 ($ million)
Data Table on Indonesia - Market size and forecast 2025-2030 ($ million)
Chart on Indonesia - Year-over-year growth 2025-2030 (%)
Data Table on Indonesia - Year-over-year growth 2025-2030 (%)

12.6 Middle East and Africa - Market size and forecast 2025-2030

Chart on Middle East and Africa - Market size and forecast 2025-2030 ($ million)
Data Table on Middle East and Africa - Market size and forecast 2025-2030 ($ million)
Chart on Middle East and Africa - Year-over-year growth 2025-2030 (%)
Data Table on Middle East and Africa - Year-over-year growth 2025-2030 (%)
Chart on Regional Comparison - Middle East and Africa
Data Table on Regional Comparison - Middle East and Africa

12.6.1 Saudi Arabia - Market size and forecast 2025-2030

Chart on Saudi Arabia - Market size and forecast 2025-2030 ($ million)
Data Table on Saudi Arabia - Market size and forecast 2025-2030 ($ million)
Chart on Saudi Arabia - Year-over-year growth 2025-2030 (%)
Data Table on Saudi Arabia - Year-over-year growth 2025-2030 (%)

12.6.2 UAE - Market size and forecast 2025-2030

Chart on UAE - Market size and forecast 2025-2030 ($ million)
Data Table on UAE - Market size and forecast 2025-2030 ($ million)
Chart on UAE - Year-over-year growth 2025-2030 (%)
Data Table on UAE - Year-over-year growth 2025-2030 (%)

12.6.3 South Africa - Market size and forecast 2025-2030

Chart on South Africa - Market size and forecast 2025-2030 ($ million)
Data Table on South Africa - Market size and forecast 2025-2030 ($ million)
Chart on South Africa - Year-over-year growth 2025-2030 (%)
Data Table on South Africa - Year-over-year growth 2025-2030 (%)

12.6.4 Israel - Market size and forecast 2025-2030

Chart on Israel - Market size and forecast 2025-2030 ($ million)
Data Table on Israel - Market size and forecast 2025-2030 ($ million)
Chart on Israel - Year-over-year growth 2025-2030 (%)
Data Table on Israel - Year-over-year growth 2025-2030 (%)

12.6.5 Turkey - Market size and forecast 2025-2030

Chart on Turkey - Market size and forecast 2025-2030 ($ million)
Data Table on Turkey - Market size and forecast 2025-2030 ($ million)
Chart on Turkey - Year-over-year growth 2025-2030 (%)
Data Table on Turkey - Year-over-year growth 2025-2030 (%)

12.7 South America - Market size and forecast 2025-2030

Chart on South America - Market size and forecast 2025-2030 ($ million)
Data Table on South America - Market size and forecast 2025-2030 ($ million)
Chart on South America - Year-over-year growth 2025-2030 (%)
Data Table on South America - Year-over-year growth 2025-2030 (%)
Chart on Regional Comparison - South America
Data Table on Regional Comparison - South America

12.7.1 Brazil - Market size and forecast 2025-2030

Chart on Brazil - Market size and forecast 2025-2030 ($ million)
Data Table on Brazil - Market size and forecast 2025-2030 ($ million)
Chart on Brazil - Year-over-year growth 2025-2030 (%)
Data Table on Brazil - Year-over-year growth 2025-2030 (%)

12.7.2 Argentina - Market size and forecast 2025-2030

Chart on Argentina - Market size and forecast 2025-2030 ($ million)
Data Table on Argentina - Market size and forecast 2025-2030 ($ million)
Chart on Argentina - Year-over-year growth 2025-2030 (%)
Data Table on Argentina - Year-over-year growth 2025-2030 (%)

12.7.3 Chile - Market size and forecast 2025-2030

Chart on Chile - Market size and forecast 2025-2030 ($ million)
Data Table on Chile - Market size and forecast 2025-2030 ($ million)
Chart on Chile - Year-over-year growth 2025-2030 (%)
Data Table on Chile - Year-over-year growth 2025-2030 (%)

12.8 Market opportunity by geography

Market opportunity by geography ($ million)
Data Tables on Market opportunity by geography ($ million)

13. Drivers, Challenges, and Opportunity

13.1 Market drivers

Growing asymmetric warfare across world
Significant focus on ISR operations
Increasing investment on weapons

13.2 Market challenges

Stringent regulatory norms related to electrical weapons
High cost of development of electrical weapons
Arms trafficking across various parts of globe

13.3 Impact of drivers and challenges

Impact of drivers and challenges in 2025 and 2030

13.4 Market opportunities

Growth in battlefield digitization
Emergence of multi-featured electrical weapon systems
Advanced battery life and pulse modulation

14. Competitive Landscape

14.1 Overview

14.2

Overview on criticality of inputs and factors of differentiation

14.3 Landscape disruption

Overview on factors of disruption

14.4 Industry risks

Impact of key risks on business

15. Competitive Analysis

15.1 Companies profiled

Companies covered

15.2 Company ranking index

15.3 Market positioning of companies

Matrix on companies position and classification

15.4 Albayraklar Group

Albayraklar Group - Overview
Albayraklar Group - Product / Service
Albayraklar Group - Key offerings
SWOT

15.5 Almaz Antey Air and Space

Almaz Antey Air and Space - Overview
Almaz Antey Air and Space - Product / Service
Almaz Antey Air and Space - Key offerings
SWOT

15.6 Axon Enterprise Inc.

Axon Enterprise Inc. - Overview
Axon Enterprise Inc. - Business segments
Axon Enterprise Inc. - Key news
Axon Enterprise Inc. - Key offerings
Axon Enterprise Inc. - Segment focus
SWOT

15.7 BAE Systems Plc

BAE Systems Plc - Overview
BAE Systems Plc - Business segments
BAE Systems Plc - Key news
BAE Systems Plc - Key offerings
BAE Systems Plc - Segment focus
SWOT

15.8 Chemring Group Plc

Chemring Group Plc - Overview
Chemring Group Plc - Business segments
Chemring Group Plc - Key offerings
Chemring Group Plc - Segment focus
SWOT

15.9 Combined Systems Inc.

Combined Systems Inc. - Overview
Combined Systems Inc. - Product / Service
Combined Systems Inc. - Key offerings
SWOT

15.10 Honeywell International Inc.

Honeywell International Inc. - Overview
Honeywell International Inc. - Business segments
Honeywell International Inc. - Key news
Honeywell International Inc. - Key offerings
Honeywell International Inc. - Segment focus
SWOT

15.11 Less Lethal

Less Lethal - Overview
Less Lethal - Product / Service
Less Lethal - Key offerings
SWOT

15.12 Lockheed Martin Corp.

Lockheed Martin Corp. - Overview
Lockheed Martin Corp. - Business segments
Lockheed Martin Corp. - Key news
Lockheed Martin Corp. - Key offerings
Lockheed Martin Corp. - Segment focus
SWOT

15.13 Mitsubishi Heavy Ltd.

Mitsubishi Heavy Ltd. - Overview
Mitsubishi Heavy Ltd. - Business segments
Mitsubishi Heavy Ltd. - Key news
Mitsubishi Heavy Ltd. - Key offerings
Mitsubishi Heavy Ltd. - Segment focus
SWOT

15.14 Naval Group

Naval Group - Overview
Naval Group - Product / Service
Naval Group - Key offerings
SWOT

15.15 Oberon Alpha

Oberon Alpha - Overview
Oberon Alpha - Product / Service
Oberon Alpha - Key offerings
SWOT

15.16 RTX Corp.

RTX Corp. - Overview
RTX Corp. - Business segments
RTX Corp. - Key news
RTX Corp. - Key offerings
RTX Corp. - Segment focus
SWOT

15.17 StunTronics LLC

StunTronics LLC - Overview
StunTronics LLC - Product / Service
StunTronics LLC - Key offerings
SWOT

15.18 Textron Inc.

Textron Inc. - Overview
Textron Inc. - Business segments
Textron Inc. - Key offerings
Textron Inc. - Segment focus
SWOT

16. Appendix

16.1 Scope of the report

Market definition
Objectives
Notes and caveats

16.2 Inclusions and exclusions checklist

Inclusions checklist
Exclusions checklist

16.3 Currency conversion rates for US$

16.4 Research methodology

16.5 Data procurement

Information sources

16.6 Data validation

16.7 Validation techniques employed for market sizing

16.8 Data synthesis

16.9 360 degree market analysis

16.10 List of abbreviations

Research Methodology

Technavio presents a detailed picture of the market by way of study, synthesis, and summation of data from multiple sources. The analysts have presented the various facets of the market with a particular focus on identifying the key industry influencers. The data thus presented is comprehensive, reliable, and the result of extensive research, both primary and secondary.

INFORMATION SOURCES

Primary sources

  • Manufacturers and suppliers
  • Channel partners
  • Industry experts
  • Strategic decision makers

Secondary sources

  • Industry journals and periodicals
  • Government data
  • Financial reports of key industry players
  • Historical data
  • Press releases

DATA ANALYSIS

Data Synthesis

  • Collation of data
  • Estimation of key figures
  • Analysis of derived insights

Data Validation

  • Triangulation with data models
  • Reference against proprietary databases
  • Corroboration with industry experts

REPORT WRITING

Qualitative

  • Market drivers
  • Market challenges
  • Market trends
  • Five forces analysis

Quantitative

  • Market size and forecast
  • Market segmentation
  • Geographical insights
  • Competitive landscape

Interested in this report?

Get your sample now to see our research methodology and insights!

Download Now

Frequently Asked Questions

Electrical Weapons market growth will increase by USD 10696.4 million during 2026-2030.

The Electrical Weapons market is expected to grow at a CAGR of 16% during 2026-2030.

Electrical Weapons market is segmented by Type (Non-lethal, Lethal) Product type (Stun guns, Tasers, Directed energy weapons, Others) End-user (Law enforcement, Military, Others)

Albayraklar Group, Almaz Antey Air and Space, Axon Enterprise Inc., BAE Systems Plc, Chemring Group Plc, Combined Systems Inc., Honeywell International Inc., Less Lethal, Lockheed Martin Corp., Mitsubishi Heavy Ltd., Naval Group, Oberon Alpha, RTX Corp., Shyn Sing Enterprise Co. Ltd., StunTronics LLC, TBOTECH Safety and Security, Textron Inc. are a few of the key vendors in the Electrical Weapons market.

North America will register the highest growth rate of 37.8% among the other regions. Therefore, the Electrical Weapons market in North America is expected to garner significant business opportunities for the vendors during the forecast period.

US, Canada, Mexico, UK, Germany, France, Italy, Spain, The Netherlands, China, Japan, India, South Korea, Australia, Indonesia, Saudi Arabia, UAE, South Africa, Israel, Turkey, Brazil, Argentina, Chile

  • Growing asymmetric warfare across world is the driving factor this market.

The Electrical Weapons market vendors should focus on grabbing business opportunities from the Type segment as it accounted for the largest market share in the base year.