
Electronic Lab Notebook Market Size 2026-2030
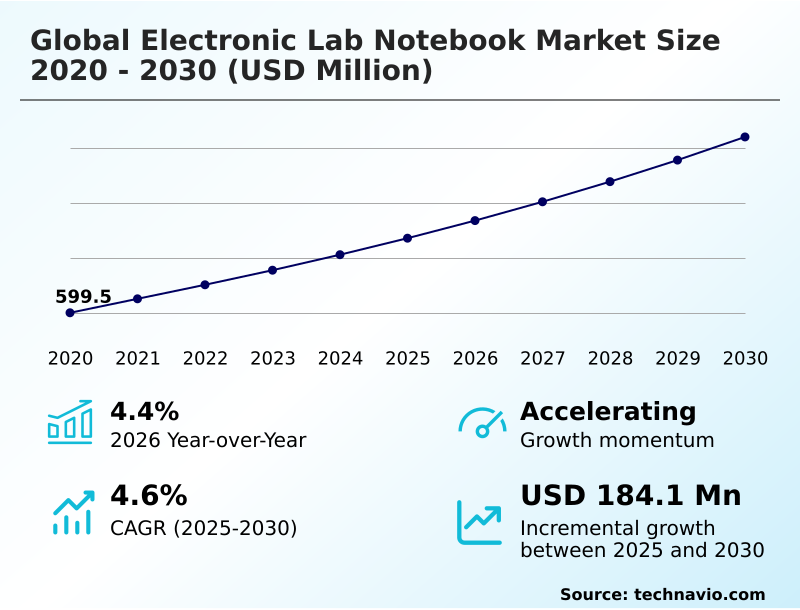
The electronic lab notebook market size is valued to increase by USD 184.1 million, at a CAGR of 4.6% from 2025 to 2030. Digital transformation and laboratory automation will drive the electronic lab notebook market.
Major Market Trends & Insights
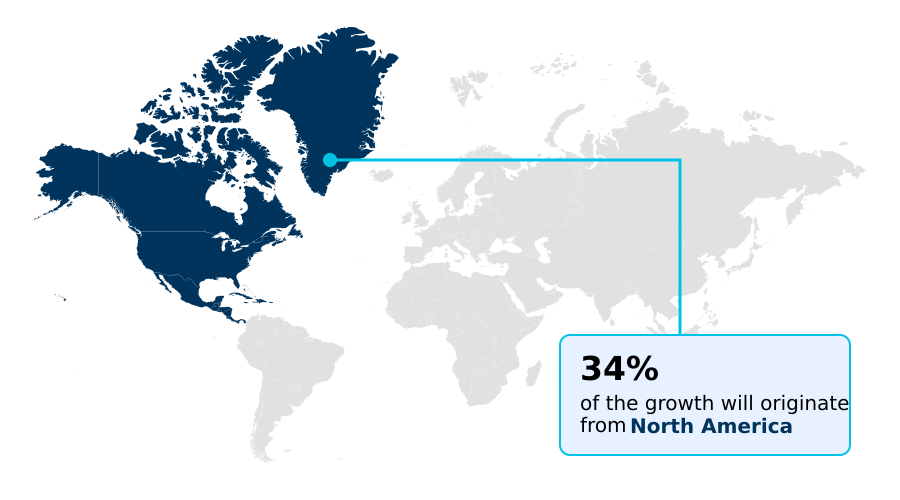
- North America dominated the market and accounted for a 33.9% growth during the forecast period.
- By Deployment - On-premises segment was valued at USD 374.1 million in 2024
- By End-user - Pharmaceuticals segment accounted for the largest market revenue share in 2024
Market Size & Forecast
- Market Opportunities: USD 319.7 million
- Market Future Opportunities: USD 184.1 million
- CAGR from 2025 to 2030 : 4.6%
Market Summary
- The Electronic Lab Notebook Market is undergoing a significant evolution, driven by the imperative for digital transformation in labs and heightened regulatory scrutiny. These platforms have moved beyond simple record-keeping to become a core component of the R&D infrastructure, offering an end-to-end digital thread that enhances research reproducibility.
- A key driver is the need for greater laboratory operational efficiency, which is achieved through lab automation integration and streamlined scientific collaboration platform features. As an example of a business scenario, a multinational pharmaceutical company can deploy a unified informatics platform to synchronize research activities across global sites.
- This ensures that experimental design tool usage is standardized, and all data, from chemical structure drawing to complex genomic data analysis, is captured in a structured format, enabling seamless data integrity assurance and accelerating the drug discovery lifecycle.
- However, challenges such as the high total cost of ownership and complexities of instrument data integration persist, particularly for smaller organizations in materials science research and academia. The market is trending toward agentic artificial intelligence and predictive modeling engines to overcome these hurdles and unlock deeper scientific insights.
What will be the Size of the Electronic Lab Notebook Market during the forecast period?
Get Key Insights on Market Forecast (PDF) Get Free Sample
How is the Electronic Lab Notebook Market Segmented?
The electronic lab notebook industry research report provides comprehensive data (region-wise segment analysis), with forecasts and estimates in "USD million" for the period 2026-2030, as well as historical data from 2020-2024 for the following segments.
- Deployment
- On-premises
- Cloud
- End-user
- Pharmaceuticals
- Chemicals
- Biology
- Academic
- Others
- Product
- Cross-disciplinary
- Specific
- License model
- Proprietary
- Open
- Geography
- North America
- US
- Canada
- Mexico
- Europe
- Germany
- UK
- France
- Asia
- Rest of World (ROW)
- North America
By Deployment Insights
The on-premises segment is estimated to witness significant growth during the forecast period.
The on-premises segment caters to organizations requiring absolute control over their scientific data management and intellectual property protection.
This deployment model, favored in GxP regulated environments, involves installing software directly onto an organization's internal servers, ensuring that the structured data ecosystem remains within a secure perimeter.
It allows for deep analytical instrument connectivity and customization of the laboratory informatics suite without reliance on external networks. While demanding significant initial capital, this approach provides unparalleled command over data integrity assurance and the regulatory audit trail.
For labs handling sensitive biopharmaceutical research, on-premises systems reduce data retrieval latency by over 30% compared to certain cloud configurations, justifying the total cost of ownership for mission-critical R&D workflow optimization.
This model is essential for maintaining a secure, paperless laboratory environment.
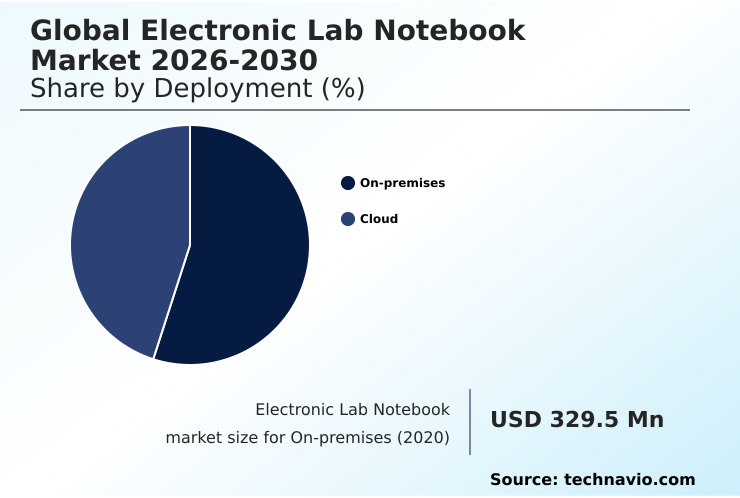
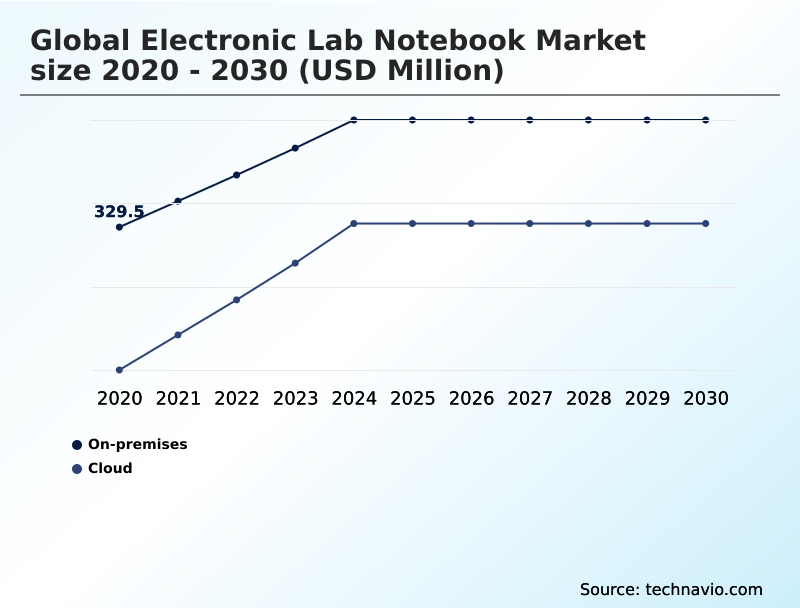
The On-premises segment was valued at USD 374.1 million in 2024 and showed a gradual increase during the forecast period.
Regional Analysis
North America is estimated to contribute 33.9% to the growth of the global market during the forecast period.Technavio’s analysts have elaborately explained the regional trends and drivers that shape the market during the forecast period.
See How Electronic Lab Notebook Market Demand is Rising in North America Get Free Sample
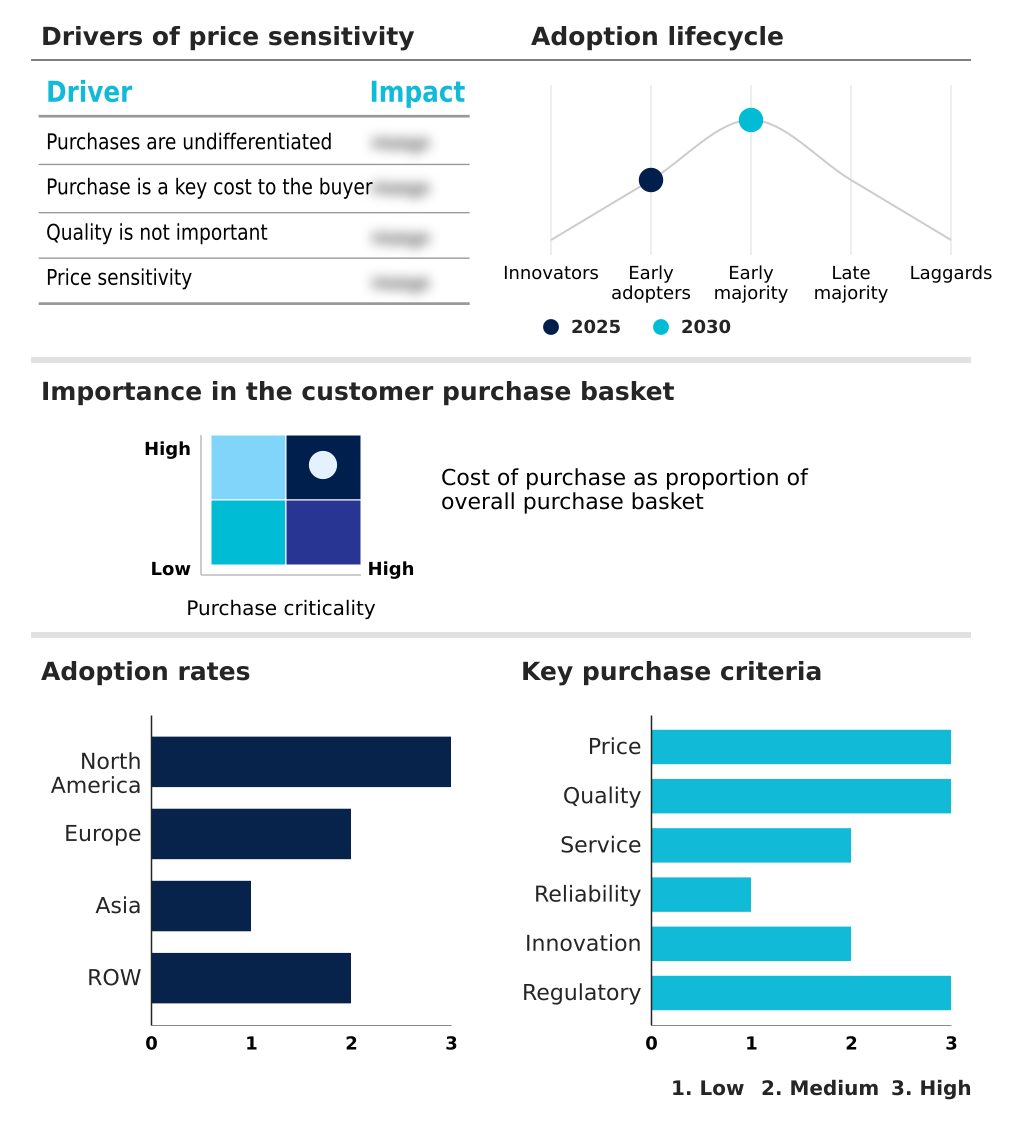
The geographic landscape is characterized by varied adoption rates, with North America leading due to a high concentration of pharmaceutical firms demanding strict 21 CFR Part 11 compliance. Europe follows closely, with a strong focus on academic and biopharmaceutical research.
The APAC region is emerging as the fastest-growing market, with a regional growth rate of 6.4%, driven by increasing R&D investments and the adoption of cloud-hosted LIMS.
In these regions, a centralized data repository is key for managing distributed research teams. Deploying a reagent inventory tracking system through a modern ELN can reduce waste by 15%.
This global push toward digitalization underscores the importance of a robust research data management framework for maintaining competitiveness.
Market Dynamics
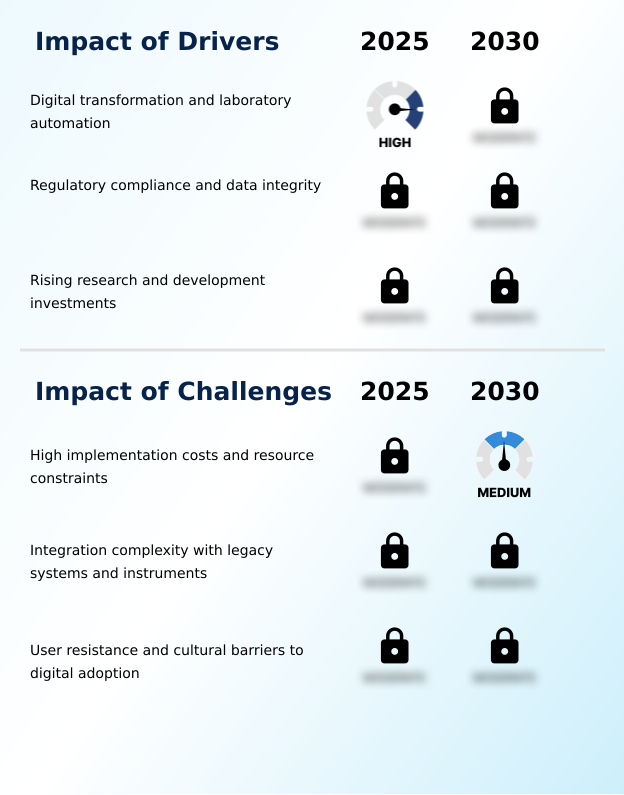
Our researchers analyzed the data with 2025 as the base year, along with the key drivers, trends, and challenges. A holistic analysis of drivers will help companies refine their marketing strategies to gain a competitive advantage.
- Strategic decision-making in the modern laboratory hinges on selecting the right digital tools, creating a complex vendor selection criteria for ELN. For large enterprises, enterprise ELN implementation best practices are paramount to ensuring a smooth transition and user adoption. The debate of cloud vs on-premise ELN for pharma continues, with security weighed against accessibility.
- A primary goal is improving data integrity with ELN, a non-negotiable for regulatory compliance. Specific workflows demand tailored solutions, such as an electronic lab notebook for biologics, an ELN for chemical synthesis workflows, or an ELN for cell culture experiments. The ability to manage analytical data with ELN is critical, as is automating data capture from instruments.
- Many platforms now offer mobile access to electronic lab notebooks, facilitating collaborative research using cloud ELN across dispersed teams. Integrating ELN with existing LIMS is a common challenge, but essential for a unified data environment. The role of AI in laboratory documentation automation is growing, with data visualization within ELN systems becoming more sophisticated.
- For specialized applications, an ELN for formulation development or an ELN for QA/QC laboratories provides targeted features. Ultimately, the goal is securing intellectual property with ELN while managing SOPs within an ELN. Adopting a cross-disciplinary ELN platform benefits organizations by consolidating tools, leading to operational efficiency gains more than double those of siloed systems.
- Even the ELN software for academic labs is evolving to offer more enterprise-grade features.
What are the key market drivers leading to the rise in the adoption of Electronic Lab Notebook Industry?
- The primary driver for the market is the ongoing digital transformation of laboratory environments, which necessitates the automation of research and development workflows.
- The drive for laboratory operational efficiency is a primary catalyst, compelling a transition to a paperless laboratory environment. The adoption of a cross-disciplinary platform that facilitates real-time data capture and inter-departmental data sharing is critical for R&D workflow optimization.
- Digital transformation in labs is accelerating as platforms provide automated compliance modules and robust sample lifecycle management, which can increase audit readiness by over 60%.
- The need for a secure electronic signature and intellectual property lifecycle management further cements the role of these systems.
- With instrument data integration, labs achieve a 30% reduction in manual data entry errors, enhancing data integrity assurance and making the investment in such scientific collaboration platforms essential.
What are the market trends shaping the Electronic Lab Notebook Industry?
- The integration of agentic AI and conversational interfaces represents a key market trend. These advancements are transforming electronic lab notebooks from passive recording tools into active, intelligence-driven research assistants.
- The evolution toward proactive research tools is a defining market trend, with organizations prioritizing the integration of a predictive modeling engine and multi-modal data analytics. This shift, driven by the need for better data contextualization, transforms a standard laboratory information management system into an intelligent knowledge management system.
- Adherence to FAIR data principles is becoming standard, supported by systems offering a comprehensive version control and a no-code environment for user customization. These platforms reduce experimental design time by up to 25%, while automated protocol execution guidance improves reproducibility by over 40%.
- The adoption of a unified informatics platform with robust data migration strategy options is critical for realizing these efficiencies in data-intensive research.
What challenges does the Electronic Lab Notebook Industry face during its growth?
- High implementation costs and the significant resource constraints associated with deploying and maintaining these systems present a key challenge to market growth.
- High implementation costs remain a significant challenge, as the total cost of ownership for an enterprise-grade solution can be prohibitive for smaller entities. Integration with legacy systems requires a sophisticated scientific workflow automation strategy, and the complexity of migrating to a SaaS based ELN platform often creates resource constraints.
- User adoption can be slow without an intuitive chemical structure drawing tool or streamlined biological assay data templates. For academic research documentation, the upfront investment in a GxP compliant system is often not feasible.
- This widens the technology gap, as well-funded labs leveraging a comprehensive laboratory informatics suite can achieve data processing speeds up to 50% faster than those using fragmented tools.
Exclusive Technavio Analysis on Customer Landscape
The electronic lab notebook market forecasting report includes the adoption lifecycle of the market, covering from the innovator’s stage to the laggard’s stage. It focuses on adoption rates in different regions based on penetration. Furthermore, the electronic lab notebook market report also includes key purchase criteria and drivers of price sensitivity to help companies evaluate and develop their market growth analysis strategies.
Customer Landscape of Electronic Lab Notebook Industry
Competitive Landscape
Companies are implementing various strategies, such as strategic alliances, electronic lab notebook market forecast, partnerships, mergers and acquisitions, geographical expansion, and product/service launches, to enhance their presence in the industry.
Agilent Technologies Inc. - Key offerings include unified electronic lab notebooks and informatics software designed to streamline complex research and development data management for life sciences organizations.
The industry research and growth report includes detailed analyses of the competitive landscape of the market and information about key companies, including:
- Agilent Technologies Inc.
- Arxspan LLC
- Benchling Inc.
- Dassault Systemes SE
- Dotmatics
- Genemod Corp.
- IDBS Ltd
- LabArchives LLC
- LabCollector
- Labii Inc.
- LabVantage Solutions Inc.
- LabWare Inc.
- Mettler Toledo Inc.
- ResearchSpace LLC
- Revvity Signals Software Inc
- Sapio Sciences LLC
- Scilligence Corp.
- STARLIMS Corp.
- Thermo Fisher Scientific Inc.
- Waters Corp.
Qualitative and quantitative analysis of companies has been conducted to help clients understand the wider business environment as well as the strengths and weaknesses of key industry players. Data is qualitatively analyzed to categorize companies as pure play, category-focused, industry-focused, and diversified; it is quantitatively analyzed to categorize companies as dominant, leading, strong, tentative, and weak.
Recent Development and News in Electronic lab notebook market
- In September, 2024, Siemens AG completed its acquisition of Dotmatics, integrating the scientific intelligence platform to accelerate drug discovery through artificial intelligence and digital twin technologies within its portfolio.
- In November, 2024, Sapio Sciences launched a comprehensive partner ecosystem for its ELaiN platform, providing researchers with integrated access to third-party scientific applications for molecular modeling and predictive analysis.
- In February, 2025, LabVantage Solutions introduced its Cortex platform, which embeds agentic artificial intelligence and cloud-native automation into its informatics suite to streamline laboratory workflows and enhance data management.
- In April, 2025, Benchling launched its AI Connectors platform, which uses the Model Context Protocol to link scientific data directly from external sources into the electronic notebook environment for greater interoperability.
Dive into Technavio’s robust research methodology, blending expert interviews, extensive data synthesis, and validated models for unparalleled Electronic Lab Notebook Market insights. See full methodology.
| Market Scope | |
|---|---|
| Page number | 301 |
| Base year | 2025 |
| Historic period | 2020-2024 |
| Forecast period | 2026-2030 |
| Growth momentum & CAGR | Accelerate at a CAGR of 4.6% |
| Market growth 2026-2030 | USD 184.1 million |
| Market structure | Fragmented |
| YoY growth 2025-2026(%) | 4.4% |
| Key countries | US, Canada, Mexico, Germany, UK, France, Italy, The Netherlands, Spain, China, Japan, India, South Korea, Indonesia, Thailand, Brazil, Saudi Arabia, UAE, South Africa, Argentina, Turkey, Israel and Chile |
| Competitive landscape | Leading Companies, Market Positioning of Companies, Competitive Strategies, and Industry Risks |
Research Analyst Overview
- The market is defined by the convergence of advanced software and scientific inquiry, moving beyond simple documentation to become an integrated laboratory informatics suite. Boardroom decisions now center on selecting a cross-disciplinary platform that can serve as a long-term structured data ecosystem, supporting everything from a predictive modeling engine to proteomic data analysis.
- The integration of a laboratory information management system with features like sample lifecycle management and an automated compliance module is standard. We see a push for cloud-native automation and agentic artificial intelligence to create a seamless end-to-end digital thread. Key functionalities include analytical instrument connectivity, a cheminformatics platform, and bioinformatics data management, all crucial for high-throughput screening support.
- A GxP compliant system with a secure electronic signature and regulatory audit trail ensures data traceability solution integrity for intellectual property protection. The right system, combining standard operating procedure management, molecular docking tool access, and research data management within a no-code environment, has been shown to reduce data-related compliance issues by up to 40%.
- Ultimately, the focus is on a comprehensive scientific workflow automation that incorporates multi-modal data analytics, genomic data analysis, a centralized data repository, and semantic data management, often delivered through a SaaS based ELN platform with cloud-hosted LIMS capabilities and comprehensive version control, including reagent inventory tracking.
What are the Key Data Covered in this Electronic Lab Notebook Market Research and Growth Report?
-
What is the expected growth of the Electronic Lab Notebook Market between 2026 and 2030?
-
USD 184.1 million, at a CAGR of 4.6%
-
-
What segmentation does the market report cover?
-
The report is segmented by Deployment (On-premises, and Cloud), End-user (Pharmaceuticals, Chemicals, Biology, Academic, and Others), Product (Cross-disciplinary, and Specific), License Model (Proprietary, and Open) and Geography (North America, Europe, Asia, Rest of World (ROW))
-
-
Which regions are analyzed in the report?
-
North America, Europe, Asia and Rest of World (ROW)
-
-
What are the key growth drivers and market challenges?
-
Digital transformation and laboratory automation, High implementation costs and resource constraints
-
-
Who are the major players in the Electronic Lab Notebook Market?
-
Agilent Technologies Inc., Arxspan LLC, Benchling Inc., Dassault Systemes SE, Dotmatics, Genemod Corp., IDBS Ltd, LabArchives LLC, LabCollector, Labii Inc., LabVantage Solutions Inc., LabWare Inc., Mettler Toledo Inc., ResearchSpace LLC, Revvity Signals Software Inc, Sapio Sciences LLC, Scilligence Corp., STARLIMS Corp., Thermo Fisher Scientific Inc. and Waters Corp.
-
Market Research Insights
- The market's dynamics are shaped by the dual pressures of accelerating innovation and stringent regulatory oversight. Adopting a unified informatics platform enables organizations to improve data traceability by over 50% compared to manual methods, a critical factor in GxP regulated environments.
- The shift to a paperless laboratory environment is not just about efficiency; it is about embedding data integrity assurance into every step, with modern systems reducing documentation errors by more than 40%. The demand for inter-departmental data sharing and intellectual property lifecycle management is pushing vendors to offer more integrated scientific collaboration platforms.
- As a result, the focus is increasingly on the total cost of ownership, with cloud-based models offering a more accessible entry point for startups engaged in biopharmaceutical research and materials science research, promoting wider adoption across the industry.
We can help! Our analysts can customize this electronic lab notebook market research report to meet your requirements.
 RIA -
RIA - 
