Electronic Shelf Label (esls) Market Size 2026-2030
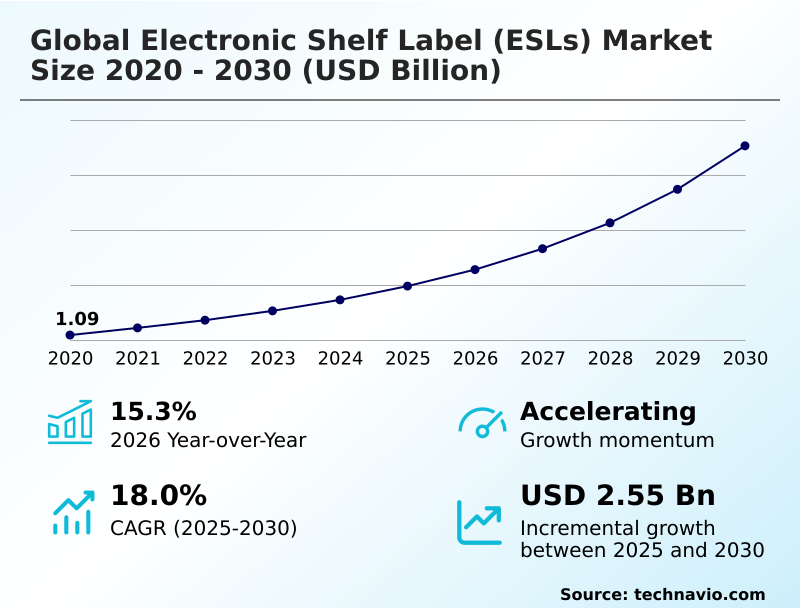
The electronic shelf label (esls) market size is valued to increase by USD 2.55 billion, at a CAGR of 18% from 2025 to 2030. Operational excellence and optimization of labor resources will drive the electronic shelf label (esls) market.
Major Market Trends & Insights
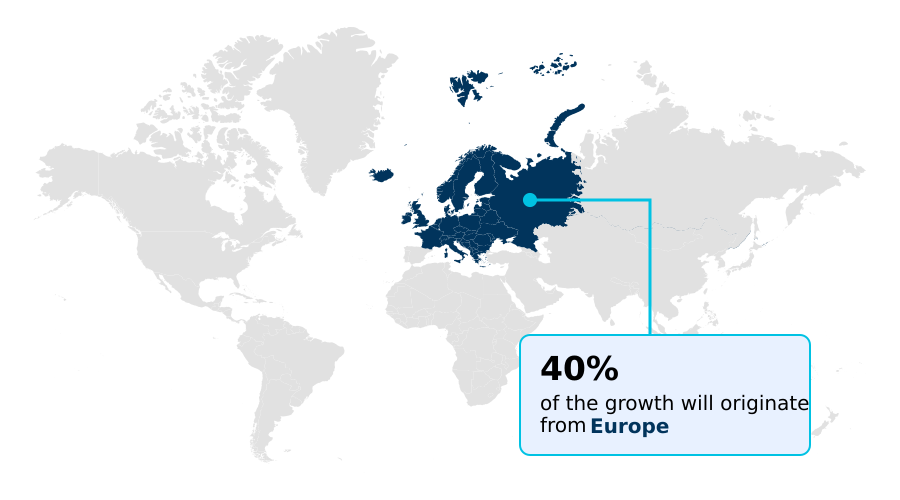
- Europe dominated the market and accounted for a 40.4% growth during the forecast period.
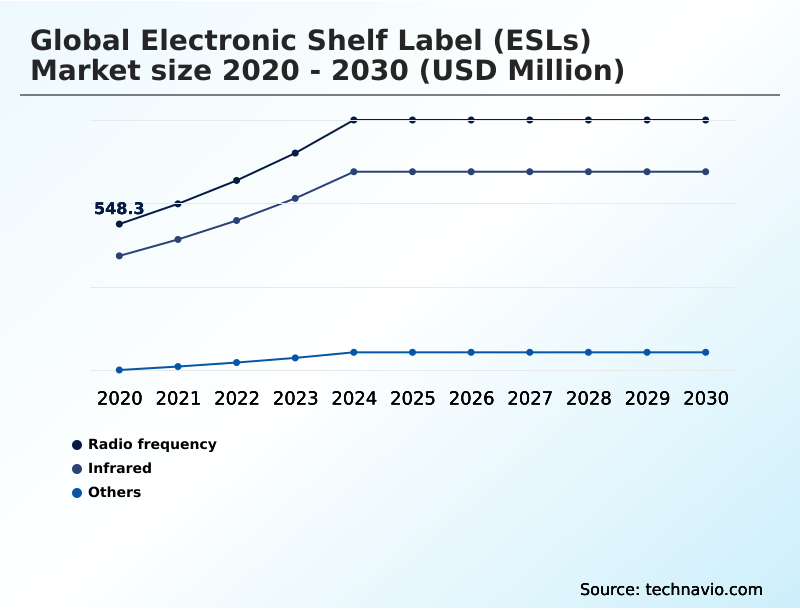
- By Technology - Radio frequency segment was valued at USD 870.5 million in 2024
- By Product - LCD ESL segment accounted for the largest market revenue share in 2024
Market Size & Forecast
- Market Opportunities: USD 3.44 billion
- Market Future Opportunities: USD 2.55 billion
- CAGR from 2025 to 2030 : 18%
Market Summary
- The electronic shelf label (ESLs) market is rapidly evolving, driven by the retail sector's urgent need for digital transformation and operational agility. These systems replace traditional paper tags with battery-powered digital labels, enabling dynamic pricing automation that allows for instantaneous price adjustments across thousands of products. This capability is critical for maintaining competitiveness against e-commerce platforms.
- For instance, a national grocery chain can deploy a promotional campaign across all its stores simultaneously, ensuring point of sale synchronization and eliminating costly pricing errors, a process that once took days of manual labor. Beyond pricing, this retail automation technology facilitates real-time inventory management through features like item geolocation and low-stock alerts from shelf-monitoring sensors.
- The integration of NFC-enabled shelf labels and QR code functionality also enhances the phygital retail experience, allowing shoppers to access detailed product information with their smartphones. The underlying technology, from low-power wide-area network protocols to cloud-based ESL management platforms, forms a cohesive ecosystem aimed at boosting efficiency, reducing costs, and improving the overall customer journey.
- The transition to these systems marks a fundamental shift towards smarter, more responsive, and data-driven retail environments.
What will be the Size of the Electronic Shelf Label (esls) Market during the forecast period?
Get Key Insights on Market Forecast (PDF) Get Free Sample
How is the Electronic Shelf Label (esls) Market Segmented?
The electronic shelf label (esls) industry research report provides comprehensive data (region-wise segment analysis), with forecasts and estimates in "USD million" for the period 2026-2030, as well as historical data from 2020-2024 for the following segments.
- Technology
- Radio frequency
- Infrared
- Others
- Product
- LCD ESL
- Full graphic e-paper ESL
- Segmented e-paper ESL
- End-user
- Supermarkets and hypermarkets
- Convenience stores
- Others
- Display size
- Less than 3 inches
- From 3 To 7 inches
- From 7 To 10 inches
- More than 10 inches
- Component
- Displays
- Batteries
- Microprocessors
- Transceivers
- Geography
- Europe
- Germany
- UK
- France
- APAC
- China
- Japan
- South Korea
- North America
- US
- Canada
- Mexico
- Middle East and Africa
- Saudi Arabia
- UAE
- South Africa
- South America
- Brazil
- Argentina
- Rest of World (ROW)
- Europe
By Technology Insights
The radio frequency segment is estimated to witness significant growth during the forecast period.
The radio frequency segment is central to large-scale deployments, utilizing various frequency bands to support a robust inventory management system.
This communication medium leverages wireless communication protocols to facilitate reliable, bi-directional data exchange between a centralized pricing server and thousands of individual electrophoretic display units.
Unlike optical solutions, radio frequency signals offer expansive range and can penetrate obstacles, ensuring over 99.9% update success without a direct line of sight, which is essential for asset tracking and maintaining brand consistency.
These systems enable rapid, simultaneous updates, supporting dynamic pricing and ensuring regulatory compliance.
The integration of this technology with multi-color e-paper and smart retail tags is crucial for enhancing workforce productivity and delivering a clear return on investment through energy-efficient operations and reduced manual labor.
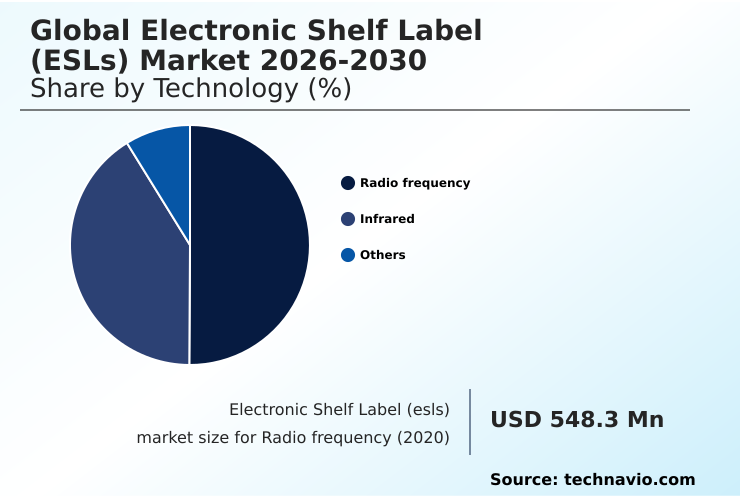
The Radio frequency segment was valued at USD 870.5 million in 2024 and showed a gradual increase during the forecast period.
Regional Analysis
Europe is estimated to contribute 40.4% to the growth of the global market during the forecast period.Technavio’s analysts have elaborately explained the regional trends and drivers that shape the market during the forecast period.
See How Electronic Shelf Label (esls) Market Demand is Rising in Europe Get Free Sample
The geographic landscape of the market is diverse, with adoption patterns reflecting regional economic priorities and technological infrastructure.
In developed regions, the focus is on leveraging digital transformation for a competitive edge; for instance, implementations in high-wage areas reduce labor allocation for pricing tasks by up to 15 hours per week per store.
In contrast, emerging economies are adopting this technology as a core component of their data-driven retail strategies to manage economic volatility. The use of a centralized pricing server allows retailers to implement price changes with precision.
Advanced systems utilize technologies like infrared communication and bluetooth low energy for reliable data transmission, while shelf-monitoring sensors and item geolocation enhance inventory control.
The widespread deployment of battery-powered digital labels is a testament to their cost-effective architecture, though the total cost of ownership remains a consideration, particularly when addressing legacy system integration and cybersecurity vulnerabilities.
Market Dynamics
Our researchers analyzed the data with 2025 as the base year, along with the key drivers, trends, and challenges. A holistic analysis of drivers will help companies refine their marketing strategies to gain a competitive advantage.
- Strategic decisions around the global electronic shelf label (esls) market 2026-2030 hinge on a thorough evaluation of both technology and operational impact. Key considerations often begin with a comparison of rf vs ir for electronic shelf labels, where factors like store size and potential for interference guide the choice of communication infrastructure.
- The business case is heavily dependent on the projected roi of electronic shelf label systems, which must account for both initial investment and long-term savings. For many, a primary challenge is how to handle integrating esl with legacy pos systems, as this can introduce complexity and cost.
- Furthermore, as these devices become networked endpoints, addressing cybersecurity risks in esl networks is non-negotiable to protect against price manipulation and data breaches. In practical application, the technology shines in use cases like esl for dynamic pricing in grocery stores, where retailers can react instantly to market changes.
- This combination of operational efficiency and enhanced customer experience underscores the transformative potential of the technology, making it a critical investment for modern retailers. Systems focused on inventory accuracy have been shown to reduce stock-out incidents by a factor of two when compared to traditional manual methods.
What are the key market drivers leading to the rise in the adoption of Electronic Shelf Label (esls) Industry?
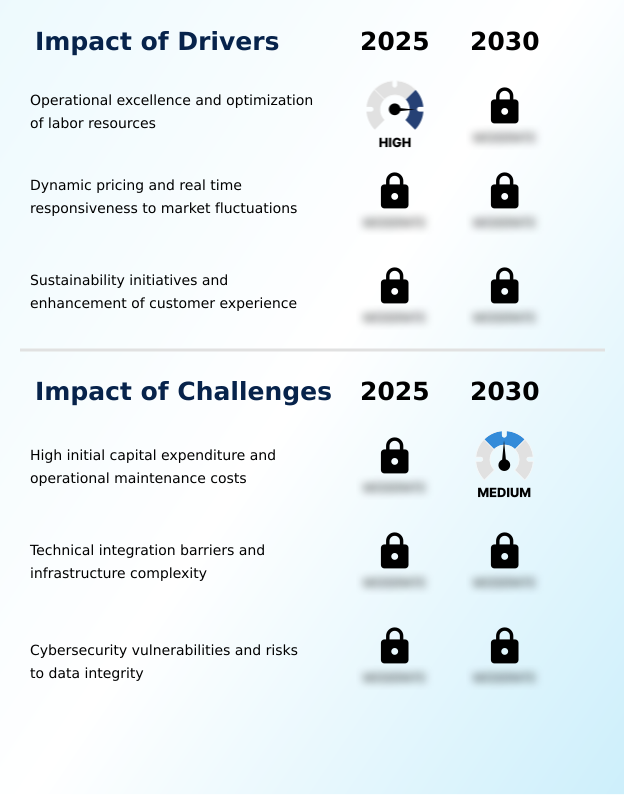
- The pursuit of operational excellence and the optimization of labor resources are key drivers propelling market growth.
- A primary driver for the global electronic shelf label (esls) market 2026-2030 is the pursuit of flawless pricing accuracy and operational excellence.
- By implementing a cloud-based esl management system, retailers can execute automated price updates across thousands of labels, achieving a 99% reduction in pricing errors compared to manual methods.
- This is facilitated by reliable wireless communication protocols, which transmit data to various label types, including segmented e-paper esl, full graphic e-paper esl, and traditional lcd esl. The technology also champions paper waste reduction, aligning with corporate sustainability goals.
- Furthermore, the integration of nfc-enabled shelf labels and qr code integration enhances product information access, turning a simple price display into an interactive tool for in-store promotional displays.
- This improves supply chain visibility by linking the physical shelf directly to back-end inventory data.
What are the market trends shaping the Electronic Shelf Label (esls) Industry?
- The strategic integration of IoT with real-time data analytics is emerging as a significant market trend. This convergence is transforming digital shelf labels into intelligent endpoints for data-driven retail operations.
- The global electronic shelf label (esls) market 2026-2030 is increasingly shaped by the trend toward interconnected smart store solutions. This evolution transforms the electronic shelf label from a simple digital price tag into a key component of retail automation technology.
- Leveraging e-paper display technology for clarity and low power consumption, these systems are central to achieving dynamic pricing automation and enabling a true omnichannel retail integration. This allows for a seamless phygital retail experience, where in-store and online channels are perfectly synchronized.
- By focusing on labor optimization and operational efficiency, retailers are seeing tangible benefits; for instance, automated systems have been shown to improve real-time inventory management accuracy by up to 30%. This shift supports sustainable retail practices by reducing paper waste and enhances customer engagement technology by providing accurate, real-time information at the shelf edge.
What challenges does the Electronic Shelf Label (esls) Industry face during its growth?
- High initial capital expenditure, coupled with ongoing operational maintenance costs, presents a key challenge affecting industry growth.
- Despite the clear benefits, adoption in the global electronic shelf label (esls) market 2026-2030 is moderated by technical and financial challenges. Integrating shelf-edge communication technology with existing legacy systems often proves complex and can increase project timelines by over 30%. Ensuring point of sale synchronization requires careful planning and robust middleware.
- Furthermore, the deployment of a low-power wide-area network to support thousands of retail iot devices represents a significant upfront investment. While bistable display technology ensures long battery life, the management of these assets is a key concern for store modernization. The drive toward a more advanced omnichannel strategy also necessitates sophisticated retail data analytics capabilities for effective revenue management strategies.
- These systems are a critical consumer-facing technology, and ensuring real-time responsiveness without compromising security remains a primary hurdle for many organizations.
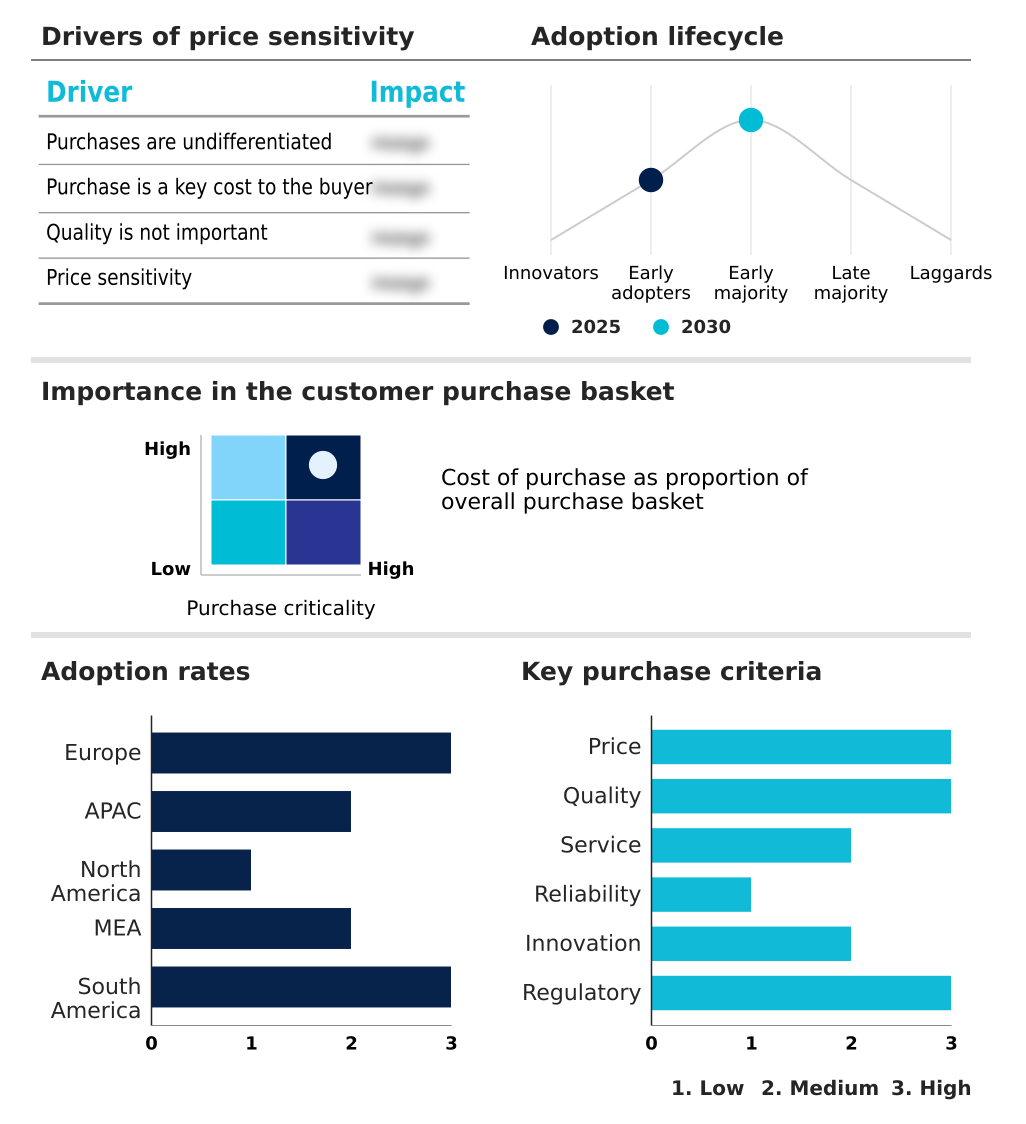
Exclusive Technavio Analysis on Customer Landscape
The electronic shelf label (esls) market forecasting report includes the adoption lifecycle of the market, covering from the innovator’s stage to the laggard’s stage. It focuses on adoption rates in different regions based on penetration. Furthermore, the electronic shelf label (esls) market report also includes key purchase criteria and drivers of price sensitivity to help companies evaluate and develop their market growth analysis strategies.
Customer Landscape of Electronic Shelf Label (esls) Industry
Competitive Landscape
Companies are implementing various strategies, such as strategic alliances, electronic shelf label (esls) market forecast, partnerships, mergers and acquisitions, geographical expansion, and product/service launches, to enhance their presence in the industry.
Acrelec Group - Key offerings include fully graphic electronic shelf labels featuring integrated NFC, enabling agile in-store pricing and promotional control.
The industry research and growth report includes detailed analyses of the competitive landscape of the market and information about key companies, including:
- Acrelec Group
- Adtech Systems Ltd.
- Displaydata Ltd.
- Hanshow Technology Co. Ltd.
- iFlabel
- M2Communication Inc.
- Minewtag Technology Co. Ltd.
- Opticon Sensors Europe BV
- Pricer AB
- SATO Holdings Corp.
- Sunlux IOT Technology Inc.
- Sunvan Group
- Teraoka Seiko Co. Ltd.
- Toshiba Corp.
- Trion Industries Inc.
- VusionGroup
- YalaTech Co. Ltd.
- ZKTeco Co. Ltd.
Qualitative and quantitative analysis of companies has been conducted to help clients understand the wider business environment as well as the strengths and weaknesses of key industry players. Data is qualitatively analyzed to categorize companies as pure play, category-focused, industry-focused, and diversified; it is quantitatively analyzed to categorize companies as dominant, leading, strong, tentative, and weak.
Recent Development and News in Electronic shelf label (esls) market
- In February, 2025, VusionGroup announced a significant expansion with a leading Japanese convenience store chain to deploy its smart retail solutions across five thousand locations, modernizing their in-store operations.
- In March, 2025, Walmart advanced its store digitalization strategy by completing the integration of multi-color electronic shelf label technology in three hundred additional US stores to support dynamic pricing initiatives.
- In April, 2025, Pricer AB secured a long-term partnership with a major German grocery cooperative to roll out its sustainable e-paper displays, which are designed to reduce carbon footprints through optimized energy usage.
- In May, 2025, SoluM established a new regional distribution hub in Brazil, aiming to better serve the growing demand from supermarket chains within the Mercosur trade bloc and significantly shorten hardware delivery times.
Dive into Technavio’s robust research methodology, blending expert interviews, extensive data synthesis, and validated models for unparalleled Electronic Shelf Label (esls) Market insights. See full methodology.
| Market Scope | |
|---|---|
| Page number | 339 |
| Base year | 2025 |
| Historic period | 2020-2024 |
| Forecast period | 2026-2030 |
| Growth momentum & CAGR | Accelerate at a CAGR of 18% |
| Market growth 2026-2030 | USD 2552.9 million |
| Market structure | Fragmented |
| YoY growth 2025-2026(%) | 15.3% |
| Key countries | Germany, UK, France, Italy, Spain, The Netherlands, China, Japan, South Korea, India, Australia, Indonesia, US, Canada, Mexico, Saudi Arabia, UAE, South Africa, Turkey, Israel, Brazil, Argentina and Chile |
| Competitive landscape | Leading Companies, Market Positioning of Companies, Competitive Strategies, and Industry Risks |
Research Analyst Overview
- The electronic shelf label (esls) market is defined by a significant technological shift from basic lcd esl to advanced full graphic e-paper esl and segmented e-paper esl, which leverage bistable display technology for superior readability and energy efficiency. This retail automation technology enables dynamic pricing automation and omnichannel retail integration, which are critical for modern commerce.
- Core to these systems are robust wireless communication protocols, including sub-ghz wireless protocol, and cloud-based esl management platforms that ensure seamless point of sale synchronization. The use of an electrophoretic display, often a multi-color e-paper, allows for more than just pricing; it serves as a digital signage solution for promotions.
- Functionality is expanding to include real-time inventory management through shelf-monitoring sensors and item geolocation, with some systems facilitating in-store navigation system for click-and-collect fulfillment. These battery-powered digital labels, managed by a centralized pricing server, are crucial for retail data analytics.
- Implementations focused on order fulfillment have demonstrated a 25% improvement in picking speed, presenting a compelling business case for board-level investment in this transformative infrastructure.
What are the Key Data Covered in this Electronic Shelf Label (esls) Market Research and Growth Report?
-
What is the expected growth of the Electronic Shelf Label (esls) Market between 2026 and 2030?
-
USD 2.55 billion, at a CAGR of 18%
-
-
What segmentation does the market report cover?
-
The report is segmented by Technology (Radio frequency, Infrared, and Others), Product (LCD ESL, Full graphic e-paper ESL, and Segmented e-paper ESL), End-user (Supermarkets and hypermarkets, Convenience stores, and Others), Display Size (Less than 3 inches, From 3 To 7 inches, From 7 To 10 inches, and More than 10 inches), Component (Displays, Batteries, Microprocessors, and Transceivers) and Geography (Europe, APAC, North America, Middle East and Africa, South America)
-
-
Which regions are analyzed in the report?
-
Europe, APAC, North America, Middle East and Africa and South America
-
-
What are the key growth drivers and market challenges?
-
Operational excellence and optimization of labor resources, High initial capital expenditure and operational maintenance costs
-
-
Who are the major players in the Electronic Shelf Label (esls) Market?
-
Acrelec Group, Adtech Systems Ltd., Displaydata Ltd., Hanshow Technology Co. Ltd., iFlabel, M2Communication Inc., Minewtag Technology Co. Ltd., Opticon Sensors Europe BV, Pricer AB, SATO Holdings Corp., Sunlux IOT Technology Inc., Sunvan Group, Teraoka Seiko Co. Ltd., Toshiba Corp., Trion Industries Inc., VusionGroup, YalaTech Co. Ltd. and ZKTeco Co. Ltd.
-
Market Research Insights
- The market's dynamics are shaped by the tangible business outcomes delivered by store modernization initiatives. Adopting these consumer-facing technologies has been shown to improve pricing accuracy by over 99%, directly enhancing revenue management strategies and consumer trust.
- Furthermore, the real-time responsiveness of these systems allows for an omnichannel strategy where promotional compliance improves by more than 40% compared to manual methods. These retail IoT devices are not merely for display; they are integral to a data-driven retail approach.
- This digital transformation provides a clear and rapid return on investment by optimizing workforce productivity and ensuring brand consistency across all sales channels. The ability to manage a vast network of labels from a centralized platform is a core component of this efficiency, making it a pivotal technology for modern retail.
We can help! Our analysts can customize this electronic shelf label (esls) market research report to meet your requirements.
 RIA -
RIA - 
