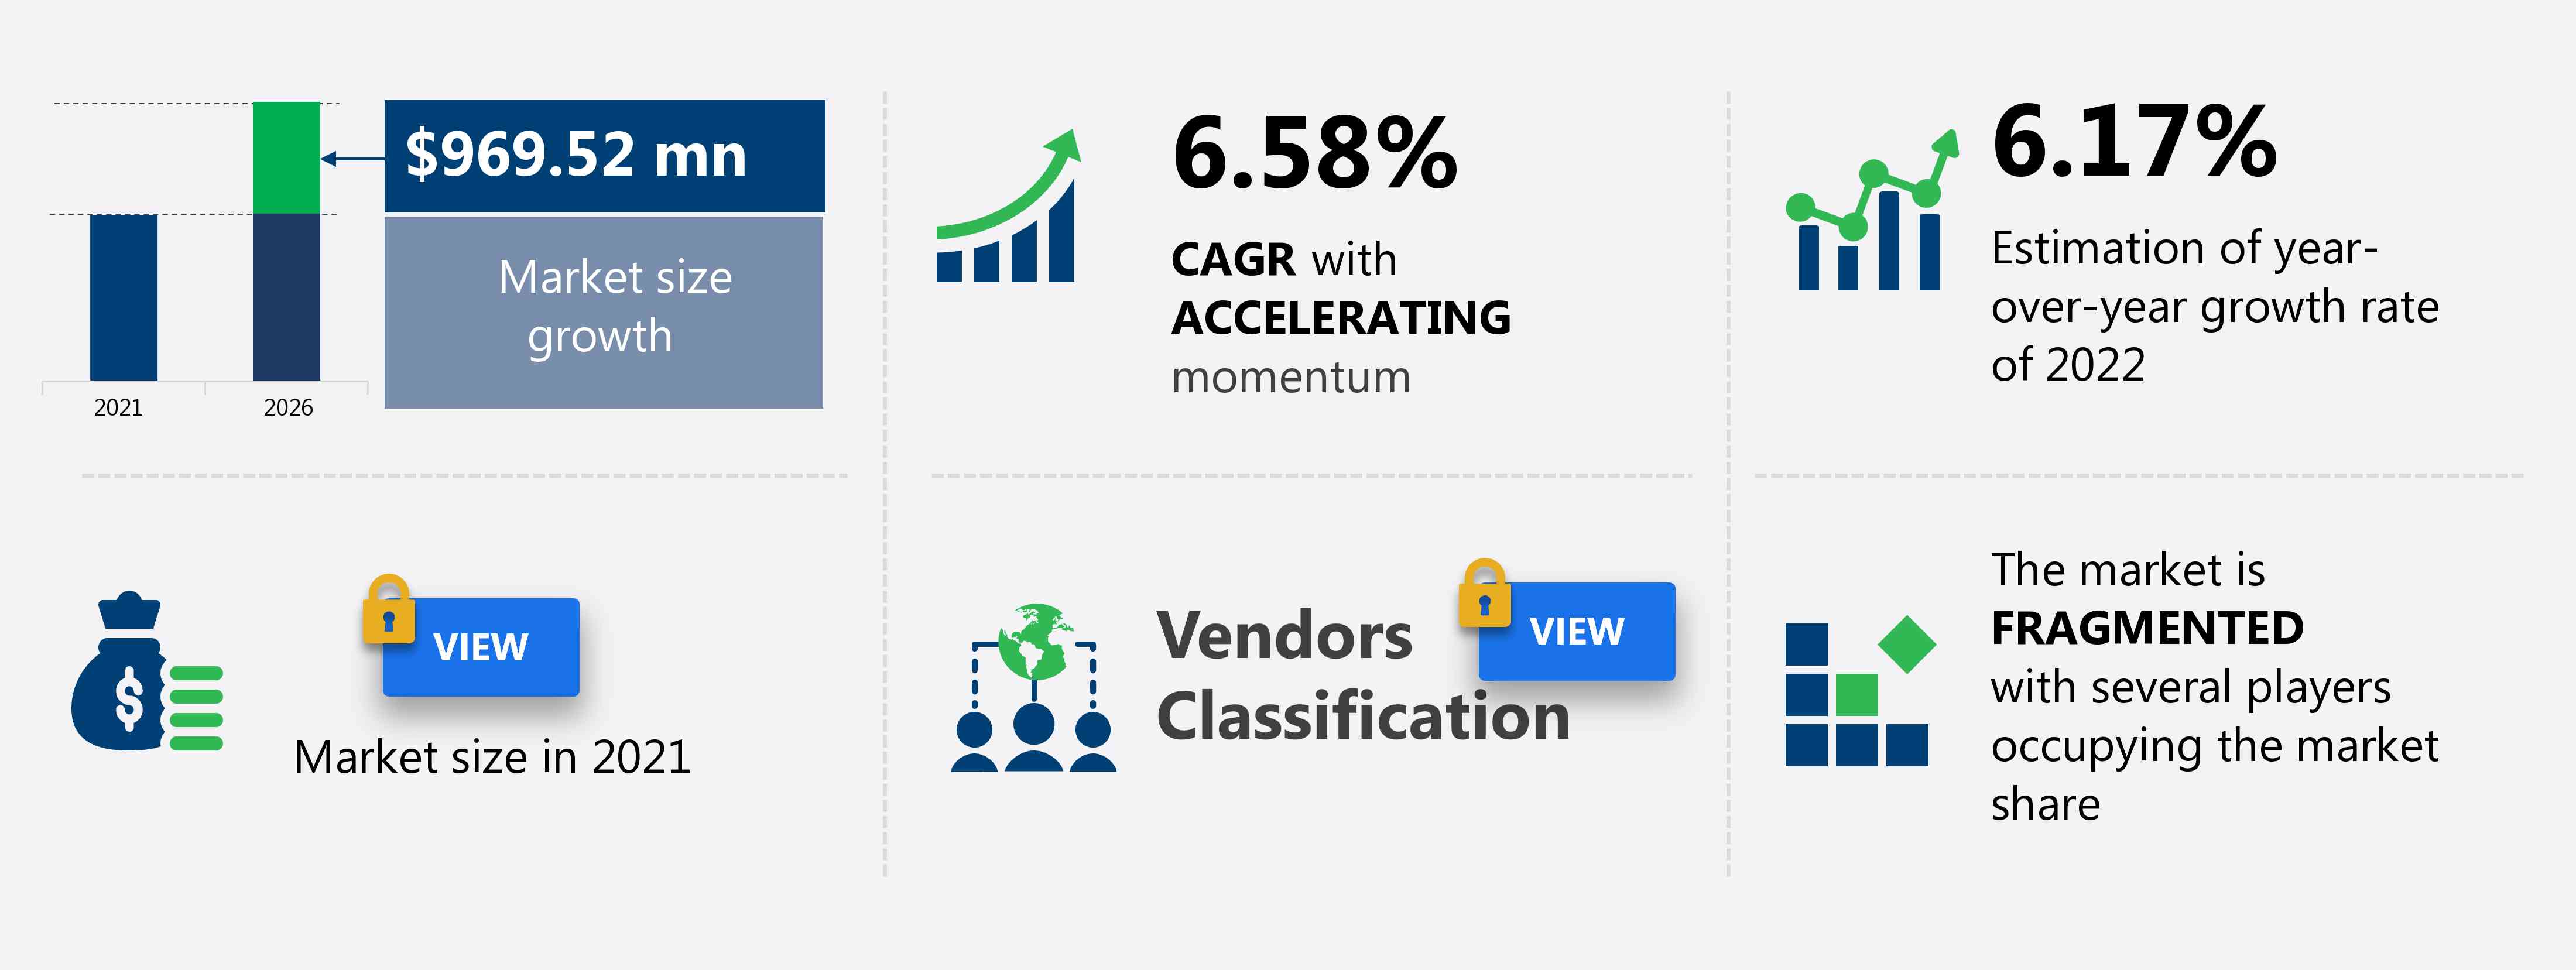
The Russian elevator and escalator market is projected to grow by USD 969.52 million with a CAGR of 6.58%, during the forecast period 2021 to 2026.
This Russian elevator and escalator market research report provides valuable insights on the post-COVID-19 impact on the market, which will help companies evaluate their business approaches. Furthermore, this report extensively covers the Russian elevator and escalator Market segmentations by product (elevator and escalator) and end-user (residential and non-residential). The Russian elevator and escalator Market report also offer information on several market vendors, including ABB Ltd., Advanced Global Solution A.G.S. S.p.A., Hyundai Motor Group, KONE Corp, LLC PKF SIBLIFT, Rockwell Automation Inc., Schindler Holding Ltd., Shenyang Yuand a Enterprise Group, Siemens AG, and Sigma Elevator Co. among others.
What will the Russian Elevator and Escalator Market Size be During the Forecast Period?
Download Report Sample to Unlock the Russian Elevator and Escalator Market Size for the Forecast Period and Other Important Statistics
Russian Elevator and Escalator Market: Key Drivers, Trends, and Challenges
Our researcher studied the historical data for years, with 2021 as the base year, and 2022 as the estimated year, and produced drivers, trends, and challenges for the elevator and escalator market in Russia. In the COVID-19 pandemic, the demand of the Russian elevator and escalator Market has impacted a lot accelerating but a holistic analysis of drivers will help in exact demand s and refining marketing strategies to gain a competitive advantage.
Key Russian Elevator and Escalator Market Driver
Increasing demand for smart elevators is the key driver affecting the elevator and escalator market growth in Russia. The key advantages of a smart elevator over a traditional one include improved energy efficiency, better control of elevator traffic, reduced wait times, and integrated access control features. One of the most important features of smart elevators is the destination dispatch feature; this feature groups passenger depending on their destination floors, thus reducing the wait time and travel time by 50%. Moreover, the destination dispatch feature also reduces congestion in lobbies, improves passenger comfort, and makes elevators less crowded. In addition, smart elevators also have the ability to distinguish employees of a particular company based on their IDs and assign them to the correct elevator to reduce travel and wait times. Owing to these advantages, smart elevators have witnessed an exponential rise in popularity, and their demand is expected to grow during the forecast period. The rapidly growing popularity of smart elevators and their augmenting demand are expected to be key drivers for the growth of the elevator and escalator market in Russian during the forecast period.
Key Russian Elevator and Escalator Market Trend
Elevator maintenance using the loT platform is the key trend driving the elevator and escalator market growth in Russia. Predictive maintenance involves the maintenance and replacement of components if there are indications of imminent failure or deterioration of elevator operations. This helps in reducing unnecessary maintenance visits and optimizing spare-part handling. Prescriptive maintenance involves planning maintenance measures based on a farsighted prediction of failure. Hence, this requires knowledge of a long-run failure. loT-enabled devices have made the monitoring of remote systems easier. However, they are also associated with certain security risks. Although the threats posed to security have decreased with continuous developments, consumers are still skeptical about such risks. However, developments in loT-enabled elevators will have a positive impact on the elevator and escalator market in Russia during the forecast period.
Key Russian Elevator and Escalator Market Challenge
Reluctance to modernize elevators and reduce their energy use is the major challenge impeding the elevator and escalator market growth. The energy utilization of elevators can be optimized through an assortment of means, including the utilization of more productive AC engines and regenerative drives. However, these solutions have not gained much popularity. The primary focus of most office owners is on reducing the weight of the lighting and heating and cooling frameworks in elevators when looking for ways to reduce energy consumption in their buildings. This is a logical approach as these frameworks together account for more than half the energy utilized by commercial buildings, as per the US Department of Energy. Although elevators represent a much smaller proportion of energy use in commercial buildings, they can be improved to save up to 50% of electricity through the utilization of superior drives. Although elevators represent a much smaller proportion of energy use in commercial buildings, they can be improved to save up to 50% of electricity through the utilization of superior drives. The high initial costs associated with the modernization of old elevators present a hurdle, as replacing the hoisting machine can lead to an additional cost. It is difficult to recoup this investment through energy savings alone. In addition, modernization takes time as elevators will be out of service for typically 12-15 months. Hence, reluctance to modernize elevators and reduce their energy use can become a major challenge for the growth of the elevator and escalator market in Russia during the forecast period.
This Russian elevator and escalator Market analysis report also provides detailed information on other upcoming trends and challenges that will have a far-reaching effect on the market growth. The actionable insights on the trends and challenges will help companies evaluate and develop growth strategies for 2022-2026.
Parent Market Analysis
Technavio categorizes the elevator and escalator market in Russia as a part of the global industrial machinery market. Our research report has extensively covered external factors influencing the parent market growth potential in the coming years, which will determine the levels of growth of the Russian elevator and escalator Market during the forecast period.
Who are the Major Russian Elevator and Escalator Market Vendors?
The report analyzes the market’s competitive landscape and offers information on several market vendors, including:
- ABB Ltd.
- Advanced Global Solution A.G.S. S.p.A.
- Hyundai Motor Group
- KONE Corp
- LLC PKF SIBLIFT
- Rockwell Automation Inc.
- Schindler Holding Ltd.
- Shenyang Yuand a Enterprise Group
- Siemens AG
- Sigma Elevator Co.
This statistical study of the Russian elevator and escalator Market encompasses successful business strategies deployed by the key vendors. The Russian elevator and escalator Market is fragmented and the vendors are deploying organic and inorganic growth strategies to compete in the market.
To make the most of the opportunities and recover from the post-COVID-19 impact, market vendors should focus more on the growth prospects in the fast-growing segments, while maintaining their positions in the slow-growing segments.
The report Russian Elevator and Escalator Market contains a comprehensive market knowledge and in-depth vendor landscape added on to an analysis of the key vendors.
Russian Elevator and Escalator Market Value Chain Analysis
Our In-house experts produce extensive information on the value chain, and parent market of the Russian elevator and escalator market which vendors can leverage to gain a competitive advantage during the forecast period. The Value Chain information provides an end-end understanding of product insight and profit and also optimization and evaluation of business strategies The players across the value chain includes selective data and analysis from entire research findings as per the scope of the report.
The report has further elucidated other innovative approaches being followed by manufacturers to ensure a sustainable market presence.
What are the Revenue-generating Product Segments in the Russian Elevator and Escalator Market?

To gain further insights on the market contribution of various segments Request PDF Sample
The Russian elevator and escalator Market share growth by the elevator segment will be significant during the forecast period. The shortage of land available for civilization owing to the rapid growth in urbanization has resulted in an increase in the number of multistory buildings. This is the key driving force for the growth of the elevator and escalator market in Russia, as elevators and escalators offer a significant amount of convenience for transportation between floors. The growth of the elevators segment will be primarily driven by the rise in commercial construction.
This report provides an accurate prediction of the contribution of all the segments to the growth of the Russian elevator and escalator market size and actionable market insights on the post-COVID-19 impact on each segment.
|
Russian Elevator and Escalator Market Scope |
|
|
Report Coverage |
Details |
|
Page number |
120 |
|
Base year |
2021 |
|
Forecast period |
2022-2026 |
|
Growth momentum & CAGR |
Accelerate at a CAGR of 6.58% |
|
Market growth 2022-2026 |
USD 969.52 million |
|
Market structure |
Fragmented |
|
YoY growth (%) |
6.17 |
|
Regional analysis |
Russia |
|
Key consumer countries |
Russia |
|
Competitive land scape |
Leading companies, Competitive Strategies, Consumer engagement scope |
|
Key companies profiled |
ABB Ltd., Advanced Global Solution A.G.S. S.p.A., Hyundai Motor Group, KONE Corp, LLC PKF SIBLIFT, Rockwell Automation Inc., Schindler Holding Ltd., Shenyang Yuand a Enterprise Group, Siemens AG, and Sigma Elevator Co. |
|
Market dynamics |
Parent market analysis, Market growth inducers and obstacles, Fast-growing and slow-growing segment analysis, COVID-19 impact and recovery analysis and future consumer dynamics, and Market condition analysis for the forecast period. |
|
Customization purview |
If our report has not included the data that you are looking for, you can reach out to our analysts and get segments customized. |
What are the Key Data Covered in this Russian Elevator and Escalator Market In Country Report?
- CAGR of the market during the forecast period 2022-2026
- Detailed information on factors that will drive Russian elevator and escalator market growth during the next five years
- Precise estimation of the Russian elevator and escalator market size and its contribution to the parent market
- Accurate predictions on upcoming trends and changes in consumer behavior
- The growth of the elevator and escalator industry across Russia
- A thorough analysis of the market’s competitive landscape and detailed information on vendors
- Comprehensive details of factors that will challenge the growth of Russian elevator and escalator market vendors
We can help! Our analysts can customize this report to meet your requirements. Get in touch
 RIA -
RIA - 
