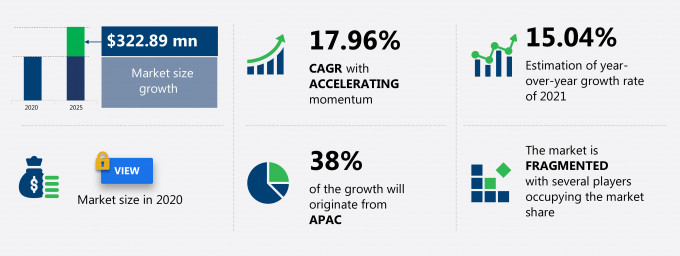
The emergency lighting battery market share is expected to increase by USD 322.89 million from 2020 to 2025, and the market’s growth momentum will accelerate at a CAGR of 17.96%. This emergency lighting battery market research report provides valuable insights on the post COVID-19 impact on the market, which will help companies evaluate their business approaches. The emergency lighting battery market report also offers information on several market vendors, including C and D Technologies Inc., Crown Battery Manufacturing Co., East Penn Manufacturing Co. Inc., Eaton Corp. Plc, EnerSys, EverExceed Industrial Co. Ltd., Exide Technologies, Hubbell Inc., Raca Group B.V., and Zumtobel Group AG among others. Furthermore, this report extensively covers emergency lighting battery market segmentation by type (NiCd battery, NiMH battery, Li-ion battery, and lead-acid battery) and geography (North America, APAC, Europe, MEA, and South America).
What will the Emergency Lighting Battery Market Size be During the Forecast Period?
Download the Free Report Sample to Unlock the Emergency Lighting Battery Market Size for the Forecast Period and Other Important Statistics
Emergency Lighting Battery Market: Key Drivers, Trends, and Challenges
Based on our research output, there has been a negative impact on the market growth during and post COVID-19 era. The increasing safety parameters and regulations worldwide is notably driving the emergency lighting battery market growth, although factors such as difficulties in retrofitting may impede market growth. Our research analysts have studied the historical data and deduced the key market drivers and the COVID-19 pandemic impact on the emergency lighting battery industry. The holistic analysis of the drivers will help in deducing end goals and refining marketing strategies to gain a competitive edge.
Key Emergency Lighting Battery Market Driver
The increasing safety parameters and regulations worldwide is notably driving the emergency lighting battery market growth. Emergency lighting is vital in industries and needs to be installed in the commercial and residential sectors for the safety of the people working or living there. Emergency lights enable consumers to complete tasks even during a power outage. Furthermore, in the case of an emergency, a natural disaster, or a hazardous situation, safely evacuating the premises requires a backup light source. Emergency lights act as a guiding way for people to exit dangerous situations. Therefore, emergency lights are vital to an industrial or residential setting to ensure safety and avoid financial losses. Construction companies trail the rules set up by local or regional authorities by installing emergency lights at the time of construction. The global increase in the number of safety regulations by governments has driven the growth of the global emergency lighting market as most new buildings need to be equipped with emergency lights as per the new standards.
Key Emergency Lighting Battery Market Trend
The advances in emergency light battery technologies is the key trend driving the emergency lighting battery market growth. With the growing adoption of emergency lights, manufacturers are focusing on improving battery systems. LED-based emergency lights are finding more applications owing to reduced prices. These emergency lights are energy-efficient and require significantly smaller and lighter batteries with lower capacity. Another technological trend has been the increased use of NiMH batteries for both exit-sign lightings and pathways. NiMH provides batteries with higher efficiencies and longer life and that operate in the temperature range of -10°C to 45°C. Manufacturers are showing a preference for lithium-ion batteries over Ni-Cd batteries. Lithium-ion batteries are small and light in weight and have a larger energy density. LiFePO4 batteries are ideal for emergency lightings owing to their longer life, better power density, and improved thermal and chemical stability. It is safer to use these batteries in extreme environments, such as fire accidents. Therefore, an increasing number of vendors are expected to focus on the introduction of emergency lights with LiFePO4 batteries during the forecast period.
Key Emergency Lighting Battery Market Challenge
The major challenge impeding the emergency lighting battery market growth is the difficulties in retrofitting. Lighting technologies have evolved over time from incandescent to fluorescent and LED. LED retrofitting is gaining traction as a lighting solution in general luminaires and emergency lightings. Owing to energy savings and durability, many commercial and industrial buildings are replacing old emergency lights with LED-based emergency lights. However, there are issues related to the retrofitting of existing luminaires with LED luminaires. Incompatibility is a concern as old light fittings need to be rewired for them to be suitable for LED lights. Emergency fluorescent luminaires consist of a lamp, lamp holder, and ballast, along with housing and a lens or a diffuser. The diffuser is a part of the optical assembly that distributes light efficiently. However, LED lights emit light in a unidirectional way, which fails to utilize the visual design of the fixture housing. Retrofitting LED luminaires may reduce illumination when compared with fluorescent lights that use a different pattern of light. Therefore, retrofitting LED lights is difficult as it requires more work and time.
This emergency lighting battery market analysis report also provides detailed information on other upcoming trends and challenges that will have a far-reaching effect on the market growth. The actionable insights on the trends and challenges will help companies evaluate and develop growth strategies for 2021-2025.
Parent Market Analysis
Technavio categorizes the global emergency lighting battery market as a part of the global renewable electricity market. Our research report has extensively covered external factors influencing the parent market growth potential in the coming years, which will determine the levels of growth of the emergency lighting battery market during the forecast period.
Who are the Major Emergency Lighting Battery Market Vendors?
The report analyzes the market’s competitive landscape and offers information on several market vendors, including:
- C and D Technologies Inc.
- Crown Battery Manufacturing Co.
- East Penn Manufacturing Co. Inc.
- Eaton Corp. Plc
- EnerSys
- EverExceed Industrial Co. Ltd.
- Exide Technologies
- Hubbell Inc.
- Raca Group B.V.
- Zumtobel Group AG
This statistical study of the emergency lighting battery market encompasses successful business strategies deployed by the key vendors. The emergency lighting battery market is fragmented and the vendors are deploying organic and inorganic growth strategies to compete in the market.
Product Insights and News
- C and D Technologies Inc. - The company offers emergency lighting battery namely Tel Long Duration Series.
To make the most of the opportunities and recover from post COVID-19 impact, market vendors should focus more on the growth prospects in the fast-growing segments, while maintaining their positions in the slow-growing segments.
The emergency lighting battery market forecast report offers in-depth insights into key vendor profiles. The profiles include information on the production, sustainability, and prospects of the leading companies.
Emergency Lighting Battery Market Value Chain Analysis
Our report provides extensive information on the value chain analysis for the emergency lighting battery market, which vendors can leverage to gain a competitive advantage during the forecast period. The end-to-end understanding of the value chain is essential in profit margin optimization and evaluation of business strategies. The data available in our value chain analysis segment can help vendors drive costs and enhance customer services during the forecast period.
The report has further elucidated on other innovative approaches being followed by manufacturers to ensure a sustainable market presence.
Which are the Key Regions for the Emergency Lighting Battery Market?
For more insights on the market share of various regions Request for a FREE sample now!
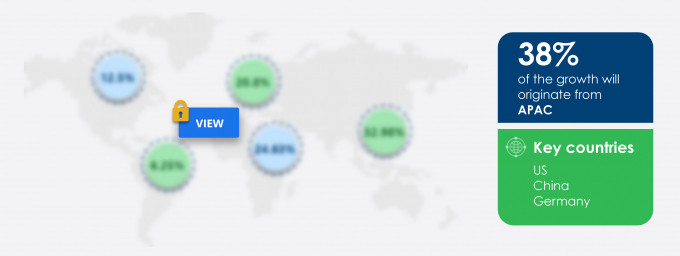
38% of the market’s growth will originate from APAC during the forecast period. China is the key market for the emergency lighting battery market in APAC. Market growth in this region will be faster than the growth of the market in other regions.
Growing purchasing power and rising disposable income of people will facilitate the emergency lighting battery market growth in APAC over the forecast period. This market research report entails detailed information on the competitive intelligence, marketing gaps, and regional opportunities in store for vendors, which will assist in creating efficient business plans.
COVID Impact and Recovery Analysis
The emergency lighting battery market in APAC is witnessing certain challenges, owing to the COVID-19 outbreak in 2020. The outbreak of COVID-19 affected many countries in the region, such as China, India, South Korea, and Japan. Many countries imposed nationwide lockdowns to prevent the community spread of COVID-19. This resulted in the decline of construction operations and affected many manufacturing companies, including those of emergency lighting batteries. However, the market is expected to recover due to the rising infrastructure projects in the region. For instance, in December 2020, the Airports Authority of India (AAI) began the construction of a new airport on a greenfield site in Hollongi, India. Such development projects in the region will increase the demand for emergency lighting batteries during the forecast period.
What are the Revenue-generating Type Segments in the Emergency Lighting Battery Market?
To gain further insights on the market contribution of various segments Request for a FREE sample
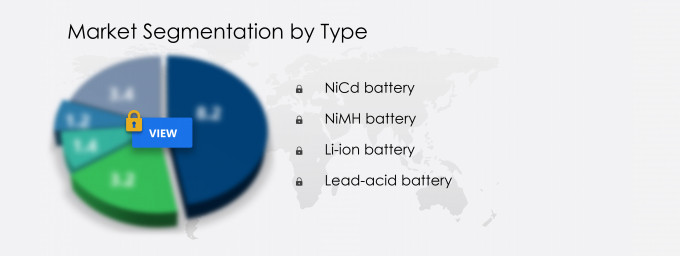
The emergency lighting battery market share growth by the NiCd battery segment will be significant during the forecast period. NiCd batteries are very efficient and lightweight. Each cell in a NiCd battery is tested to ensure its emergency light will illuminate for approximately 90 minutes. Compared with newer battery technologies like Li-ion, NiCd batteries have a higher self-discharge rate. These advantages will facilitate the growth of the segment during the forecast period.
This report provides an accurate prediction of the contribution of all the segments to the growth of the emergency lighting battery market size and actionable market insights on post COVID-19 impact on each segment.
|
Emergency Lighting Battery Market Scope |
|
|
Report Coverage |
Details |
|
Page number |
120 |
|
Base year |
2020 |
|
Forecast period |
2021-2025 |
|
Growth momentum & CAGR |
Accelerate at a CAGR of 17.96% |
|
Market growth 2021-2025 |
$ 322.89 million |
|
Market structure |
Fragmented |
|
YoY growth (%) |
15.04 |
|
Regional analysis |
North America, APAC, Europe, MEA, and South America |
|
Performing market contribution |
APAC at 38% |
|
Key consumer countries |
US, China, Germany, UK, and France |
|
Competitive landscape |
Leading companies, Competitive strategies, Consumer engagement scope |
|
Key companies profiled |
C and D Technologies Inc., Crown Battery Manufacturing Co., East Penn Manufacturing Co. Inc., Eaton Corp. Plc, EnerSys, EverExceed Industrial Co. Ltd., Exide Technologies, Hubbell Inc., Raca Group B.V., and Zumtobel Group AG |
|
Market dynamics |
Parent market analysis, Market growth inducers and obstacles, Fast-growing and slow-growing segment analysis, COVID 19 impact and recovery analysis and future consumer dynamics, Market condition analysis for forecast period |
|
Customization purview |
If our report has not included the data that you are looking for, you can reach out to our analysts and get segments customized. |
What are the Key Data Covered in this Emergency Lighting Battery Market Report?
- CAGR of the market during the forecast period 2021-2025
- Detailed information on factors that will drive emergency lighting battery market growth during the next five years
- Precise estimation of the emergency lighting battery market size and its contribution to the parent market
- Accurate predictions on upcoming trends and changes in consumer behavior
- The growth of the emergency lighting battery industry across North America, APAC, Europe, MEA, and South America
- A thorough analysis of the market’s competitive landscape and detailed information on vendors
- Comprehensive details of factors that will challenge the growth of emergency lighting battery market vendors
We can help! Our analysts can customize this report to meet your requirements. Get in touch


