
Energy Bar Market Size 2024-2028
The energy bar market size is forecast to increase by USD 1.22 billion at a CAGR of 3.27% between 2023 and 2028.
- The market is witnessing significant growth due to the increasing demand for convenient and nutritious snacking options, particularly In the sports nutrition segment. This trend is being driven by consumers' active lifestyles and the growing awareness of health and wellness. Additionally, the sales of energy bars through online retailing channels are on the rise, making these products more accessible to consumers. However, the market faces challenges from the easy availability of substitutes, including fresh fruits and other energy-rich snacks. Producers are addressing these challenges by offering innovative flavors, functional ingredients, and convenient packaging to differentiate their products and cater to evolving consumer preferences.
- Overall, the market is expected to continue its growth trajectory, driven by these trends and challenges.
What will be the Size of the Energy Bar Market During the Forecast Period?

- The market, also known as the sports nutrition bars sector, caters to the growing demand for instant energy boosts during physical activities and fitness pursuits. These bars are popular among athletes, fitness enthusiasts, and individuals with active lifestyles. The market is driven by the increasing awareness of health and wellness, with energy bars serving as convenient, nutritious snack options for consumers engaged in various sports clubs, gyms, and health & fitness centers. Composition varies widely, with offerings including proteins derived from sources like nuts, seeds, and oats, as well as carbohydrates and healthy fats from granola and other ingredients.
- Energy bars often provide added nutritional value, making them appealing as meal replacement bars or supplements. The retail sector plays a significant role In the market, with both brick-and-mortar stores and online platforms offering a wide range of options. Social media influencers have also contributed to the market's growth, promoting energy bars as essential tools for maintaining energy levels during workouts and everyday life. Despite concerns regarding added sugars, the convenience and nutritional benefits of energy bars continue to make them a popular choice for consumers seeking to fuel their active lifestyles.
How is this Energy Bar Industry segmented and which is the largest segment?
The energy bar industry research report provides comprehensive data (region-wise segment analysis), with forecasts and estimates in "USD million" for the period 2024-2028, as well as historical data from 2018-2022 for the following segments.
- Product
- Conventional energy bars
- Organic energy bars
- Geography
- North America
- Canada
- US
- Europe
- Germany
- UK
- APAC
- China
- South America
- Middle East and Africa
- North America
By Product Insights
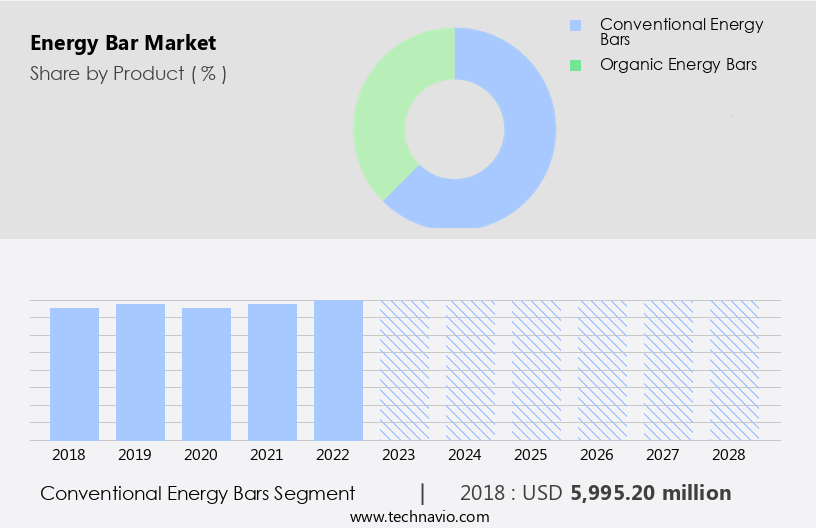
- The conventional energy bars segment is estimated to witness significant growth during the forecast period.
Conventional energy bars cater to the demand for instant energy and convenient, on-the-go snack options for athletes and fitness-conscious consumers. These bars, rich in proteins, nutrients, and micronutrients, support a balanced diet and offer health benefits. Brands prioritize healthy ingredients, including gluten-free, vegan, low-fat, and low-calorie options, to meet diverse consumer preferences. The convenience food market's growth, driven by hectic lifestyles and the working-class population, fuels the demand for energy bars. Key players In the market offer consumers value brand image, label claims, and functional ingredients, such as fiber, reduced sugar, and protein.
Online retail stores, gyms, sports clubs, and convenience stores are significant distribution channels. Energy bars come in various forms, including protein bars, nutrition bars, cereal bars, and fiber bars. The market's growth is influenced by health & fitness center memberships, social media influencers, and online distributors. Consumers increasingly seek clean label products, meal replacement options, and supplement bars for muscle mass and fat control. Health concerns, such as heart disease, obesity, blood cholesterol, and diabetes, further drive demand.
Get a glance at the Energy Bar Industry report of share of various segments Request Free Sample
The Conventional energy bars segment was valued at USD 6 billion in 2018 and showed a gradual increase during the forecast period.
Regional Analysis
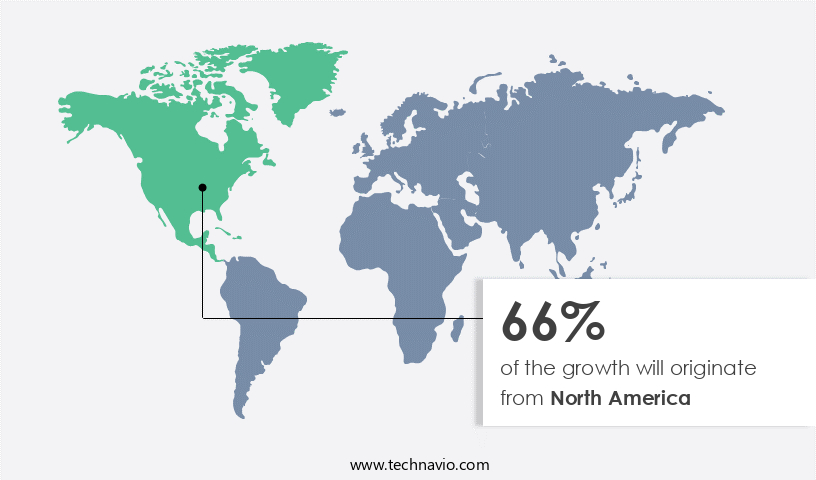
- North America is estimated to contribute 66% to the growth of the global market during the forecast period.
Technavio's analysts have elaborately explained the regional trends and drivers that shape the market during the forecast period.
For more insights on the market share of various regions, Request Free Sample
The North American market is experiencing significant growth due to the increasing awareness of health, fitness, and physical activities. Key players in this region are expanding their product lines to cater to this demand, introducing innovative flavors and nutritive content. Popular ingredients include chocolate, fruits, and nuts. The US market presents the most lucrative opportunities, driven by the working-class population, teenage children, and hectic lifestyles. Consumers seek convenient, on-the-go snack options rich in proteins, nutrients, and micronutrients for a balanced diet. Energy bars, as meal replacement or supplement options, offer instant energy and cater to various dietary needs such as gluten-free, vegan, low fat, and low calorie.
Brands focus on clean label products and functional ingredients like fiber, reduced sugar, and protein. Online retail stores, gyms, sports clubs, and convenience stores are major distribution channels. The market is expected to continue growing, driven by the increasing demand for healthy convenience foods and meal patterns.
Market Dynamics
Our energy bar market researchers analyzed the data with 2023 as the base year, along with the key drivers, trends, and challenges. A holistic analysis of drivers will help companies refine their marketing strategies to gain a competitive advantage.
What are the key market drivers leading to the rise In the adoption of Energy Bar Industry?
Increasing demand for sports nutrition is notably driving market growth. The market caters to the increasing demand for convenient, on-the-go snacks that provide an instant energy boost. These bars are available at various retail outlets, including conventional supermarkets, hypermarkets, convenience stores, specialty stores, and online retail stores. Granola, oats, nuts, seeds, and various functional ingredients are commonly used in the production of energy bars. Protein bars, nutrition bars, cereal bars, fiber bars, and supplement bars are popular types, catering to diverse consumer needs such as muscle mass gain, fat control, and addressing complex health issues like heart disease, obesity, blood cholesterol, and diabetes.
Further, social media influencers and online distributors play a significant role in promoting brand loyalty through labeling and advertising the nutritional value, which includes carbohydrates, fats, and fiber content. E-commerce platforms and online stores have made it easier for gym-going people and health-conscious consumers to access these products, further fueling market growth. Consumers increasingly prefer clean label products, and the use of functional ingredients is a key trend in the market. Thus, such factors are driving the growth of the market during the forecast period.
What are the market trends shaping the Energy Bar Industry?
Increasing sales of energy bars through online retailing is the key trend in the market. The market caters to the growing demand for convenient and instant energy boosting snacks among consumers. These bars are available at various retail outlets including conventional supermarkets, hypermarkets, convenience stores, specialty stores, and online retail stores. Granola, oats, nuts, seeds, and various functional ingredients are commonly used in the production of energy bars, offering added nutritional value. Protein bars, nutrition bars, cereal bars, fiber bars, and supplement bars are popular types of energy bars, catering to diverse consumer needs such as muscle mass gain, fat control, and addressing complex health issues like heart disease, obesity, blood cholesterol, and diabetes.
Moreover, social media influencers and online distributors play a significant role in promoting brand loyalty and increasing market reach. Labeling transparency, clean label products, and meal replacement bars are emerging trends in the retail sector. E-commerce platforms and online stores have gained popularity among gym-going people and health-conscious consumers, offering a wide range of energy bars with various nutritional profiles, including carbohydrates, fats, and fiber. Thus, such trends will shape the growth of the market during the forecast period.
What challenges does the Energy Bar Industry face during its growth?
The easy availability of substitutes is the major challenge that affects the growth of the market. The market caters to the increasing demand for convenient, on-the-go snacks that provide an instant energy boost. These bars are available at various retail outlets such as conventional supermarkets, hypermarkets, convenience stores, and specialty stores. Online retail stores have also gained significant traction, with e-commerce platforms offering a wide range of options, from granola and oats-based bars to those made with nuts, seeds, and functional ingredients like protein, fiber, and complex health solutions. Brand loyalty is a crucial factor in this market, with consumers often relying on labeling and nutritional value to make purchasing decisions.
However, social media influencers and online distributors play a vital role in promoting these products, particularly among gym-going people and those with complex health issues like heart disease, obesity, blood cholesterol, diabetes, and muscle mass management. Meal replacement bars, snack products, and supplement bars are popular choices, offering a balance of carbohydrates, fats, and proteins to meet various dietary needs. Clean label products, free from added sugar and artificial ingredients, are increasingly preferred by health-conscious consumers. The retail sector continues to evolve, with retailers focusing on offering a diverse range of options to cater to the unique needs and preferences of their customers. Hence, the above factors will impede the growth of the market during the forecast period
Exclusive Customer Landscape
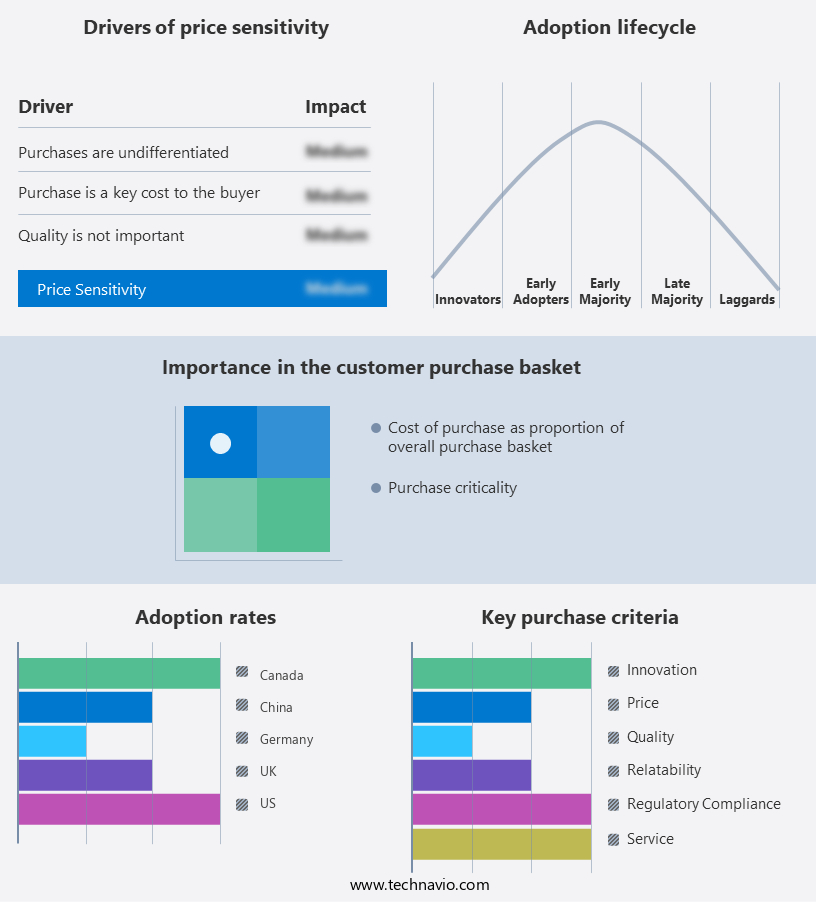
The energy bar market forecasting report includes the adoption lifecycle of the market, covering from the innovator's stage to the laggard's stage. It focuses on adoption rates in different regions based on penetration. Furthermore, the energy bar market report also includes key purchase criteria and drivers of price sensitivity to help companies evaluate and develop their market growth analysis strategies.
Customer Landscape
Key Companies & Market Insights
Companies are implementing various strategies, such as strategic alliances, energy bar market forecast, partnerships, mergers and acquisitions, geographical expansion, and product/service launches, to enhance their presence In the industry.
Abbott Laboratories - The company specializes in manufacturing and marketing energy bars, with a focus on providing consumers with nutritious and convenient options for sustenance.
The industry research and growth report includes detailed analyses of the competitive landscape of the market and information about key companies, including:
- Abbott Laboratories
- Atlantic Grupa d.d
- Clif Bar and Co.
- Eastman Chemical Co.
- EAT Anytime
- Empact Bars LLC
- Garuka Bars
- General Mills Inc.
- Hormel Foods Corp.
- Kellogg Co.
- Lotus Bakeries NV
- Mondelez International Inc.
- NuGo Nutrition
- OTE Sports Ltd.
- PepsiCo Inc.
- Post Holdings Inc.
- Prinsen BV
- PROBAR Inc.
- The Balance Bar Co.
- Torq Performance Nutrition
Qualitative and quantitative analysis of companies has been conducted to help clients understand the wider business environment as well as the strengths and weaknesses of key industry players. Data is qualitatively analyzed to categorize companies as pure play, category-focused, industry-focused, and diversified; it is quantitatively analyzed to categorize companies as dominant, leading, strong, tentative, and weak.
Research Analyst Overview
The market caters to the growing demand for convenient, nutritious snack options that cater to the active lifestyles and health-conscious preferences of consumers. These bars are designed to provide a quick energy boost and essential nutrients, making them an ideal choice for individuals engaged in physical activities or those following a balanced diet. The market for energy bars is driven by various factors, including the increasing awareness of health and fitness, the popularity of sports clubs and gyms, and the hectic lifestyles of the working population and teenage children. The demand for convenience food, particularly those with clean label products and functional ingredients, has also contributed to the growth of this market.
Energy bars come in various forms, including protein bars, nutrition bars, cereal bars, fiber bars, and supplement bars. They are available in different flavors and textures, with ingredients such as granola, oats, nuts, seeds, and fruits being commonly used. Some bars are marketed as gluten-free, vegan, low fat, or low calories, catering to specific dietary needs and preferences. The retail sector plays a significant role In the distribution of energy bars, with hypermarkets, convenience stores, specialty stores, and online retail stores being the primary channels. Social media influencers and online distributors have also emerged as key players In the market, leveraging their reach and influence to promote brand loyalty and drive sales.
The market is diverse and competitive, with a range of brands and products catering to various consumer segments. Brands invest heavily in labeling and marketing to differentiate themselves and build a strong brand image. Functional ingredients, such as proteins, micronutrients, and fiber, are often highlighted to appeal to health-conscious consumers. The market for energy bars is expected to continue growing, driven by the increasing demand for convenient, nutritious snack options that cater to the diverse dietary needs and preferences of consumers. The use of advanced technology and the involvement of food technologists In the development of new products are also expected to drive innovation and growth In the market.
However, the market also faces challenges, including the increasing prevalence of complex health issues such as heart disease, obesity, and diabetes. Consumers are becoming increasingly aware of the importance of making informed food choices and are demanding more transparency and accuracy in labeling. Allergens, such as nuts and soy, are also a concern for some consumers, and brands must ensure that their products are labeled appropriately to cater to these concerns. In conclusion, the market is a dynamic and growing industry that caters to the diverse needs and preferences of consumers seeking convenient, nutritious snack options. The market is driven by various factors, including the increasing awareness of health and fitness, the popularity of sports clubs and gyms, and the hectic lifestyles of the working population and teenage children.
The use of advanced technology and the involvement of food technologists In the development of new products are expected to drive innovation and growth In the market. However, the market also faces challenges, including the increasing prevalence of complex health issues and the need for transparency and accuracy in labeling.
|
Energy Bar Market Scope |
|
|
Report Coverage |
Details |
|
Page number |
146 |
|
Base year |
2023 |
|
Historic period |
2018-2022 |
|
Forecast period |
2024-2028 |
|
Growth momentum & CAGR |
Accelerate at a CAGR of 3.27% |
|
Market growth 2024-2028 |
USD 1.22 billion |
|
Market structure |
Fragmented |
|
YoY growth 2023-2024(%) |
3.13 |
|
Key countries |
US, Canada, China, UK, and Germany |
|
Competitive landscape |
Leading Companies, Market Positioning of Companies, Competitive Strategies, and Industry Risks |
What are the Key Data Covered in this Energy Bar Market Research and Growth Report?
- CAGR of the Energy Bar industry during the forecast period
- Detailed information on factors that will drive the Energy Bar growth and forecasting between 2024 and 2028
- Precise estimation of the size of the market and its contribution of the industry in focus to the parent market
- Accurate predictions about upcoming growth and trends and changes in consumer behaviour
- Growth of the market across North America, Europe, APAC, South America, and Middle East and Africa
- Thorough analysis of the market's competitive landscape and detailed information about companies
- Comprehensive analysis of factors that will challenge the energy bar market growth of industry companies
We can help! Our analysts can customize this energy bar market research report to meet your requirements.
 RIA -
RIA - 
