Enterprise Governance, Risk, And Compliance (egrc) Solutions Market Analysis, Size, and Forecast 2026-2030: North America (US, Canada, and Mexico), Europe (Germany, UK, and France), APAC (China, Japan, and India), South America (Brazil and Argentina), Middle East and Africa (UAE, Saudi Arabia, and South Africa), and Rest of World (ROW)

Enterprise Governance, Risk, And Compliance (egrc) Solutions Market Analysis, Size, and Forecast 2026-2030:
North America (US, Canada, and Mexico), Europe (Germany, UK, and France), APAC (China, Japan, and India), South America (Brazil and Argentina), Middle East and Africa (UAE, Saudi Arabia, and South Africa), and Rest of World (ROW)

Published: Apr 2026 290 Pages SKU: IRTNTR43466

Market Overview at a Glance

$46.11 B
Market Opportunity
16%
CAGR 2025 - 2030
44.7%
North America Growth
$26.99 B
Large enterpises segment 2024

Enterprise Governance, Risk, And Compliance (egrc) Solutions Market Size 2026-2030

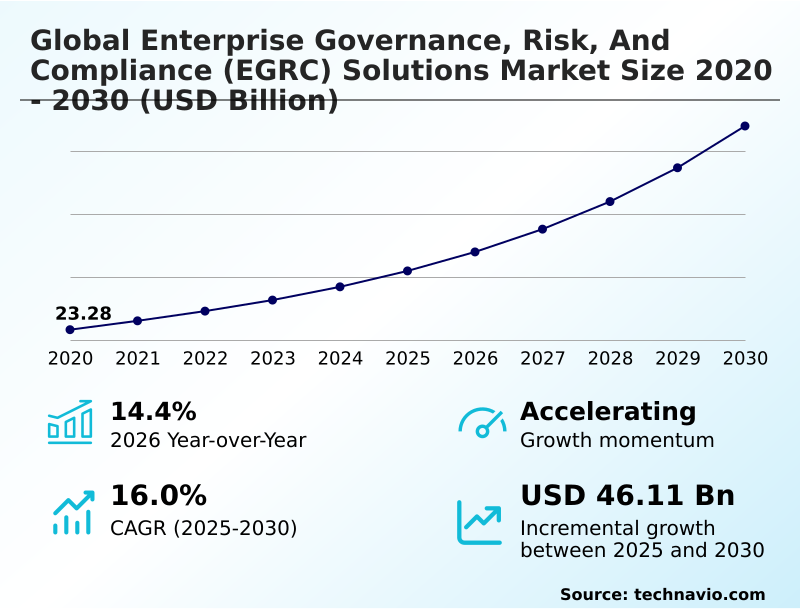
The enterprise governance, risk, and compliance (egrc) solutions market size is valued to increase by USD 46.11 billion, at a CAGR of 16% from 2025 to 2030. Proliferation of agentic artificial intelligence and predictive risk analytics will drive the enterprise governance, risk, and compliance (egrc) solutions market.

Major Market Trends & Insights

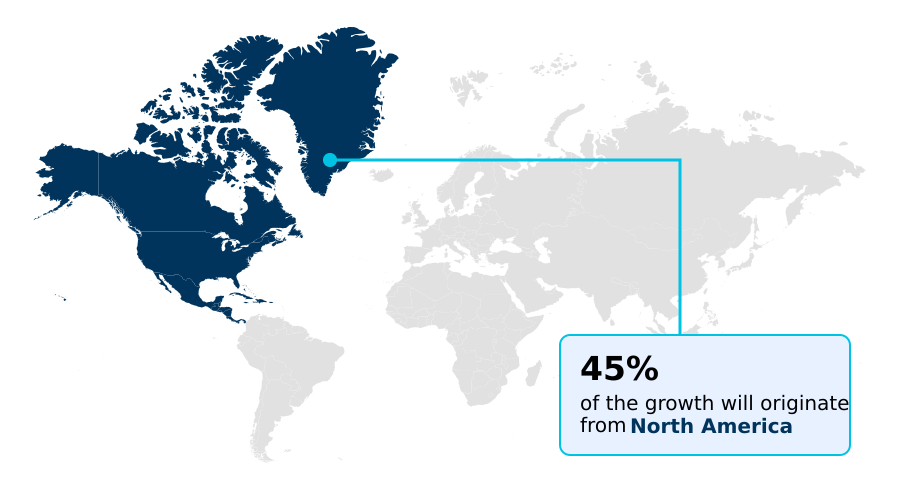
  • North America dominated the market and accounted for a 44.7% growth during the forecast period.
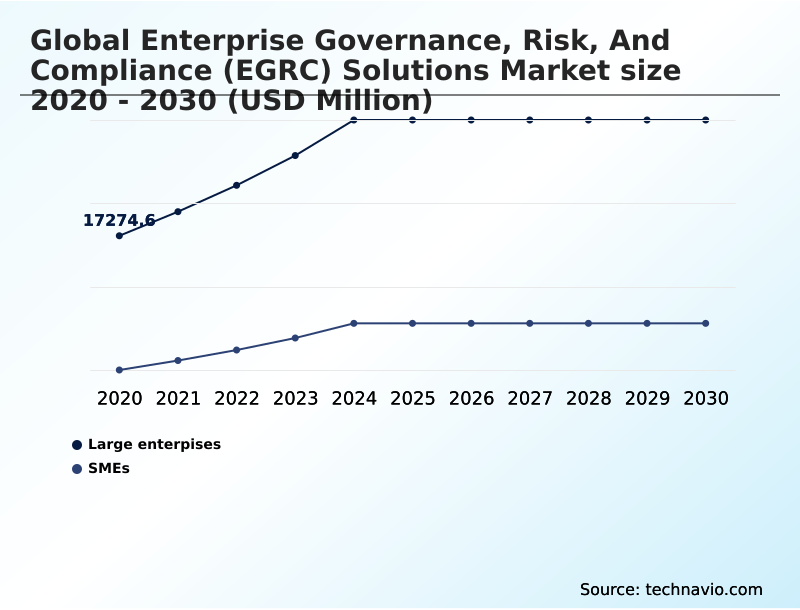
  • By End-user - Large enterpises segment was valued at USD 26.99 billion in 2024
  • By Component - Software segment accounted for the largest market revenue share in 2024

Market Size & Forecast

  • Market Opportunities: USD 64.81 billion
  • Market Future Opportunities: USD 46.11 billion
  • CAGR from 2025 to 2030 : 16%

Market Summary

  • The enterprise governance, risk, and compliance (egrc) solutions market is undergoing a fundamental transformation, moving away from siloed, manual processes toward integrated, automated frameworks. This shift is driven by escalating regulatory complexity and the need for greater operational resilience in a volatile business environment.
  • Core to this evolution is the adoption of technologies like agentic artificial intelligence and predictive risk analytics, which enable organizations to perform real-time risk quantification and continuous compliance monitoring.
  • For instance, a multinational financial institution can leverage a unified GRC platform to automatically map thousands of internal controls to global regulations like GDPR and SOX, while simultaneously conducting climate-related stress testing for its investment portfolio. The institutionalization of environmental, social, and governance (ESG) criteria further expands the scope, requiring robust systems for non-financial data verification and sustainability reporting.
  • These advancements are no longer optional but have become indispensable strategic assets for maintaining corporate integrity, mitigating financial penalties, and fostering stakeholder trust in a landscape where risk and opportunity are deeply intertwined. The use of automated remediation workflows and AI governance frameworks is now a key differentiator.

What will be the Size of the Enterprise Governance, Risk, And Compliance (egrc) Solutions Market during the forecast period?

Get Key Insights on Market Forecast (PDF) Request Free Sample

How is the Enterprise Governance, Risk, And Compliance (egrc) Solutions Market Segmented?

The enterprise governance, risk, and compliance (egrc) solutions industry research report provides comprehensive data (region-wise segment analysis), with forecasts and estimates in "USD million" for the period 2026-2030, as well as historical data from 2020-2024 for the following segments.

  • End-user
    • Large enterpises
    • SMEs
  • Component
    • Software
    • Services
  • Deployment
    • Cloud-based
    • On-premises
  • Geography
    • North America
      • US
      • Canada
      • Mexico
    • Europe
      • Germany
      • UK
      • France
    • APAC
      • China
      • Japan
      • India
    • South America
      • Brazil
      • Argentina
    • Middle East and Africa
      • UAE
      • Saudi Arabia
      • South Africa
    • Rest of World (ROW)

By End-user Insights

The large enterpises segment is estimated to witness significant growth during the forecast period.

Large enterprises drive demand for enterprise governance, risk, and compliance (egrc) solutions, driven by the complexity of managing global operations.

These organizations require an integrated risk management platform to achieve a holistic risk posture view and enable strategic risk alignment process.

The adoption of agentic artificial intelligence and predictive risk analytics is standard for enabling real-time risk quantification and third-party risk assessment. To meet digital operational resilience mandates, firms are implementing centralized control frameworks and leveraging board-level risk dashboards for oversight.

With data privacy governance tools becoming essential, many opt for sovereign cloud deployment to manage data residency. The automation of non-financial data verification within these platforms improves ESG reporting accuracy by over 30%, streamlining supply chain due diligence automation.

Request Free Sample

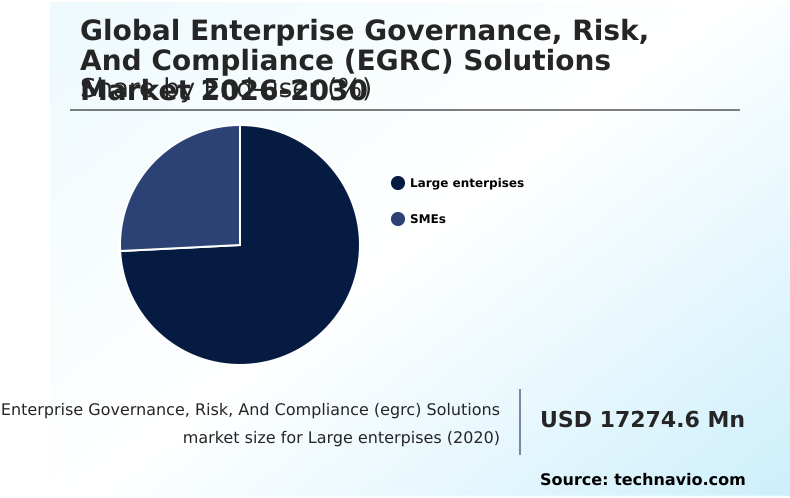
The Large enterpises segment was valued at USD 26.99 billion in 2024 and showed a gradual increase during the forecast period.

Request Free Sample

Regional Analysis

North America is estimated to contribute 44.7% to the growth of the global market during the forecast period.Technavio’s analysts have elaborately explained the regional trends and drivers that shape the market during the forecast period.

See How Enterprise Governance, Risk, And Compliance (egrc) Solutions Market Demand is Rising in North America Request Free Sample

The geographic landscape of the enterprise governance, risk, and compliance (egrc) solutions market is characterized by mature adoption in North America and Europe, which together represent over 76% of the global opportunity.

North America leads due to stringent regulatory pressures demanding robust cybersecurity incident disclosure platforms. In contrast, Europe focuses on digital operational resilience and data residency enforcement, driving demand for sovereign cloud deployment.

The APAC region is the fastest-growing market, with nations implementing their own AI governance frameworks. Organizations in this region are adopting GRC maturity modeling to align with global standards.

Across all regions, the use of automated evidence collection and cross-functional collaboration tools is becoming standard practice to manage the complexities of global trade and compliance.

Market Dynamics

Our researchers analyzed the data with 2025 as the base year, along with the key drivers, trends, and challenges. A holistic analysis of drivers will help companies refine their marketing strategies to gain a competitive advantage.

  • Achieving strategic advantage in the current business climate requires a sophisticated approach to governance, where implementing automated audit trails for sox compliance is just the starting point. For financial institutions, the focus is on deploying egrc solutions for financial services regulatory reporting and leveraging the benefits of ai in predictive risk analytics for banking to preemptively address market volatility.
  • Simultaneously, integrating esg metrics into existing grc platforms has become a non-negotiable board-level mandate, with specific egrc platforms for the digital operational resilience act gaining traction. The debate over cyber grc versus traditional it security management is settling, with integrated approaches proving superior for managing third-party risk with automated egrc software.
  • In sectors like healthcare, automating policy lifecycle oversight has been shown to reduce compliance documentation errors by more than half compared to manual methods. This highlights the growing role of cloud-based egrc for small and medium enterprises. The challenges are significant, including the complexities of data residency in egrc systems and ensuring best practices for ai model risk management.
  • Yet, the goals are clear: achieving continuous compliance monitoring with ai, using egrc for sustainability and climate reporting, and enabling real-time risk quantification for executive decisions. Advanced applications in semantic analysis for legal compliance and egrc for anti-money laundering (aml) automation further demonstrate the technology's expanding role, solidifying the roi of implementing an integrated risk management platform.

What are the key market drivers leading to the rise in the adoption of Enterprise Governance, Risk, And Compliance (egrc) Solutions Industry?

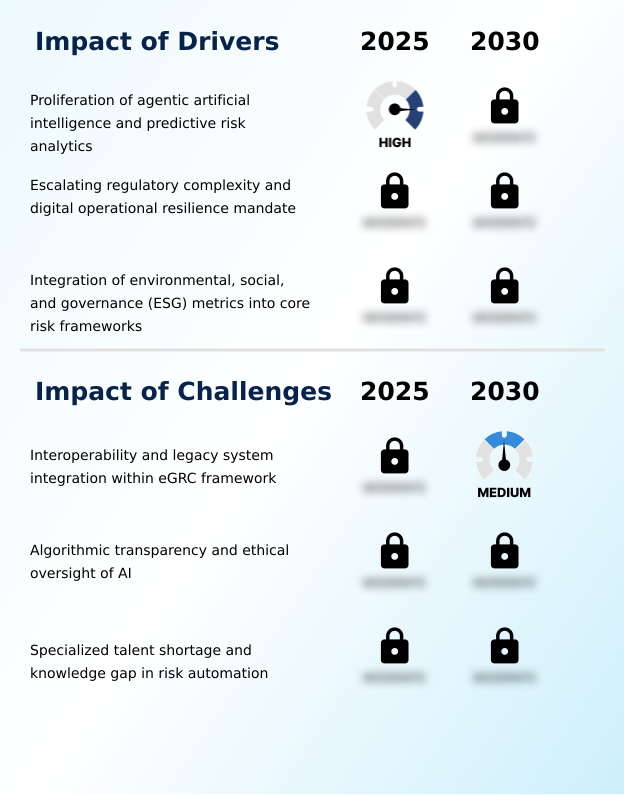
  • The proliferation of agentic artificial intelligence and predictive risk analytics serves as the primary driver propelling growth in the egrc solutions market.

  • Market growth is primarily driven by escalating regulatory complexity and the proliferation of AI. The need for digital operational resilience, mandated by new regulations, compels firms to adopt platforms offering GRC workflow automation.
  • Automating compliance with these tools can reduce reporting times by up to 50%. The integration of ESG metrics is another major driver; firms with robust non-financial data verification and sustainability reporting attract up to 10% more institutional capital.
  • This environment necessitates solutions with advanced quantitative risk modeling and regulatory change management automation to ensure continuous adherence and strategic advantage, making a clear business case for investment in modern GRC technology.

What are the market trends shaping the Enterprise Governance, Risk, And Compliance (egrc) Solutions Industry?

  • The evolution toward agentic governance represents a significant market trend, underscored by the increasing adoption of autonomous risk supervision technologies.

  • Key trends are reshaping the enterprise governance, risk, and compliance (egrc) solutions market, with a focus on autonomous and predictive capabilities. The evolution toward agentic artificial intelligence enables continuous control mapping and proactive threat identification, reducing manual control testing by 40%.
  • The strategic convergence of cyber GRC integration with business operations is critical, as unified platforms improve risk identification accuracy by over 25%. Furthermore, the institutionalization of ESG data aggregation and sustainability reporting modules is now a core requirement.
  • This shift transforms compliance from a reactive task to a strategic function, driven by tools for compliance stress testing and automated evidence collection.

What challenges does the Enterprise Governance, Risk, And Compliance (egrc) Solutions Industry face during its growth?

  • Significant challenges affecting market growth include interoperability issues and the complex integration of modern eGRC frameworks with legacy enterprise systems.

  • The market faces significant hurdles, primarily legacy system integration and a growing talent gap. Integrating modern eGRC platforms with outdated infrastructure can cause project budgets to overrun by 35%, challenging the adoption of a unified compliance framework.
  • This is compounded by the need for algorithmic transparency and AI model risk management, as organizations struggle to govern complex AI without standardized AI governance frameworks. Furthermore, a projected 20% shortfall in qualified GRC professionals with expertise in both compliance and data science hinders the effective use of advanced tools like those for real-time risk quantification and predictive risk analytics.

Exclusive Technavio Analysis on Customer Landscape

The enterprise governance, risk, and compliance (egrc) solutions market forecasting report includes the adoption lifecycle of the market, covering from the innovator’s stage to the laggard’s stage. It focuses on adoption rates in different regions based on penetration. Furthermore, the enterprise governance, risk, and compliance (egrc) solutions market report also includes key purchase criteria and drivers of price sensitivity to help companies evaluate and develop their market growth analysis strategies.

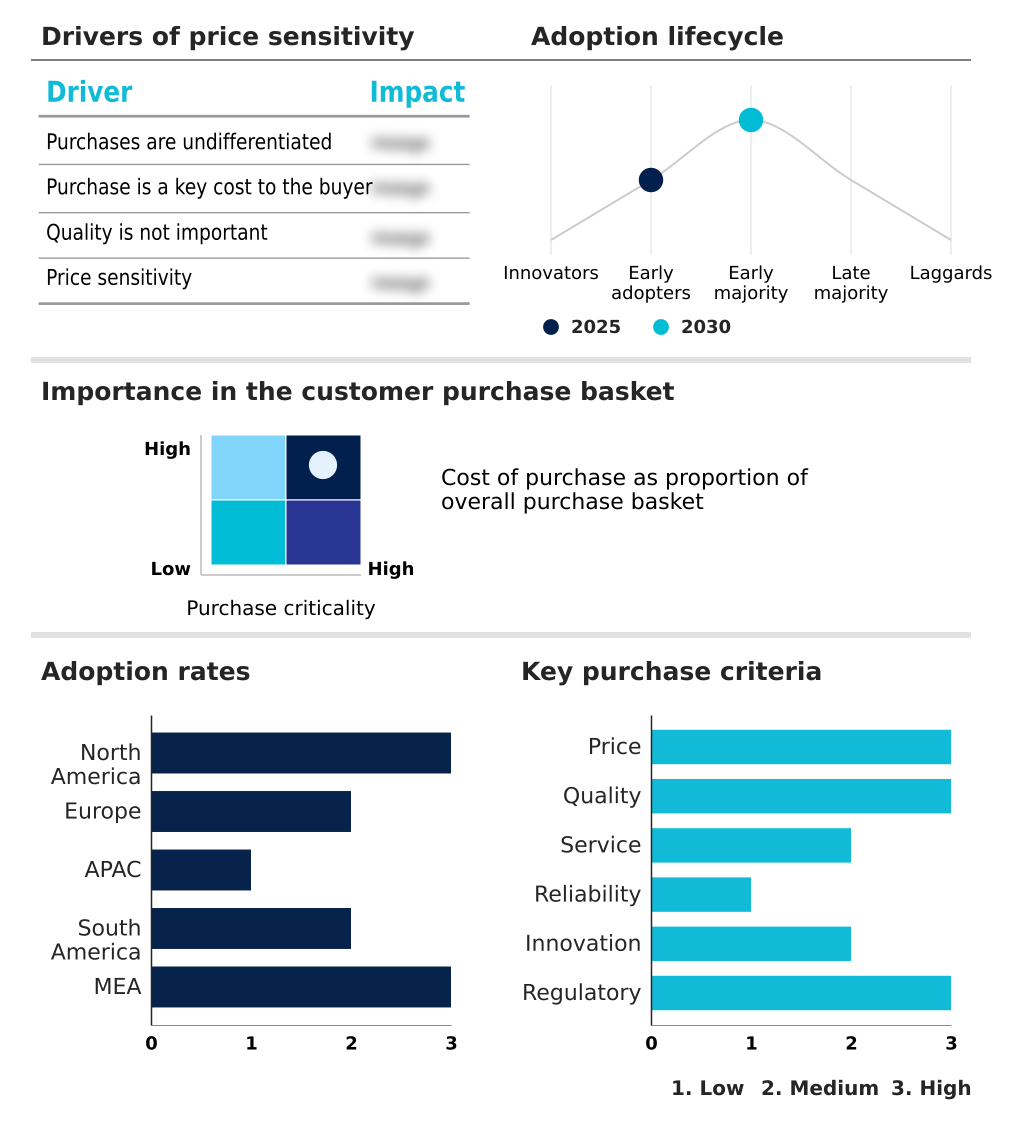
Customer Landscape of Enterprise Governance, Risk, And Compliance (egrc) Solutions Industry

Competitive Landscape

Companies are implementing various strategies, such as strategic alliances, enterprise governance, risk, and compliance (egrc) solutions market forecast, partnerships, mergers and acquisitions, geographical expansion, and product/service launches, to enhance their presence in the industry.

Dell Technologies Inc. - Vendors provide integrated risk management suites designed for comprehensive oversight and regulatory compliance, effectively centralizing core enterprise governance functions.

The industry research and growth report includes detailed analyses of the competitive landscape of the market and information about key companies, including:

  • Dell Technologies Inc.
  • Diligent Corp.
  • IBM Corp.
  • LogicGate Inc.
  • LogicManager Inc.
  • MetricStream Inc.
  • Microsoft Corp.
  • NAVEX Global Inc.
  • OneTrust LLC
  • Oracle Corp.
  • ProcessUnity Inc.
  • Quantivate LLC.
  • Resolver Inc.
  • Riskonnect Inc.
  • SAI360 Inc.
  • SAP SE
  • SAS Institute Inc.
  • ServiceNow Inc.
  • Software AG
  • SureCloud Ltd.

Qualitative and quantitative analysis of companies has been conducted to help clients understand the wider business environment as well as the strengths and weaknesses of key industry players. Data is qualitatively analyzed to categorize companies as pure play, category-focused, industry-focused, and diversified; it is quantitatively analyzed to categorize companies as dominant, leading, strong, tentative, and weak.

Recent Development and News in Enterprise governance, risk, and compliance (egrc) solutions market

  • In October 2024, MetricStream Inc. launched its AI-first Cyber GRC solution, which leverages autonomous reasoning to connect technical IT assets with executive-level risk reporting.
  • In February 2025, IBM Corp. released OpenPages 9.2, introducing enhanced AI-driven governance capabilities and generative AI features to help enterprises navigate complex regulatory environments.
  • In March 2025, Genpact announced a strategic alliance with ValidMind to enhance model risk management and AI governance capabilities for financial institutions, addressing evolving regulatory demands.
  • In April 2025, Diligent Corp. launched AI Risk Essentials, a solution engineered to accelerate the initiation of risk management programs by utilizing benchmarking data from SEC filings.

Dive into Technavio’s robust research methodology, blending expert interviews, extensive data synthesis, and validated models for unparalleled Enterprise Governance, Risk, And Compliance (egrc) Solutions Market insights. See full methodology.

Market Scope
Page number 290
Base year 2025
Historic period 2020-2024
Forecast period 2026-2030
Growth momentum & CAGR Accelerate at a CAGR of 16%
Market growth 2026-2030 USD 46111.0 million
Market structure Fragmented
YoY growth 2025-2026(%) 14.4%
Key countries US, Canada, Mexico, Germany, UK, France, Italy, Spain, The Netherlands, China, Japan, India, Australia, South Korea, Indonesia, Brazil, Argentina, Chile, UAE, Saudi Arabia, South Africa, Egypt and Nigeria
Competitive landscape Leading Companies, Market Positioning of Companies, Competitive Strategies, and Industry Risks

Request Free Sample

Research Analyst Overview

  • The enterprise governance, risk, and compliance (egrc) solutions market is defined by a technological pivot toward intelligent automation. The integration of agentic artificial intelligence and predictive risk analytics is no longer a futuristic concept but a present-day necessity for autonomous risk supervision.
  • Companies are deploying sophisticated GRC data architecture to enable continuous compliance monitoring, supported by immutable audit trails and real-time risk quantification. A key boardroom focus is on digital operational resilience, addressed through centralized control frameworks and robust ICT risk management protocols.
  • We are seeing a widespread adoption of cyber GRC integration and AI governance frameworks to manage everything from third-party risk assessment to algorithmic transparency. Firms using these advanced systems have demonstrated an ability to identify critical vulnerabilities up to 60% faster than those relying on periodic reviews.
  • The technology now enables automated incident tracking, policy lifecycle oversight, and even semantic analysis of legal texts for automated regulatory interpretation, fundamentally reshaping corporate oversight.

What are the Key Data Covered in this Enterprise Governance, Risk, And Compliance (egrc) Solutions Market Research and Growth Report?

  • What is the expected growth of the Enterprise Governance, Risk, And Compliance (egrc) Solutions Market between 2026 and 2030?

    • USD 46.11 billion, at a CAGR of 16%

  • What segmentation does the market report cover?

    • The report is segmented by End-user (Large enterpises, and SMEs), Component (Software, and Services), Deployment (Cloud-based, and On-premises) and Geography (North America, Europe, APAC, South America, Middle East and Africa)

  • Which regions are analyzed in the report?

    • North America, Europe, APAC, South America and Middle East and Africa

  • What are the key growth drivers and market challenges?

    • Proliferation of agentic artificial intelligence and predictive risk analytics , Interoperability and legacy system integration within eGRC framework

  • Who are the major players in the Enterprise Governance, Risk, And Compliance (egrc) Solutions Market?

    • Dell Technologies Inc., Diligent Corp., IBM Corp., LogicGate Inc., LogicManager Inc., MetricStream Inc., Microsoft Corp., NAVEX Global Inc., OneTrust LLC, Oracle Corp., ProcessUnity Inc., Quantivate LLC., Resolver Inc., Riskonnect Inc., SAI360 Inc., SAP SE, SAS Institute Inc., ServiceNow Inc., Software AG and SureCloud Ltd.

Market Research Insights

  • Market dynamics are defined by a strategic move toward platforms that unify governance, risk, and compliance functions. Organizations adopting an integrated risk management platform achieve a single source of truth for risk, which improves decision-making. Firms leveraging automated compliance reporting see a 25% faster response to regulatory inquiries and a 15% reduction in audit preparation costs.
  • This shift toward holistic oversight is crucial, as a connected risk intelligence approach has been shown to reduce the financial impact of disruptive events by up to 20%. The adoption of governance process orchestration is accelerating, with an emphasis on creating resilient and accountable enterprise ecosystems.

We can help! Our analysts can customize this enterprise governance, risk, and compliance (egrc) solutions market research report to meet your requirements.

Get in touch

1. Executive Summary

1.1 Market overview

Executive Summary - Chart on Market Overview
Executive Summary - Data Table on Market Overview
Executive Summary - Chart on Global Market Characteristics
Executive Summary - Chart on Market by Geography
Executive Summary - Chart on Market Segmentation by End-user
Executive Summary - Chart on Market Segmentation by Component
Executive Summary - Chart on Market Segmentation by Deployment
Executive Summary - Chart on Incremental Growth
Executive Summary - Data Table on Incremental Growth
Executive Summary - Chart on Company Market Positioning

2. Technavio Analysis

2.1 Analysis of price sensitivity, lifecycle, customer purchase basket, adoption rates, and purchase criteria

2.2 Criticality of inputs and Factors of differentiation

Chart on Overview on criticality of inputs and factors of differentiation

2.3 Factors of disruption

Chart on Overview on factors of disruption

2.4 Impact of drivers and challenges

Chart on Impact of drivers and challenges in 2025 and 2030

3. Market Landscape

3.1 Market ecosystem

Chart on Parent Market
Data Table on - Parent Market

3.2 Market characteristics

Chart on Market characteristics analysis

3.3 Value chain analysis

Chart on Value chain analysis

4. Market Sizing

4.1 Market definition

Data Table on Offerings of companies included in the market definition

4.2 Market segment analysis

Market segments

4.3 Market size 2025

4.4 Market outlook: Forecast for 2025-2030

Chart on Global - Market size and forecast 2025-2030 ($ million)
Data Table on Global - Market size and forecast 2025-2030 ($ million)
Chart on Global Market: Year-over-year growth 2025-2030 (%)
Data Table on Global Market: Year-over-year growth 2025-2030 (%)

5. Historic Market Size

5.1 Global Enterprise Governance, Risk, And Compliance (EGRC) Solutions Market 2020 - 2024

Historic Market Size - Data Table on Global Enterprise Governance, Risk, And Compliance (EGRC) Solutions Market 2020 - 2024 ($ million)

5.2 End-user segment analysis 2020 - 2024

Historic Market Size - End-user Segment 2020 - 2024 ($ million)

5.3 Component segment analysis 2020 - 2024

Historic Market Size - Component Segment 2020 - 2024 ($ million)

5.4 Deployment segment analysis 2020 - 2024

Historic Market Size - Deployment Segment 2020 - 2024 ($ million)

5.5 Geography segment analysis 2020 - 2024

Historic Market Size - Geography Segment 2020 - 2024 ($ million)

5.6 Country segment analysis 2020 - 2024

Historic Market Size - Country Segment 2020 - 2024 ($ million)

6. Qualitative Analysis

6.1 Impact of AI on global enterprise governance, risk, and compliance (eGRC) solutions market

6.2 Impact of geopolitical conflicts on global enterprise governance, risk, and compliance (eGRC) solutions market

7. Five Forces Analysis

7.1 Five forces summary

Five forces analysis - Comparison between 2025 and 2030

7.2 Bargaining power of buyers

Bargaining power of buyers - Impact of key factors 2025 and 2030

7.3 Bargaining power of suppliers

Bargaining power of suppliers - Impact of key factors in 2025 and 2030

7.4 Threat of new entrants

Threat of new entrants - Impact of key factors in 2025 and 2030

7.5 Threat of substitutes

Threat of substitutes - Impact of key factors in 2025 and 2030

7.6 Threat of rivalry

Threat of rivalry - Impact of key factors in 2025 and 2030

7.7 Market condition

Chart on Market condition - Five forces 2025 and 2030

8. Market Segmentation by End-user

8.1 Market segments

Chart on End-user - Market share 2025-2030 (%)
Data Table on End-user - Market share 2025-2030 (%)

8.2 Comparison by End-user

Chart on Comparison by End-user
Data Table on Comparison by End-user

8.3 Large enterpises - Market size and forecast 2025-2030

Chart on Large enterpises - Market size and forecast 2025-2030 ($ million)
Data Table on Large enterpises - Market size and forecast 2025-2030 ($ million)
Chart on Large enterpises - Year-over-year growth 2025-2030 (%)
Data Table on Large enterpises - Year-over-year growth 2025-2030 (%)

8.4 SMEs - Market size and forecast 2025-2030

Chart on SMEs - Market size and forecast 2025-2030 ($ million)
Data Table on SMEs - Market size and forecast 2025-2030 ($ million)
Chart on SMEs - Year-over-year growth 2025-2030 (%)
Data Table on SMEs - Year-over-year growth 2025-2030 (%)

8.5 Market opportunity by End-user

Market opportunity by End-user ($ million)
Data Table on Market opportunity by End-user ($ million)

9. Market Segmentation by Component

9.1 Market segments

Chart on Component - Market share 2025-2030 (%)
Data Table on Component - Market share 2025-2030 (%)

9.2 Comparison by Component

Chart on Comparison by Component
Data Table on Comparison by Component

9.3 Software - Market size and forecast 2025-2030

Chart on Software - Market size and forecast 2025-2030 ($ million)
Data Table on Software - Market size and forecast 2025-2030 ($ million)
Chart on Software - Year-over-year growth 2025-2030 (%)
Data Table on Software - Year-over-year growth 2025-2030 (%)

9.4 Services - Market size and forecast 2025-2030

Chart on Services - Market size and forecast 2025-2030 ($ million)
Data Table on Services - Market size and forecast 2025-2030 ($ million)
Chart on Services - Year-over-year growth 2025-2030 (%)
Data Table on Services - Year-over-year growth 2025-2030 (%)

9.5 Market opportunity by Component

Market opportunity by Component ($ million)
Data Table on Market opportunity by Component ($ million)

10. Market Segmentation by Deployment

10.1 Market segments

Chart on Deployment - Market share 2025-2030 (%)
Data Table on Deployment - Market share 2025-2030 (%)

10.2 Comparison by Deployment

Chart on Comparison by Deployment
Data Table on Comparison by Deployment

10.3 Cloud-based - Market size and forecast 2025-2030

Chart on Cloud-based - Market size and forecast 2025-2030 ($ million)
Data Table on Cloud-based - Market size and forecast 2025-2030 ($ million)
Chart on Cloud-based - Year-over-year growth 2025-2030 (%)
Data Table on Cloud-based - Year-over-year growth 2025-2030 (%)

10.4 On-premises - Market size and forecast 2025-2030

Chart on On-premises - Market size and forecast 2025-2030 ($ million)
Data Table on On-premises - Market size and forecast 2025-2030 ($ million)
Chart on On-premises - Year-over-year growth 2025-2030 (%)
Data Table on On-premises - Year-over-year growth 2025-2030 (%)

10.5 Market opportunity by Deployment

Market opportunity by Deployment ($ million)
Data Table on Market opportunity by Deployment ($ million)

11. Customer Landscape

11.1 Customer landscape overview

Analysis of price sensitivity, lifecycle, customer purchase basket, adoption rates, and purchase criteria

12. Geographic Landscape

12.1 Geographic segmentation

Chart on Market share by geography 2025-2030 (%)
Data Table on Market share by geography 2025-2030 (%)

12.2 Geographic comparison

Chart on Geographic comparison
Data Table on Geographic comparison

12.3 North America - Market size and forecast 2025-2030

Chart on North America - Market size and forecast 2025-2030 ($ million)
Data Table on North America - Market size and forecast 2025-2030 ($ million)
Chart on North America - Year-over-year growth 2025-2030 (%)
Data Table on North America - Year-over-year growth 2025-2030 (%)
Chart on Regional Comparison - North America
Data Table on Regional Comparison - North America

12.3.1 US - Market size and forecast 2025-2030

Chart on US - Market size and forecast 2025-2030 ($ million)
Data Table on US - Market size and forecast 2025-2030 ($ million)
Chart on US - Year-over-year growth 2025-2030 (%)
Data Table on US - Year-over-year growth 2025-2030 (%)

12.3.2 Canada - Market size and forecast 2025-2030

Chart on Canada - Market size and forecast 2025-2030 ($ million)
Data Table on Canada - Market size and forecast 2025-2030 ($ million)
Chart on Canada - Year-over-year growth 2025-2030 (%)
Data Table on Canada - Year-over-year growth 2025-2030 (%)

12.3.3 Mexico - Market size and forecast 2025-2030

Chart on Mexico - Market size and forecast 2025-2030 ($ million)
Data Table on Mexico - Market size and forecast 2025-2030 ($ million)
Chart on Mexico - Year-over-year growth 2025-2030 (%)
Data Table on Mexico - Year-over-year growth 2025-2030 (%)

12.4 Europe - Market size and forecast 2025-2030

Chart on Europe - Market size and forecast 2025-2030 ($ million)
Data Table on Europe - Market size and forecast 2025-2030 ($ million)
Chart on Europe - Year-over-year growth 2025-2030 (%)
Data Table on Europe - Year-over-year growth 2025-2030 (%)
Chart on Regional Comparison - Europe
Data Table on Regional Comparison - Europe

12.4.1 Germany - Market size and forecast 2025-2030

Chart on Germany - Market size and forecast 2025-2030 ($ million)
Data Table on Germany - Market size and forecast 2025-2030 ($ million)
Chart on Germany - Year-over-year growth 2025-2030 (%)
Data Table on Germany - Year-over-year growth 2025-2030 (%)

12.4.2 UK - Market size and forecast 2025-2030

Chart on UK - Market size and forecast 2025-2030 ($ million)
Data Table on UK - Market size and forecast 2025-2030 ($ million)
Chart on UK - Year-over-year growth 2025-2030 (%)
Data Table on UK - Year-over-year growth 2025-2030 (%)

12.4.3 France - Market size and forecast 2025-2030

Chart on France - Market size and forecast 2025-2030 ($ million)
Data Table on France - Market size and forecast 2025-2030 ($ million)
Chart on France - Year-over-year growth 2025-2030 (%)
Data Table on France - Year-over-year growth 2025-2030 (%)

12.4.4 Italy - Market size and forecast 2025-2030

Chart on Italy - Market size and forecast 2025-2030 ($ million)
Data Table on Italy - Market size and forecast 2025-2030 ($ million)
Chart on Italy - Year-over-year growth 2025-2030 (%)
Data Table on Italy - Year-over-year growth 2025-2030 (%)

12.4.5 Spain - Market size and forecast 2025-2030

Chart on Spain - Market size and forecast 2025-2030 ($ million)
Data Table on Spain - Market size and forecast 2025-2030 ($ million)
Chart on Spain - Year-over-year growth 2025-2030 (%)
Data Table on Spain - Year-over-year growth 2025-2030 (%)

12.4.6 The Netherlands - Market size and forecast 2025-2030

Chart on The Netherlands - Market size and forecast 2025-2030 ($ million)
Data Table on The Netherlands - Market size and forecast 2025-2030 ($ million)
Chart on The Netherlands - Year-over-year growth 2025-2030 (%)
Data Table on The Netherlands - Year-over-year growth 2025-2030 (%)

12.5 APAC - Market size and forecast 2025-2030

Chart on APAC - Market size and forecast 2025-2030 ($ million)
Data Table on APAC - Market size and forecast 2025-2030 ($ million)
Chart on APAC - Year-over-year growth 2025-2030 (%)
Data Table on APAC - Year-over-year growth 2025-2030 (%)
Chart on Regional Comparison - APAC
Data Table on Regional Comparison - APAC

12.5.1 China - Market size and forecast 2025-2030

Chart on China - Market size and forecast 2025-2030 ($ million)
Data Table on China - Market size and forecast 2025-2030 ($ million)
Chart on China - Year-over-year growth 2025-2030 (%)
Data Table on China - Year-over-year growth 2025-2030 (%)

12.5.2 Japan - Market size and forecast 2025-2030

Chart on Japan - Market size and forecast 2025-2030 ($ million)
Data Table on Japan - Market size and forecast 2025-2030 ($ million)
Chart on Japan - Year-over-year growth 2025-2030 (%)
Data Table on Japan - Year-over-year growth 2025-2030 (%)

12.5.3 India - Market size and forecast 2025-2030

Chart on India - Market size and forecast 2025-2030 ($ million)
Data Table on India - Market size and forecast 2025-2030 ($ million)
Chart on India - Year-over-year growth 2025-2030 (%)
Data Table on India - Year-over-year growth 2025-2030 (%)

12.5.4 Australia - Market size and forecast 2025-2030

Chart on Australia - Market size and forecast 2025-2030 ($ million)
Data Table on Australia - Market size and forecast 2025-2030 ($ million)
Chart on Australia - Year-over-year growth 2025-2030 (%)
Data Table on Australia - Year-over-year growth 2025-2030 (%)

12.5.5 South Korea - Market size and forecast 2025-2030

Chart on South Korea - Market size and forecast 2025-2030 ($ million)
Data Table on South Korea - Market size and forecast 2025-2030 ($ million)
Chart on South Korea - Year-over-year growth 2025-2030 (%)
Data Table on South Korea - Year-over-year growth 2025-2030 (%)

12.5.6 Indonesia - Market size and forecast 2025-2030

Chart on Indonesia - Market size and forecast 2025-2030 ($ million)
Data Table on Indonesia - Market size and forecast 2025-2030 ($ million)
Chart on Indonesia - Year-over-year growth 2025-2030 (%)
Data Table on Indonesia - Year-over-year growth 2025-2030 (%)

12.6 South America - Market size and forecast 2025-2030

Chart on South America - Market size and forecast 2025-2030 ($ million)
Data Table on South America - Market size and forecast 2025-2030 ($ million)
Chart on South America - Year-over-year growth 2025-2030 (%)
Data Table on South America - Year-over-year growth 2025-2030 (%)
Chart on Regional Comparison - South America
Data Table on Regional Comparison - South America

12.6.1 Brazil - Market size and forecast 2025-2030

Chart on Brazil - Market size and forecast 2025-2030 ($ million)
Data Table on Brazil - Market size and forecast 2025-2030 ($ million)
Chart on Brazil - Year-over-year growth 2025-2030 (%)
Data Table on Brazil - Year-over-year growth 2025-2030 (%)

12.6.2 Argentina - Market size and forecast 2025-2030

Chart on Argentina - Market size and forecast 2025-2030 ($ million)
Data Table on Argentina - Market size and forecast 2025-2030 ($ million)
Chart on Argentina - Year-over-year growth 2025-2030 (%)
Data Table on Argentina - Year-over-year growth 2025-2030 (%)

12.6.3 Chile - Market size and forecast 2025-2030

Chart on Chile - Market size and forecast 2025-2030 ($ million)
Data Table on Chile - Market size and forecast 2025-2030 ($ million)
Chart on Chile - Year-over-year growth 2025-2030 (%)
Data Table on Chile - Year-over-year growth 2025-2030 (%)

12.7 Middle East and Africa - Market size and forecast 2025-2030

Chart on Middle East and Africa - Market size and forecast 2025-2030 ($ million)
Data Table on Middle East and Africa - Market size and forecast 2025-2030 ($ million)
Chart on Middle East and Africa - Year-over-year growth 2025-2030 (%)
Data Table on Middle East and Africa - Year-over-year growth 2025-2030 (%)
Chart on Regional Comparison - Middle East and Africa
Data Table on Regional Comparison - Middle East and Africa

12.7.1 UAE - Market size and forecast 2025-2030

Chart on UAE - Market size and forecast 2025-2030 ($ million)
Data Table on UAE - Market size and forecast 2025-2030 ($ million)
Chart on UAE - Year-over-year growth 2025-2030 (%)
Data Table on UAE - Year-over-year growth 2025-2030 (%)

12.7.2 Saudi Arabia - Market size and forecast 2025-2030

Chart on Saudi Arabia - Market size and forecast 2025-2030 ($ million)
Data Table on Saudi Arabia - Market size and forecast 2025-2030 ($ million)
Chart on Saudi Arabia - Year-over-year growth 2025-2030 (%)
Data Table on Saudi Arabia - Year-over-year growth 2025-2030 (%)

12.7.3 South Africa - Market size and forecast 2025-2030

Chart on South Africa - Market size and forecast 2025-2030 ($ million)
Data Table on South Africa - Market size and forecast 2025-2030 ($ million)
Chart on South Africa - Year-over-year growth 2025-2030 (%)
Data Table on South Africa - Year-over-year growth 2025-2030 (%)

12.7.4 Egypt - Market size and forecast 2025-2030

Chart on Egypt - Market size and forecast 2025-2030 ($ million)
Data Table on Egypt - Market size and forecast 2025-2030 ($ million)
Chart on Egypt - Year-over-year growth 2025-2030 (%)
Data Table on Egypt - Year-over-year growth 2025-2030 (%)

12.7.5 Nigeria - Market size and forecast 2025-2030

Chart on Nigeria - Market size and forecast 2025-2030 ($ million)
Data Table on Nigeria - Market size and forecast 2025-2030 ($ million)
Chart on Nigeria - Year-over-year growth 2025-2030 (%)
Data Table on Nigeria - Year-over-year growth 2025-2030 (%)

12.8 Market opportunity by geography

Market opportunity by geography ($ million)
Data Tables on Market opportunity by geography ($ million)

13. Drivers, Challenges, and Opportunity

13.1 Market drivers

Proliferation of agentic artificial intelligence and predictive risk analytics
Escalating regulatory complexity and digital operational resilience mandate
Integration of environmental, social, and governance (ESG) metrics into core risk frameworks

13.2 Market challenges

Interoperability and legacy system integration within eGRC framework
Algorithmic transparency and ethical oversight of AI
Specialized talent shortage and knowledge gap in risk automation

13.3 Impact of drivers and challenges

Impact of drivers and challenges in 2025 and 2030

13.4 Market opportunities

Evolution of agentic governance and autonomous risk supervision
Strategic convergence of cybersecurity risk and operational resilience
Institutionalization of ESG and sustainable governance frameworks

14. Competitive Landscape

14.1 Overview

14.2

Overview on criticality of inputs and factors of differentiation

14.3 Landscape disruption

Overview on factors of disruption

14.4 Industry risks

Impact of key risks on business

15. Competitive Analysis

15.1 Companies profiled

Companies covered

15.2 Company ranking index

15.3 Market positioning of companies

Matrix on companies position and classification

15.4 Dell Technologies Inc.

Dell Technologies Inc. - Overview
Dell Technologies Inc. - Business segments
Dell Technologies Inc. - Key news
Dell Technologies Inc. - Key offerings
Dell Technologies Inc. - Segment focus
SWOT

15.5 Diligent Corp.

Diligent Corp. - Overview
Diligent Corp. - Product / Service
Diligent Corp. - Key offerings
SWOT

15.6 IBM Corp.

IBM Corp. - Overview
IBM Corp. - Business segments
IBM Corp. - Key news
IBM Corp. - Key offerings
IBM Corp. - Segment focus
SWOT

15.7 MetricStream Inc.

MetricStream Inc. - Overview
MetricStream Inc. - Product / Service
MetricStream Inc. - Key offerings
SWOT

15.8 Microsoft Corp.

Microsoft Corp. - Overview
Microsoft Corp. - Business segments
Microsoft Corp. - Key news
Microsoft Corp. - Key offerings
Microsoft Corp. - Segment focus
SWOT

15.9 NAVEX Global Inc.

NAVEX Global Inc. - Overview
NAVEX Global Inc. - Product / Service
NAVEX Global Inc. - Key offerings
SWOT

15.10 OneTrust LLC

OneTrust LLC - Overview
OneTrust LLC - Product / Service
OneTrust LLC - Key offerings
SWOT

15.11 Oracle Corp.

Oracle Corp. - Overview
Oracle Corp. - Business segments
Oracle Corp. - Key news
Oracle Corp. - Key offerings
Oracle Corp. - Segment focus
SWOT

15.12 Resolver Inc.

Resolver Inc. - Overview
Resolver Inc. - Product / Service
Resolver Inc. - Key offerings
SWOT

15.13 Riskonnect Inc.

Riskonnect Inc. - Overview
Riskonnect Inc. - Product / Service
Riskonnect Inc. - Key offerings
SWOT

15.14 SAI360 Inc.

SAI360 Inc. - Overview
SAI360 Inc. - Product / Service
SAI360 Inc. - Key offerings
SWOT

15.15 SAP SE

SAP SE - Overview
SAP SE - Business segments
SAP SE - Key news
SAP SE - Key offerings
SAP SE - Segment focus
SWOT

15.16 SAS Institute Inc.

SAS Institute Inc. - Overview
SAS Institute Inc. - Product / Service
SAS Institute Inc. - Key offerings
SWOT

15.17 ServiceNow Inc.

ServiceNow Inc. - Overview
ServiceNow Inc. - Product / Service
ServiceNow Inc. - Key news
ServiceNow Inc. - Key offerings
SWOT

15.18 Software AG

Software AG - Overview
Software AG - Product / Service
Software AG - Key offerings
SWOT

16. Appendix

16.1 Scope of the report

Market definition
Objectives
Notes and caveats

16.2 Inclusions and exclusions checklist

Inclusions checklist
Exclusions checklist

16.3 Currency conversion rates for US$

16.4 Research methodology

16.5 Data procurement

Information sources

16.6 Data validation

16.7 Validation techniques employed for market sizing

16.8 Data synthesis

16.9 360 degree market analysis

16.10 List of abbreviations

Research Methodology

Technavio presents a detailed picture of the market by way of study, synthesis, and summation of data from multiple sources. The analysts have presented the various facets of the market with a particular focus on identifying the key industry influencers. The data thus presented is comprehensive, reliable, and the result of extensive research, both primary and secondary.

INFORMATION SOURCES

Primary sources

  • Manufacturers and suppliers
  • Channel partners
  • Industry experts
  • Strategic decision makers

Secondary sources

  • Industry journals and periodicals
  • Government data
  • Financial reports of key industry players
  • Historical data
  • Press releases

DATA ANALYSIS

Data Synthesis

  • Collation of data
  • Estimation of key figures
  • Analysis of derived insights

Data Validation

  • Triangulation with data models
  • Reference against proprietary databases
  • Corroboration with industry experts

REPORT WRITING

Qualitative

  • Market drivers
  • Market challenges
  • Market trends
  • Five forces analysis

Quantitative

  • Market size and forecast
  • Market segmentation
  • Geographical insights
  • Competitive landscape

Interested in this report?

Get your sample now to see our research methodology and insights!

Download Now

Frequently Asked Questions

Enterprise Governance, Risk, And Compliance (egrc) Solutions market growth will increase by USD 46111.0 million during 2026-2030.

The Enterprise Governance, Risk, And Compliance (egrc) Solutions market is expected to grow at a CAGR of 16% during 2026-2030.

Enterprise Governance, Risk, And Compliance (egrc) Solutions market is segmented by End-user (Large enterpises, SMEs) Component (Software, Services) Deployment (Cloud-based, On-premises)

Dell Technologies Inc., Diligent Corp., IBM Corp., LogicGate Inc., LogicManager Inc., MetricStream Inc., Microsoft Corp., NAVEX Global Inc., OneTrust LLC, Oracle Corp., ProcessUnity Inc., Quantivate LLC., Resolver Inc., Riskonnect Inc., SAI360 Inc., SAP SE, SAS Institute Inc., ServiceNow Inc., Software AG, SureCloud Ltd. are a few of the key vendors in the Enterprise Governance, Risk, And Compliance (egrc) Solutions market.

North America will register the highest growth rate of 44.7% among the other regions. Therefore, the Enterprise Governance, Risk, And Compliance (egrc) Solutions market in North America is expected to garner significant business opportunities for the vendors during the forecast period.

US, Canada, Mexico, Germany, UK, France, Italy, Spain, The Netherlands, China, Japan, India, Australia, South Korea, Indonesia, Brazil, Argentina, Chile, UAE, Saudi Arabia, South Africa, Egypt, Nigeria

  • Proliferation of agentic artificial intelligence and predictive risk analytics is the driving factor this market.

The Enterprise Governance, Risk, And Compliance (egrc) Solutions market vendors should focus on grabbing business opportunities from the End-user segment as it accounted for the largest market share in the base year.
RIA - Research AI Assistant
Ask RIA