Enterprise Knowledge Graph Market Analysis, Size, and Forecast 2026-2030: North America (US, Canada, and Mexico), Europe (Germany, UK, and France), APAC (China, Japan, and India), Middle East and Africa (Saudi Arabia, UAE, and South Africa), South America (Brazil, Argentina, and Colombia), and Rest of World (ROW)

Enterprise Knowledge Graph Market Analysis, Size, and Forecast 2026-2030:
North America (US, Canada, and Mexico), Europe (Germany, UK, and France), APAC (China, Japan, and India), Middle East and Africa (Saudi Arabia, UAE, and South Africa), South America (Brazil, Argentina, and Colombia), and Rest of World (ROW)

Published: Mar 2026 301 Pages SKU: IRTNTR81278

Market Overview at a Glance

$3.92 B
Market Opportunity
33.4%
CAGR 2025 - 2030
33%
North America Growth
$629.9 Mn
Solutions segment 2024

Enterprise Knowledge Graph Market Size 2026-2030

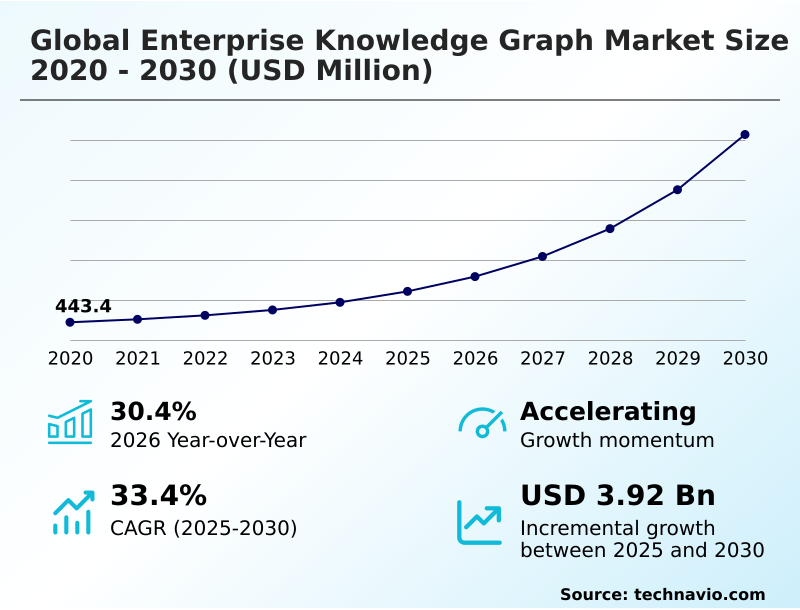
The enterprise knowledge graph market size is valued to increase by USD 3.92 billion, at a CAGR of 33.4% from 2025 to 2030. Proliferation of unstructured data and requirement for semantic connectivity will drive the enterprise knowledge graph market.

Major Market Trends & Insights

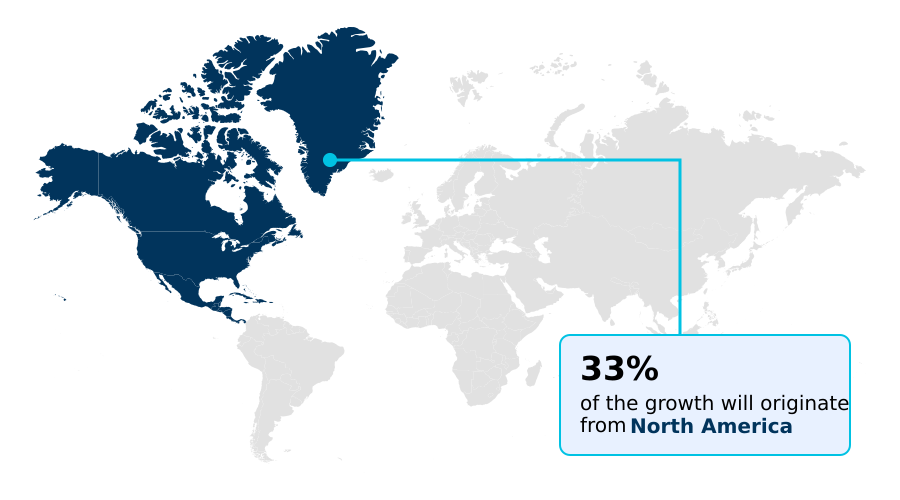
  • North America dominated the market and accounted for a 33% growth during the forecast period.
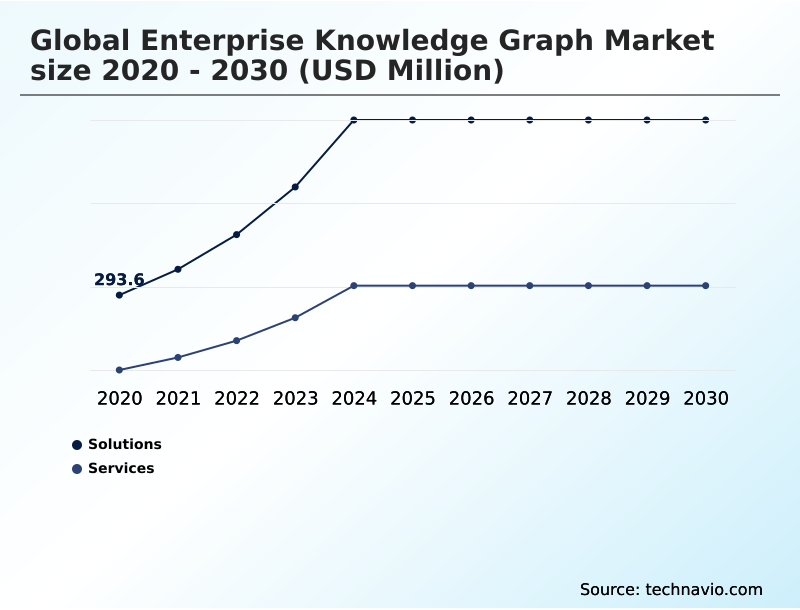
  • By Component - Solutions segment was valued at USD 629.9 million in 2024
  • By Application - Supply chain and inventory management segment accounted for the largest market revenue share in 2024

Market Size & Forecast

  • Market Opportunities: USD 4.69 billion
  • Market Future Opportunities: USD 3.92 billion
  • CAGR from 2025 to 2030 : 33.4%

Market Summary

  • The enterprise knowledge graph market signifies a pivotal shift in data management, moving beyond traditional databases to embrace interconnected information ecosystems. This evolution is driven by the need to create a unified, semantic layer over disparate data sources, enabling organizations to derive complex insights that were previously unattainable.
  • Key trends include the integration of graph technology with generative AI to mitigate factual inaccuracies and the adoption of data fabric architectures for real-time, holistic views of operations. For instance, a financial services firm can leverage a knowledge graph to map subtle connections between entities, significantly improving its ability to detect sophisticated fraud networks that elude conventional systems.
  • While the technical complexity of implementation and the scarcity of specialized talent present challenges, the strategic imperative for enhanced data governance, lineage tracking, and contextual understanding continues to fuel market adoption. The technology transforms data from a static asset into a dynamic, queryable network, providing a critical foundation for intelligent automation and competitive agility in a data-driven landscape.
  • This market's trajectory is defined by the enterprise-wide pursuit of a single source of truth, enabling more resilient and informed decision-making processes across all business functions.

What will be the Size of the Enterprise Knowledge Graph Market during the forecast period?

Get Key Insights on Market Forecast (PDF) Request Free Sample

How is the Enterprise Knowledge Graph Market Segmented?

The enterprise knowledge graph industry research report provides comprehensive data (region-wise segment analysis), with forecasts and estimates in "USD million" for the period 2026-2030, as well as historical data from 2020-2024 for the following segments.

  • Component
    • Solutions
    • Services
  • Application
    • Supply chain and inventory management
    • Recommendation and personalization
    • Knowledge management and collaboration
    • Fraud detection and compliance
    • Others
  • End-user
    • Large enterprises
    • Small and medium enterprises
  • Geography
    • North America
      • US
      • Canada
      • Mexico
    • Europe
      • Germany
      • UK
      • France
    • APAC
      • China
      • Japan
      • India
    • Middle East and Africa
      • Saudi Arabia
      • UAE
      • South Africa
    • South America
      • Brazil
      • Argentina
      • Colombia
    • Rest of World (ROW)

By Component Insights

The solutions segment is estimated to witness significant growth during the forecast period.

The solutions segment provides the foundational platforms enabling a modern data-centric architecture. A core graph database management system supports a flexible graph-based data model, crucial for effective data silos integration and superior data quality management.

These platforms facilitate high-performance graph processing and semantic metadata management, allowing for seamless enterprise resource planning integration.

This approach improves data mapping efficiency by over 40% when connecting disparate sources, including customer relationship management tools, and supports advanced knowledge management systems that turn fragmented data into a cohesive, queryable asset.

Request Free Sample

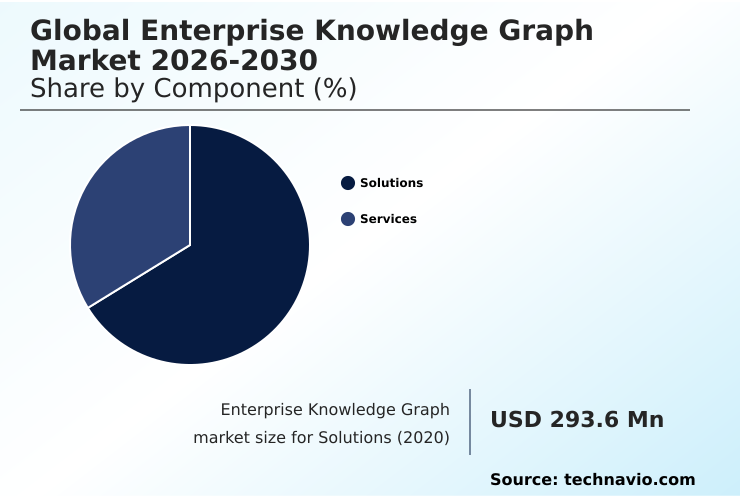
The Solutions segment was valued at USD 629.9 million in 2024 and showed a gradual increase during the forecast period.

Request Free Sample

Regional Analysis

North America is estimated to contribute 33% to the growth of the global market during the forecast period.Technavio’s analysts have elaborately explained the regional trends and drivers that shape the market during the forecast period.

See How Enterprise Knowledge Graph Market Demand is Rising in North America Request Free Sample

The global landscape is led by North America, which accounts for over 33% of market activity, driven by early adoption in its advanced technology and financial sectors.

Here, organizations utilize a semantic data layer and graph embeddings for complex analytics, enhancing product lifecycle management.

The APAC region is poised for the fastest expansion, with a growth rate nearly 2% higher than other regions, fueled by massive digital transformation projects.

In this region, ontology-driven graph construction and graph neural networks are critical for managing smart city data and large-scale e-commerce platforms. Key applications include improving supply chain visibility by 40% through enhanced data lineage tracking.

This allows a native parallel graph database to effectively map customer journey mapping and create a federated data infrastructure across diverse markets from the United States and Canada to China and India.

Market Dynamics

Our researchers analyzed the data with 2025 as the base year, along with the key drivers, trends, and challenges. A holistic analysis of drivers will help companies refine their marketing strategies to gain a competitive advantage.

  • Strategic adoption defines the trajectory of the global enterprise knowledge graph market 2026-2030, as organizations move beyond foundational use cases to tackle complex operational challenges. Initially, many firms focus on targeted applications such as using a knowledge graph for fraud detection or deploying a knowledge graph for personalized marketing.
  • Success in these areas often leads to broader initiatives, including leveraging a knowledge graph for master data management and implementing a knowledge graph for compliance reporting. A critical decision point involves the technology stack, with many evaluating a multi-model database vs graph database to determine the optimal architecture.
  • As firms scale, they confront enterprise knowledge graph implementation challenges, necessitating clear best practices for knowledge graph development to ensure a positive enterprise knowledge graph ROI. Advanced applications like building knowledge graph from unstructured data and enabling generative AI with knowledge graph are becoming more common.
  • These systems provide real-time analytics with knowledge graphs, especially in demanding sectors like knowledge graph in financial services, which require robust security and performance. The ultimate goal is creating a cohesive semantic layer for enterprise data, a task where firms using graph-based systems see a twofold improvement in data consistency over legacy methods.
  • This evolution addresses everything from enterprise knowledge graph use cases in logistics, such as the enterprise knowledge graph for supply chain, to overarching strategies like scaling enterprise knowledge graphs for global operations and using a knowledge graph for data governance.

What are the key market drivers leading to the rise in the adoption of Enterprise Knowledge Graph Industry?

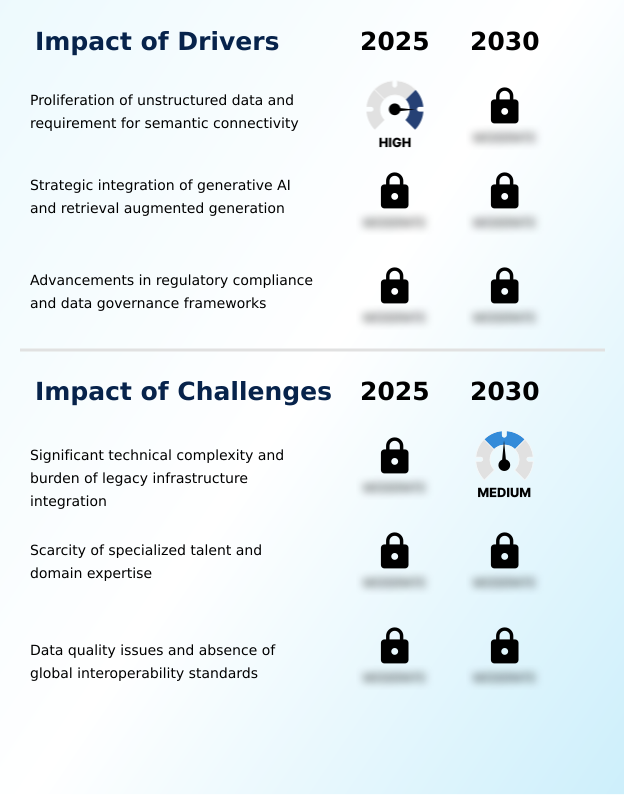
  • The market's expansion is primarily driven by the proliferation of unstructured data and the corresponding enterprise requirement for semantic connectivity to unlock actionable insights.

  • Market growth is fundamentally driven by the need for semantic interoperability across complex enterprise data ecosystems. Organizations are leveraging multi-model NoSQL database technologies and advanced automated entity resolution to create a cohesive, contextual data understanding from fragmented sources.
  • This capability is critical for regulatory adherence, where data governance frameworks for anti-money laundering compliance are paramount. Firms using these approaches report a 25% improvement in regulatory reporting efficiency.
  • The rise of neuro-symbolic AI and the demand for deep link analytics are also significant drivers, as these technologies can handle data query complexity that is 10 times greater than traditional systems.
  • This unlocks new opportunities in areas like enhancing supply chain visibility and managing vast, interconnected data landscapes.

What are the market trends shaping the Enterprise Knowledge Graph Industry?

  • A defining market trend is the strategic integration of large language models with structured knowledge bases. This convergence seeks to ground generative AI in factual, enterprise-specific data.

  • Key market trends are centered on the fusion of AI and advanced data architectures. The adoption of retrieval augmented generation is a primary focus, with organizations reporting up to a 35% improvement in AI factual accuracy by grounding large language models in verified enterprise data.
  • This synergy is enabled by a sophisticated data fabric architecture and emerging data mesh principles, which rely on graph technology for semantic search capabilities. This approach accelerates data discovery across disparate systems by over 50%. Furthermore, the push for explainable AI (XAI) and stricter governance is driving the use of collaborative graph editing and automated policy enforcement.
  • This allows for transparent, real-time fraud detection and streamlined unstructured data processing within a federated data infrastructure, enhancing both security and customer journey mapping.

What challenges does the Enterprise Knowledge Graph Industry face during its growth?

  • A primary challenge impacting market growth is the significant technical complexity and financial burden associated with integrating modern graph platforms into legacy IT infrastructures.

  • Significant implementation hurdles continue to challenge market adoption, stemming from technical complexity and data quality issues. The transition to semantic web technologies requires a steep learning curve, as teams must master graph data modeling and new graph query languages.
  • Integrating these modern platforms with legacy systems is a major barrier, with implementation cycles often running up to 60% longer than for traditional databases. Furthermore, the absence of universal standards for the resource description framework (RDF) and property graph model hinders cross-platform integration.
  • Issues are compounded by the need for a sophisticated data virtualization layer and the high cost of talent, which can increase project budgets by an average of 20%. Managing digital twin modeling in a hybrid-cloud graph deployment with an in-memory graph database adds another layer of complexity.

Exclusive Technavio Analysis on Customer Landscape

The enterprise knowledge graph market forecasting report includes the adoption lifecycle of the market, covering from the innovator’s stage to the laggard’s stage. It focuses on adoption rates in different regions based on penetration. Furthermore, the enterprise knowledge graph market report also includes key purchase criteria and drivers of price sensitivity to help companies evaluate and develop their market growth analysis strategies.

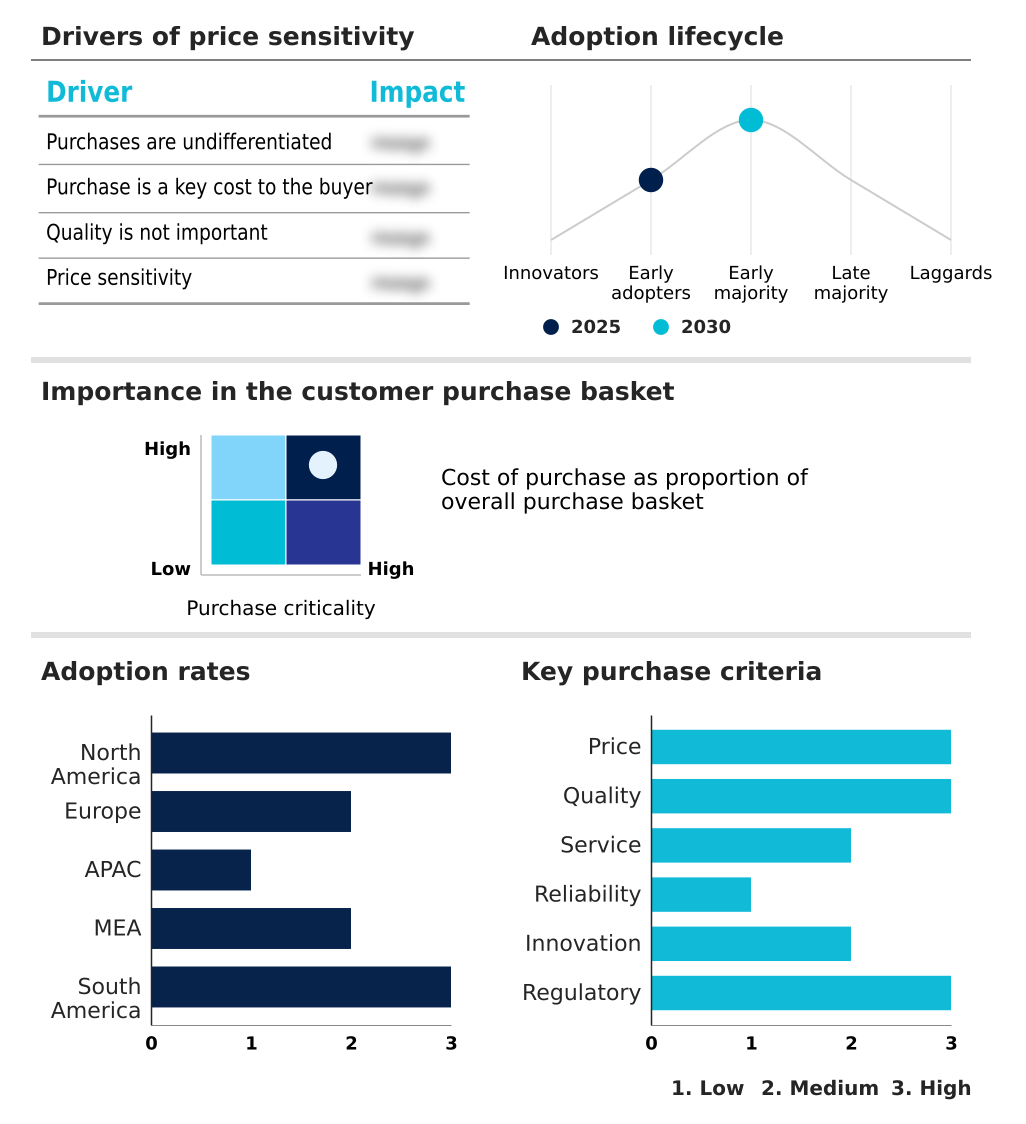
Customer Landscape of Enterprise Knowledge Graph Industry

Competitive Landscape

Companies are implementing various strategies, such as strategic alliances, enterprise knowledge graph market forecast, partnerships, mergers and acquisitions, geographical expansion, and product/service launches, to enhance their presence in the industry.

Altair Engineering Inc. - Vendors provide integrated graph platforms that create a semantic data layer, connect siloed information, and power advanced AI-driven analytics for modern enterprises.

The industry research and growth report includes detailed analyses of the competitive landscape of the market and information about key companies, including:

  • Altair Engineering Inc.
  • Amazon.com Inc.
  • ArangoDB Inc.
  • DATA.WORLD INC.
  • Franz Inc.
  • Google LLC
  • IBM Corp.
  • KATANA GRAPH INC.
  • MarkLogic Corp.
  • Memgraph Ltd.
  • Microsoft Corp.
  • Neo4j Inc.
  • Ontotext USA Inc.
  • Oracle Corp.
  • Palantir Technologies Inc.
  • ServiceNow Inc.
  • Stardog Union Inc.
  • TigerGraph
  • Tom Sawyer Software
  • TopQuadrant Inc.

Qualitative and quantitative analysis of companies has been conducted to help clients understand the wider business environment as well as the strengths and weaknesses of key industry players. Data is qualitatively analyzed to categorize companies as pure play, category-focused, industry-focused, and diversified; it is quantitatively analyzed to categorize companies as dominant, leading, strong, tentative, and weak.

Recent Development and News in Enterprise knowledge graph market

  • In October 2025, Neo4j announced a significant investment to advance its platform's role as a foundational knowledge layer for generative AI and agentic systems, funding new product innovations.
  • In October 2025, Mphasis launched its NeoIP AI platform, which integrates multiple proprietary innovations to enable enterprise transformation by leveraging organizational knowledge from legacy systems and data.
  • In December 2025, Nuix Ltd. revealed an agreement to acquire Linkurious SAS, a graph intelligence firm, aiming to bolster its data analytics and visualization offerings as part of its innovation strategy.
  • In January 2026, Squirro announced the general availability of its new Long-Term Support platform, featuring advanced capabilities designed to connect structured enterprise knowledge with ad-hoc user workflows.

Dive into Technavio’s robust research methodology, blending expert interviews, extensive data synthesis, and validated models for unparalleled Enterprise Knowledge Graph Market insights. See full methodology.

Market Scope
Page number 301
Base year 2025
Historic period 2020-2024
Forecast period 2026-2030
Growth momentum & CAGR Accelerate at a CAGR of 33.4%
Market growth 2026-2030 USD 3922.0 million
Market structure Fragmented
YoY growth 2025-2026(%) 30.4%
Key countries US, Canada, Mexico, Germany, UK, France, Italy, The Netherlands, Spain, China, Japan, India, South Korea, Australia, Indonesia, Saudi Arabia, UAE, South Africa, Israel, Turkey, Brazil, Argentina and Colombia
Competitive landscape Leading Companies, Market Positioning of Companies, Competitive Strategies, and Industry Risks

Request Free Sample

Research Analyst Overview

  • The enterprise knowledge graph market is evolving into the central nervous system for data-centric organizations. Its core value lies in creating a unified semantic data layer and employing a flexible graph-based data model, which are essential for modern data fabric architecture and data mesh principles.
  • Leading solutions leverage a sophisticated graph database management system with semantic metadata management for high-performance graph processing. Boardroom decisions on AI investment are now directly tied to the adoption of retrieval augmented generation, which relies on these graph structures to ensure factual accuracy. This technology enables a 30% reduction in data processing time for complex analytics.
  • The market's momentum is fueled by advancements in graph query languages, graph embeddings, and graph neural networks, which enhance semantic search capabilities. As organizations build out their data-centric architecture, the focus is on ontology-driven graph construction and automated entity resolution to create robust systems supporting everything from deep link analytics to neuro-symbolic AI.
  • The integration of multi-model NoSQL database concepts with native parallel graph database designs and data virtualization layer techniques is becoming standard for achieving scalable semantic interoperability and effective graph data modeling.

What are the Key Data Covered in this Enterprise Knowledge Graph Market Research and Growth Report?

  • What is the expected growth of the Enterprise Knowledge Graph Market between 2026 and 2030?

    • USD 3.92 billion, at a CAGR of 33.4%

  • What segmentation does the market report cover?

    • The report is segmented by Component (Solutions, and Services), Application (Supply chain and inventory management, Recommendation and personalization, Knowledge management and collaboration, Fraud detection and compliance, and Others), End-user (Large enterprises, and Small and medium enterprises) and Geography (North America, Europe, APAC, Middle East and Africa, South America)

  • Which regions are analyzed in the report?

    • North America, Europe, APAC, Middle East and Africa and South America

  • What are the key growth drivers and market challenges?

    • Proliferation of unstructured data and requirement for semantic connectivity, Significant technical complexity and burden of legacy infrastructure integration

  • Who are the major players in the Enterprise Knowledge Graph Market?

    • Altair Engineering Inc., Amazon.com Inc., ArangoDB Inc., DATA.WORLD INC., Franz Inc., Google LLC, IBM Corp., KATANA GRAPH INC., MarkLogic Corp., Memgraph Ltd., Microsoft Corp., Neo4j Inc., Ontotext USA Inc., Oracle Corp., Palantir Technologies Inc., ServiceNow Inc., Stardog Union Inc., TigerGraph, Tom Sawyer Software and TopQuadrant Inc.

Market Research Insights

  • The market is shaped by a strategic push toward cohesive enterprise data ecosystems, where data governance frameworks are paramount. Organizations are achieving a more contextual data understanding by integrating semantic web technologies, which facilitate complex data silos integration and enhance cross-platform integration capabilities.
  • This shift supports advanced applications such as real-time fraud detection and anti-money laundering compliance, where firms report a 15% greater accuracy. Furthermore, by adopting collaborative graph editing and automated policy enforcement, businesses are strengthening their digital twin modeling and unstructured data processing, leading to a 25% reduction in compliance reporting costs.
  • The use of hybrid-cloud graph deployment and in-memory graph database technologies enables superior supply chain visibility and customer journey mapping, providing a measurable competitive advantage in a dynamic global landscape.

We can help! Our analysts can customize this enterprise knowledge graph market research report to meet your requirements.

Get in touch

1. Executive Summary

1.1 Market overview

Executive Summary - Chart on Market Overview
Executive Summary - Data Table on Market Overview
Executive Summary - Chart on Global Market Characteristics
Executive Summary - Chart on Market by Geography
Executive Summary - Chart on Market Segmentation by Component
Executive Summary - Chart on Market Segmentation by Application
Executive Summary - Chart on Market Segmentation by End-user
Executive Summary - Chart on Incremental Growth
Executive Summary - Data Table on Incremental Growth
Executive Summary - Chart on Company Market Positioning

2. Technavio Analysis

2.1 Analysis of price sensitivity, lifecycle, customer purchase basket, adoption rates, and purchase criteria

2.2 Criticality of inputs and Factors of differentiation

Chart on Overview on criticality of inputs and factors of differentiation

2.3 Factors of disruption

Chart on Overview on factors of disruption

2.4 Impact of drivers and challenges

Chart on Impact of drivers and challenges in 2025 and 2030

3. Market Landscape

3.1 Market ecosystem

Chart on Parent Market
Data Table on - Parent Market

3.2 Market characteristics

Chart on Market characteristics analysis

3.3 Value chain analysis

Chart on Value chain analysis

4. Market Sizing

4.1 Market definition

Data Table on Offerings of companies included in the market definition

4.2 Market segment analysis

Market segments

4.3 Market size 2025

4.4 Market outlook: Forecast for 2025-2030

Chart on Global - Market size and forecast 2025-2030 ($ million)
Data Table on Global - Market size and forecast 2025-2030 ($ million)
Chart on Global Market: Year-over-year growth 2025-2030 (%)
Data Table on Global Market: Year-over-year growth 2025-2030 (%)

5. Historic Market Size

5.1 Global Enterprise Knowledge Graph Market 2020 - 2024

Historic Market Size - Data Table on Global Enterprise Knowledge Graph Market 2020 - 2024 ($ million)

5.2 Component segment analysis 2020 - 2024

Historic Market Size - Component Segment 2020 - 2024 ($ million)

5.3 Application segment analysis 2020 - 2024

Historic Market Size - Application Segment 2020 - 2024 ($ million)

5.4 End-user segment analysis 2020 - 2024

Historic Market Size - End-user Segment 2020 - 2024 ($ million)

5.5 Geography segment analysis 2020 - 2024

Historic Market Size - Geography Segment 2020 - 2024 ($ million)

5.6 Country segment analysis 2020 - 2024

Historic Market Size - Country Segment 2020 - 2024 ($ million)

6. Qualitative Analysis

6.1 Impact of AI on Global Enterprise Knowledge Graph Market

7. Five Forces Analysis

7.1 Five forces summary

Five forces analysis - Comparison between 2025 and 2030

7.2 Bargaining power of buyers

Bargaining power of buyers - Impact of key factors 2025 and 2030

7.3 Bargaining power of suppliers

Bargaining power of suppliers - Impact of key factors in 2025 and 2030

7.4 Threat of new entrants

Threat of new entrants - Impact of key factors in 2025 and 2030

7.5 Threat of substitutes

Threat of substitutes - Impact of key factors in 2025 and 2030

7.6 Threat of rivalry

Threat of rivalry - Impact of key factors in 2025 and 2030

7.7 Market condition

Chart on Market condition - Five forces 2025 and 2030

8. Market Segmentation by Component

8.1 Market segments

Chart on Component - Market share 2025-2030 (%)
Data Table on Component - Market share 2025-2030 (%)

8.2 Comparison by Component

Chart on Comparison by Component
Data Table on Comparison by Component

8.3 Solutions - Market size and forecast 2025-2030

Chart on Solutions - Market size and forecast 2025-2030 ($ million)
Data Table on Solutions - Market size and forecast 2025-2030 ($ million)
Chart on Solutions - Year-over-year growth 2025-2030 (%)
Data Table on Solutions - Year-over-year growth 2025-2030 (%)

8.4 Services - Market size and forecast 2025-2030

Chart on Services - Market size and forecast 2025-2030 ($ million)
Data Table on Services - Market size and forecast 2025-2030 ($ million)
Chart on Services - Year-over-year growth 2025-2030 (%)
Data Table on Services - Year-over-year growth 2025-2030 (%)

8.5 Market opportunity by Component

Market opportunity by Component ($ million)
Data Table on Market opportunity by Component ($ million)

9. Market Segmentation by Application

9.1 Market segments

Chart on Application - Market share 2025-2030 (%)
Data Table on Application - Market share 2025-2030 (%)

9.2 Comparison by Application

Chart on Comparison by Application
Data Table on Comparison by Application

9.3 Supply chain and inventory management - Market size and forecast 2025-2030

Chart on Supply chain and inventory management - Market size and forecast 2025-2030 ($ million)
Data Table on Supply chain and inventory management - Market size and forecast 2025-2030 ($ million)
Chart on Supply chain and inventory management - Year-over-year growth 2025-2030 (%)
Data Table on Supply chain and inventory management - Year-over-year growth 2025-2030 (%)

9.4 Recommendation and personalization - Market size and forecast 2025-2030

Chart on Recommendation and personalization - Market size and forecast 2025-2030 ($ million)
Data Table on Recommendation and personalization - Market size and forecast 2025-2030 ($ million)
Chart on Recommendation and personalization - Year-over-year growth 2025-2030 (%)
Data Table on Recommendation and personalization - Year-over-year growth 2025-2030 (%)

9.5 Knowledge management and collaboration - Market size and forecast 2025-2030

Chart on Knowledge management and collaboration - Market size and forecast 2025-2030 ($ million)
Data Table on Knowledge management and collaboration - Market size and forecast 2025-2030 ($ million)
Chart on Knowledge management and collaboration - Year-over-year growth 2025-2030 (%)
Data Table on Knowledge management and collaboration - Year-over-year growth 2025-2030 (%)

9.6 Fraud detection and compliance - Market size and forecast 2025-2030

Chart on Fraud detection and compliance - Market size and forecast 2025-2030 ($ million)
Data Table on Fraud detection and compliance - Market size and forecast 2025-2030 ($ million)
Chart on Fraud detection and compliance - Year-over-year growth 2025-2030 (%)
Data Table on Fraud detection and compliance - Year-over-year growth 2025-2030 (%)

9.7 Others - Market size and forecast 2025-2030

Chart on Others - Market size and forecast 2025-2030 ($ million)
Data Table on Others - Market size and forecast 2025-2030 ($ million)
Chart on Others - Year-over-year growth 2025-2030 (%)
Data Table on Others - Year-over-year growth 2025-2030 (%)

9.8 Market opportunity by Application

Market opportunity by Application ($ million)
Data Table on Market opportunity by Application ($ million)

10. Market Segmentation by End-user

10.1 Market segments

Chart on End-user - Market share 2025-2030 (%)
Data Table on End-user - Market share 2025-2030 (%)

10.2 Comparison by End-user

Chart on Comparison by End-user
Data Table on Comparison by End-user

10.3 Large enterprises - Market size and forecast 2025-2030

Chart on Large enterprises - Market size and forecast 2025-2030 ($ million)
Data Table on Large enterprises - Market size and forecast 2025-2030 ($ million)
Chart on Large enterprises - Year-over-year growth 2025-2030 (%)
Data Table on Large enterprises - Year-over-year growth 2025-2030 (%)

10.4 Small and medium enterprises - Market size and forecast 2025-2030

Chart on Small and medium enterprises - Market size and forecast 2025-2030 ($ million)
Data Table on Small and medium enterprises - Market size and forecast 2025-2030 ($ million)
Chart on Small and medium enterprises - Year-over-year growth 2025-2030 (%)
Data Table on Small and medium enterprises - Year-over-year growth 2025-2030 (%)

10.5 Market opportunity by End-user

Market opportunity by End-user ($ million)
Data Table on Market opportunity by End-user ($ million)

11. Customer Landscape

11.1 Customer landscape overview

Analysis of price sensitivity, lifecycle, customer purchase basket, adoption rates, and purchase criteria

12. Geographic Landscape

12.1 Geographic segmentation

Chart on Market share by geography 2025-2030 (%)
Data Table on Market share by geography 2025-2030 (%)

12.2 Geographic comparison

Chart on Geographic comparison
Data Table on Geographic comparison

12.3 North America - Market size and forecast 2025-2030

Chart on North America - Market size and forecast 2025-2030 ($ million)
Data Table on North America - Market size and forecast 2025-2030 ($ million)
Chart on North America - Year-over-year growth 2025-2030 (%)
Data Table on North America - Year-over-year growth 2025-2030 (%)
Chart on Regional Comparison - North America
Data Table on Regional Comparison - North America

12.3.1 US - Market size and forecast 2025-2030

Chart on US - Market size and forecast 2025-2030 ($ million)
Data Table on US - Market size and forecast 2025-2030 ($ million)
Chart on US - Year-over-year growth 2025-2030 (%)
Data Table on US - Year-over-year growth 2025-2030 (%)

12.3.2 Canada - Market size and forecast 2025-2030

Chart on Canada - Market size and forecast 2025-2030 ($ million)
Data Table on Canada - Market size and forecast 2025-2030 ($ million)
Chart on Canada - Year-over-year growth 2025-2030 (%)
Data Table on Canada - Year-over-year growth 2025-2030 (%)

12.3.3 Mexico - Market size and forecast 2025-2030

Chart on Mexico - Market size and forecast 2025-2030 ($ million)
Data Table on Mexico - Market size and forecast 2025-2030 ($ million)
Chart on Mexico - Year-over-year growth 2025-2030 (%)
Data Table on Mexico - Year-over-year growth 2025-2030 (%)

12.4 Europe - Market size and forecast 2025-2030

Chart on Europe - Market size and forecast 2025-2030 ($ million)
Data Table on Europe - Market size and forecast 2025-2030 ($ million)
Chart on Europe - Year-over-year growth 2025-2030 (%)
Data Table on Europe - Year-over-year growth 2025-2030 (%)
Chart on Regional Comparison - Europe
Data Table on Regional Comparison - Europe

12.4.1 Germany - Market size and forecast 2025-2030

Chart on Germany - Market size and forecast 2025-2030 ($ million)
Data Table on Germany - Market size and forecast 2025-2030 ($ million)
Chart on Germany - Year-over-year growth 2025-2030 (%)
Data Table on Germany - Year-over-year growth 2025-2030 (%)

12.4.2 UK - Market size and forecast 2025-2030

Chart on UK - Market size and forecast 2025-2030 ($ million)
Data Table on UK - Market size and forecast 2025-2030 ($ million)
Chart on UK - Year-over-year growth 2025-2030 (%)
Data Table on UK - Year-over-year growth 2025-2030 (%)

12.4.3 France - Market size and forecast 2025-2030

Chart on France - Market size and forecast 2025-2030 ($ million)
Data Table on France - Market size and forecast 2025-2030 ($ million)
Chart on France - Year-over-year growth 2025-2030 (%)
Data Table on France - Year-over-year growth 2025-2030 (%)

12.4.4 Italy - Market size and forecast 2025-2030

Chart on Italy - Market size and forecast 2025-2030 ($ million)
Data Table on Italy - Market size and forecast 2025-2030 ($ million)
Chart on Italy - Year-over-year growth 2025-2030 (%)
Data Table on Italy - Year-over-year growth 2025-2030 (%)

12.4.5 The Netherlands - Market size and forecast 2025-2030

Chart on The Netherlands - Market size and forecast 2025-2030 ($ million)
Data Table on The Netherlands - Market size and forecast 2025-2030 ($ million)
Chart on The Netherlands - Year-over-year growth 2025-2030 (%)
Data Table on The Netherlands - Year-over-year growth 2025-2030 (%)

12.4.6 Spain - Market size and forecast 2025-2030

Chart on Spain - Market size and forecast 2025-2030 ($ million)
Data Table on Spain - Market size and forecast 2025-2030 ($ million)
Chart on Spain - Year-over-year growth 2025-2030 (%)
Data Table on Spain - Year-over-year growth 2025-2030 (%)

12.5 APAC - Market size and forecast 2025-2030

Chart on APAC - Market size and forecast 2025-2030 ($ million)
Data Table on APAC - Market size and forecast 2025-2030 ($ million)
Chart on APAC - Year-over-year growth 2025-2030 (%)
Data Table on APAC - Year-over-year growth 2025-2030 (%)
Chart on Regional Comparison - APAC
Data Table on Regional Comparison - APAC

12.5.1 China - Market size and forecast 2025-2030

Chart on China - Market size and forecast 2025-2030 ($ million)
Data Table on China - Market size and forecast 2025-2030 ($ million)
Chart on China - Year-over-year growth 2025-2030 (%)
Data Table on China - Year-over-year growth 2025-2030 (%)

12.5.2 Japan - Market size and forecast 2025-2030

Chart on Japan - Market size and forecast 2025-2030 ($ million)
Data Table on Japan - Market size and forecast 2025-2030 ($ million)
Chart on Japan - Year-over-year growth 2025-2030 (%)
Data Table on Japan - Year-over-year growth 2025-2030 (%)

12.5.3 India - Market size and forecast 2025-2030

Chart on India - Market size and forecast 2025-2030 ($ million)
Data Table on India - Market size and forecast 2025-2030 ($ million)
Chart on India - Year-over-year growth 2025-2030 (%)
Data Table on India - Year-over-year growth 2025-2030 (%)

12.5.4 South Korea - Market size and forecast 2025-2030

Chart on South Korea - Market size and forecast 2025-2030 ($ million)
Data Table on South Korea - Market size and forecast 2025-2030 ($ million)
Chart on South Korea - Year-over-year growth 2025-2030 (%)
Data Table on South Korea - Year-over-year growth 2025-2030 (%)

12.5.5 Australia - Market size and forecast 2025-2030

Chart on Australia - Market size and forecast 2025-2030 ($ million)
Data Table on Australia - Market size and forecast 2025-2030 ($ million)
Chart on Australia - Year-over-year growth 2025-2030 (%)
Data Table on Australia - Year-over-year growth 2025-2030 (%)

12.5.6 Indonesia - Market size and forecast 2025-2030

Chart on Indonesia - Market size and forecast 2025-2030 ($ million)
Data Table on Indonesia - Market size and forecast 2025-2030 ($ million)
Chart on Indonesia - Year-over-year growth 2025-2030 (%)
Data Table on Indonesia - Year-over-year growth 2025-2030 (%)

12.6 Middle East and Africa - Market size and forecast 2025-2030

Chart on Middle East and Africa - Market size and forecast 2025-2030 ($ million)
Data Table on Middle East and Africa - Market size and forecast 2025-2030 ($ million)
Chart on Middle East and Africa - Year-over-year growth 2025-2030 (%)
Data Table on Middle East and Africa - Year-over-year growth 2025-2030 (%)
Chart on Regional Comparison - Middle East and Africa
Data Table on Regional Comparison - Middle East and Africa

12.6.1 Saudi Arabia - Market size and forecast 2025-2030

Chart on Saudi Arabia - Market size and forecast 2025-2030 ($ million)
Data Table on Saudi Arabia - Market size and forecast 2025-2030 ($ million)
Chart on Saudi Arabia - Year-over-year growth 2025-2030 (%)
Data Table on Saudi Arabia - Year-over-year growth 2025-2030 (%)

12.6.2 UAE - Market size and forecast 2025-2030

Chart on UAE - Market size and forecast 2025-2030 ($ million)
Data Table on UAE - Market size and forecast 2025-2030 ($ million)
Chart on UAE - Year-over-year growth 2025-2030 (%)
Data Table on UAE - Year-over-year growth 2025-2030 (%)

12.6.3 South Africa - Market size and forecast 2025-2030

Chart on South Africa - Market size and forecast 2025-2030 ($ million)
Data Table on South Africa - Market size and forecast 2025-2030 ($ million)
Chart on South Africa - Year-over-year growth 2025-2030 (%)
Data Table on South Africa - Year-over-year growth 2025-2030 (%)

12.6.4 Israel - Market size and forecast 2025-2030

Chart on Israel - Market size and forecast 2025-2030 ($ million)
Data Table on Israel - Market size and forecast 2025-2030 ($ million)
Chart on Israel - Year-over-year growth 2025-2030 (%)
Data Table on Israel - Year-over-year growth 2025-2030 (%)

12.6.5 Turkey - Market size and forecast 2025-2030

Chart on Turkey - Market size and forecast 2025-2030 ($ million)
Data Table on Turkey - Market size and forecast 2025-2030 ($ million)
Chart on Turkey - Year-over-year growth 2025-2030 (%)
Data Table on Turkey - Year-over-year growth 2025-2030 (%)

12.7 South America - Market size and forecast 2025-2030

Chart on South America - Market size and forecast 2025-2030 ($ million)
Data Table on South America - Market size and forecast 2025-2030 ($ million)
Chart on South America - Year-over-year growth 2025-2030 (%)
Data Table on South America - Year-over-year growth 2025-2030 (%)
Chart on Regional Comparison - South America
Data Table on Regional Comparison - South America

12.7.1 Brazil - Market size and forecast 2025-2030

Chart on Brazil - Market size and forecast 2025-2030 ($ million)
Data Table on Brazil - Market size and forecast 2025-2030 ($ million)
Chart on Brazil - Year-over-year growth 2025-2030 (%)
Data Table on Brazil - Year-over-year growth 2025-2030 (%)

12.7.2 Argentina - Market size and forecast 2025-2030

Chart on Argentina - Market size and forecast 2025-2030 ($ million)
Data Table on Argentina - Market size and forecast 2025-2030 ($ million)
Chart on Argentina - Year-over-year growth 2025-2030 (%)
Data Table on Argentina - Year-over-year growth 2025-2030 (%)

12.7.3 Colombia - Market size and forecast 2025-2030

Chart on Colombia - Market size and forecast 2025-2030 ($ million)
Data Table on Colombia - Market size and forecast 2025-2030 ($ million)
Chart on Colombia - Year-over-year growth 2025-2030 (%)
Data Table on Colombia - Year-over-year growth 2025-2030 (%)

12.8 Market opportunity by geography

Market opportunity by geography ($ million)
Data Tables on Market opportunity by geography ($ million)

13. Drivers, Challenges, and Opportunity

13.1 Market drivers

Proliferation of unstructured data and requirement for semantic connectivity
Strategic integration of generative AI and retrieval augmented generation
Advancements in regulatory compliance and data governance frameworks

13.2 Market challenges

Significant technical complexity and burden of legacy infrastructure integration
Scarcity of specialized talent and domain expertise
Data quality issues and absence of global interoperability standards

13.3 Impact of drivers and challenges

Impact of drivers and challenges in 2025 and 2030

13.4 Market opportunities

Integration of large language models with structured knowledge bases
Proliferation of data fabric and mesh architectures
Enhanced governance and explainable AI

14. Competitive Landscape

14.1 Overview

14.2

Overview on criticality of inputs and factors of differentiation

14.3 Landscape disruption

Overview on factors of disruption

14.4 Industry risks

Impact of key risks on business

15. Competitive Analysis

15.1 Companies profiled

Companies covered

15.2 Company ranking index

15.3 Market positioning of companies

Matrix on companies position and classification

15.4 Altair Engineering Inc.

Altair Engineering Inc. - Overview
Altair Engineering Inc. - Business segments
Altair Engineering Inc. - Key news
Altair Engineering Inc. - Key offerings
Altair Engineering Inc. - Segment focus
SWOT

15.5 Amazon.com Inc.

Amazon.com Inc. - Overview
Amazon.com Inc. - Business segments
Amazon.com Inc. - Key news
Amazon.com Inc. - Key offerings
Amazon.com Inc. - Segment focus
SWOT

15.6 ArangoDB Inc.

ArangoDB Inc. - Overview
ArangoDB Inc. - Product / Service
ArangoDB Inc. - Key offerings
SWOT

15.7 DATA.WORLD INC.

DATA.WORLD INC. - Overview
DATA.WORLD INC. - Product / Service
DATA.WORLD INC. - Key offerings
SWOT

15.8 Franz Inc.

Franz Inc. - Overview
Franz Inc. - Product / Service
Franz Inc. - Key offerings
SWOT

15.9 IBM Corp.

IBM Corp. - Overview
IBM Corp. - Business segments
IBM Corp. - Key news
IBM Corp. - Key offerings
IBM Corp. - Segment focus
SWOT

15.10 Microsoft Corp.

Microsoft Corp. - Overview
Microsoft Corp. - Business segments
Microsoft Corp. - Key news
Microsoft Corp. - Key offerings
Microsoft Corp. - Segment focus
SWOT

15.11 Neo4j Inc.

Neo4j Inc. - Overview
Neo4j Inc. - Product / Service
Neo4j Inc. - Key offerings
SWOT

15.12 Ontotext USA Inc.

Ontotext USA Inc. - Overview
Ontotext USA Inc. - Product / Service
Ontotext USA Inc. - Key offerings
SWOT

15.13 Oracle Corp.

Oracle Corp. - Overview
Oracle Corp. - Business segments
Oracle Corp. - Key news
Oracle Corp. - Key offerings
Oracle Corp. - Segment focus
SWOT

15.14 Palantir Technologies Inc.

Palantir Technologies Inc. - Overview
Palantir Technologies Inc. - Product / Service
Palantir Technologies Inc. - Key offerings
SWOT

15.15 ServiceNow Inc.

ServiceNow Inc. - Overview
ServiceNow Inc. - Product / Service
ServiceNow Inc. - Key news
ServiceNow Inc. - Key offerings
SWOT

15.16 Stardog Union Inc.

Stardog Union Inc. - Overview
Stardog Union Inc. - Product / Service
Stardog Union Inc. - Key offerings
SWOT

15.17 TigerGraph

TigerGraph - Overview
TigerGraph - Product / Service
TigerGraph - Key offerings
SWOT

15.18 TopQuadrant Inc.

TopQuadrant Inc. - Overview
TopQuadrant Inc. - Product / Service
TopQuadrant Inc. - Key offerings
SWOT

16. Appendix

16.1 Scope of the report

Market definition
Objectives
Notes and caveats

16.2 Inclusions and exclusions checklist

Inclusions checklist
Exclusions checklist

16.3 Currency conversion rates for US$

16.4 Research methodology

16.5 Data procurement

Information sources

16.6 Data validation

16.7 Validation techniques employed for market sizing

16.8 Data synthesis

16.9 360 degree market analysis

16.10 List of abbreviations

Research Methodology

Technavio presents a detailed picture of the market by way of study, synthesis, and summation of data from multiple sources. The analysts have presented the various facets of the market with a particular focus on identifying the key industry influencers. The data thus presented is comprehensive, reliable, and the result of extensive research, both primary and secondary.

INFORMATION SOURCES

Primary sources

  • Manufacturers and suppliers
  • Channel partners
  • Industry experts
  • Strategic decision makers

Secondary sources

  • Industry journals and periodicals
  • Government data
  • Financial reports of key industry players
  • Historical data
  • Press releases

DATA ANALYSIS

Data Synthesis

  • Collation of data
  • Estimation of key figures
  • Analysis of derived insights

Data Validation

  • Triangulation with data models
  • Reference against proprietary databases
  • Corroboration with industry experts

REPORT WRITING

Qualitative

  • Market drivers
  • Market challenges
  • Market trends
  • Five forces analysis

Quantitative

  • Market size and forecast
  • Market segmentation
  • Geographical insights
  • Competitive landscape

Interested in this report?

Get your sample now to see our research methodology and insights!

Download Now

Frequently Asked Questions

Enterprise Knowledge Graph market growth will increase by USD 3922.0 million during 2026-2030.

The Enterprise Knowledge Graph market is expected to grow at a CAGR of 33.4% during 2026-2030.

Enterprise Knowledge Graph market is segmented by Component (Solutions, Services) Application (Supply chain and inventory management, Recommendation and personalization, Knowledge management and collaboration, Fraud detection and compliance, Others) End-user (Large enterprises, Small and medium enterprises)

Altair Engineering Inc., Amazon.com Inc., ArangoDB Inc., DATA.WORLD INC., Franz Inc., Google LLC, IBM Corp., KATANA GRAPH INC., MarkLogic Corp., Memgraph Ltd., Microsoft Corp., Neo4j Inc., Ontotext USA Inc., Oracle Corp., Palantir Technologies Inc., ServiceNow Inc., Stardog Union Inc., TigerGraph, Tom Sawyer Software, TopQuadrant Inc. are a few of the key vendors in the Enterprise Knowledge Graph market.

North America will register the highest growth rate of 33% among the other regions. Therefore, the Enterprise Knowledge Graph market in North America is expected to garner significant business opportunities for the vendors during the forecast period.

US, Canada, Mexico, Germany, UK, France, Italy, The Netherlands, Spain, China, Japan, India, South Korea, Australia, Indonesia, Saudi Arabia, UAE, South Africa, Israel, Turkey, Brazil, Argentina, Colombia

  • Proliferation of unstructured data and requirement for semantic connectivity is the driving factor this market.

The Enterprise Knowledge Graph market vendors should focus on grabbing business opportunities from the Component segment as it accounted for the largest market share in the base year.
RIA - Research AI Assistant
Ask RIA