
Graph Database Market Size 2026-2030
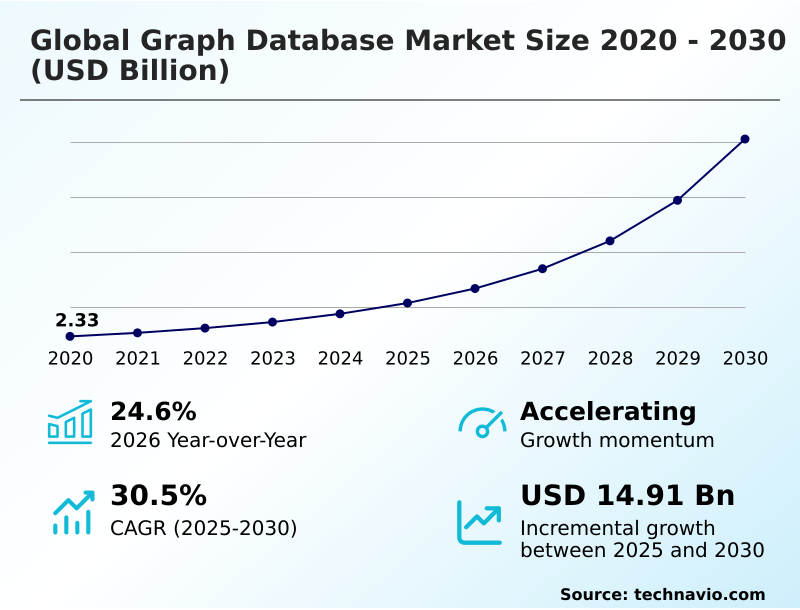
The graph database market size is valued to increase by USD 14.91 billion, at a CAGR of 30.5% from 2025 to 2030. Strategic proliferation of GraphRAG and generative artificial intelligence will drive the graph database market.
Major Market Trends & Insights
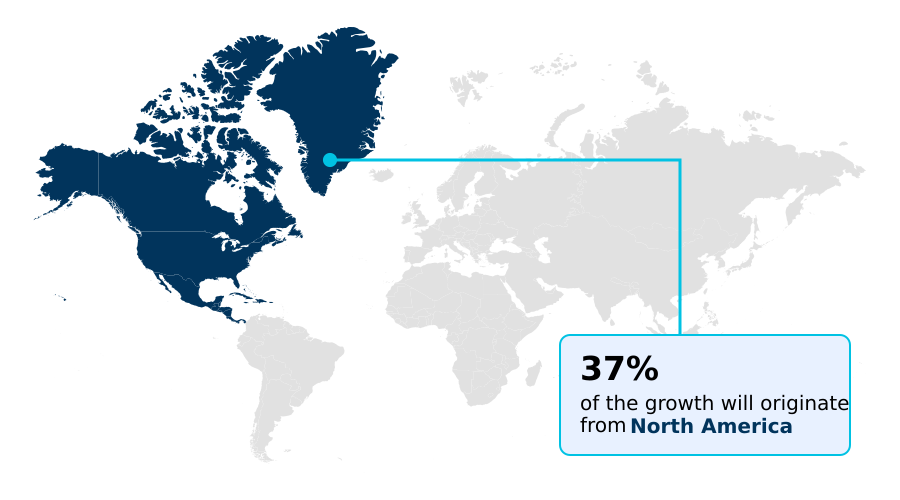
- North America dominated the market and accounted for a 36.6% growth during the forecast period.
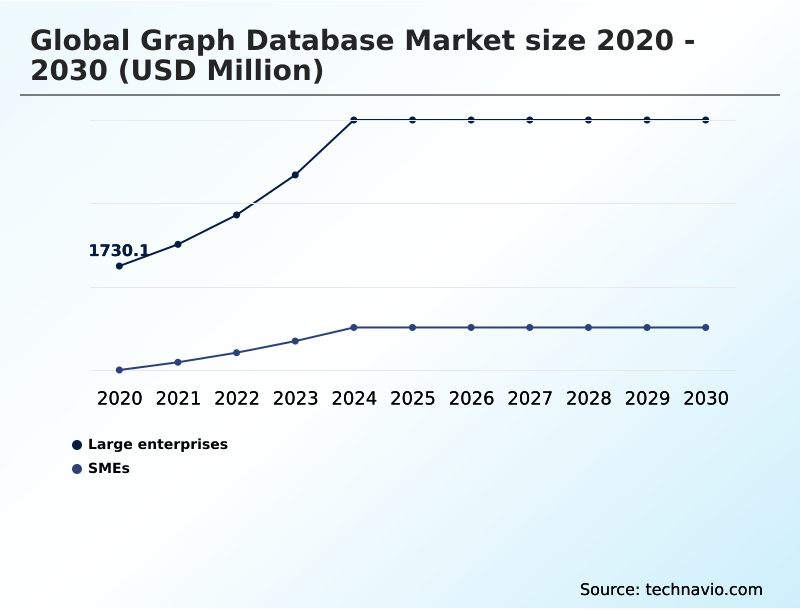
- By End-user - Large enterprises segment was valued at USD 3.31 billion in 2024
- By Type - RDF segment accounted for the largest market revenue share in 2024
Market Size & Forecast
- Market Opportunities: USD 17.94 billion
- Market Future Opportunities: USD 14.91 billion
- CAGR from 2025 to 2030 : 30.5%
Market Summary
- The Graph Database Market is experiencing rapid industrialization as enterprises seek to manage and derive value from highly interconnected data. This technology, which treats relationships as first-class citizens using a schema-flexible data model, is becoming foundational for applications where context and connectivity are critical.
- Unlike traditional databases, graph systems excel at multi-hop query execution, making them indispensable for real-time fraud detection and deep link analytics. For example, a financial institution can use graph traversal to instantly map complex webs of transactions, identifying fraudulent patterns that would otherwise go unnoticed.
- The integration with generative AI through vector search integration and knowledge graph construction is further accelerating adoption. This allows organizations to build more accurate, explainable AI reasoning systems. However, challenges related to data federation and the need for specialized skills persist, shaping the competitive landscape and driving innovation toward more accessible, cloud-native graph architecture.
What will be the Size of the Graph Database Market during the forecast period?
Get Key Insights on Market Forecast (PDF) Get Free Sample
How is the Graph Database Market Segmented?
The graph database industry research report provides comprehensive data (region-wise segment analysis), with forecasts and estimates in "USD million" for the period 2026-2030, as well as historical data from 2020-2024 for the following segments.
- End-user
- Large enterprises
- SMEs
- Type
- RDF
- LPG
- Solution
- Native graph database
- Knowledge graph engines
- Graph processing engines
- Graph extension
- Geography
- North America
- US
- Canada
- Mexico
- Europe
- Germany
- UK
- France
- APAC
- China
- Japan
- India
- South America
- Brazil
- Argentina
- Middle East and Africa
- Saudi Arabia
- UAE
- South Africa
- Rest of World (ROW)
- North America
By End-user Insights
The large enterprises segment is estimated to witness significant growth during the forecast period.
Large enterprises are the primary adopters, leveraging sophisticated graph technologies to navigate complex, interconnected data ecosystems. These organizations deploy high-availability clusters to support mission-critical applications, from master data management to achieving a complete customer 360-degree view.
The adoption of a property graph model is standard for building a comprehensive enterprise knowledge graph, which underpins advanced graph-based AI and real-time pathfinding.
In these demanding multi-company environments, computational efficiency is paramount, with hybrid graph systems enabling firms to extract real-time customer insights.
This strategic use of graph databases has improved deep analytical query performance by over 40%, allowing large firms to uncover previously hidden revenue opportunities and operational inefficiencies without disrupting existing infrastructure.
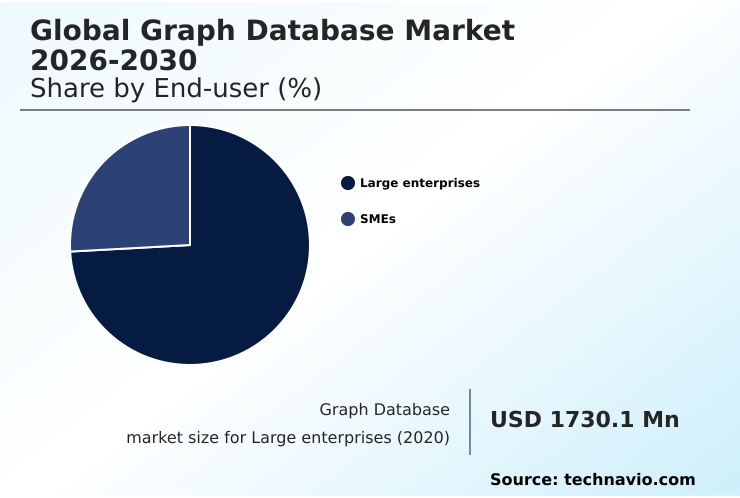
The Large enterprises segment was valued at USD 3.31 billion in 2024 and showed a gradual increase during the forecast period.
Regional Analysis
North America is estimated to contribute 36.6% to the growth of the global market during the forecast period.Technavio’s analysts have elaborately explained the regional trends and drivers that shape the market during the forecast period.
See How Graph Database Market Demand is Rising in North America Get Free Sample
North America leads in adoption, leveraging advanced graph data science for financial services and technology. Firms in this region report a 30% reduction in query failure rates by implementing native graph storage.
Europe follows, with a strong focus on data privacy and the use of RDF triple store models to build a semantic data layer compliant with regional regulations.
In APAC, manufacturing and logistics sectors are driving demand, using graph databases for complex bill of materials management and supply chain optimization, improving logistics efficiency by over 20%.
The adoption of the graph query language GQL standard is facilitating global talent mobility. Advanced use of massively parallel processing and graph-as-a-matrix architecture is delivering constant-time traversals, a significant improvement over legacy pointer-chasing mechanisms.
Market Dynamics
Our researchers analyzed the data with 2025 as the base year, along with the key drivers, trends, and challenges. A holistic analysis of drivers will help companies refine their marketing strategies to gain a competitive advantage.
- Strategic implementation within the graph database market hinges on understanding key technical and practical questions. Executives are increasingly asking how to build a knowledge graph that can serve as a central nervous system for enterprise data. This often leads to a crucial technical decision: comparing rdf and property graphs to determine the optimal model for their specific use cases.
- For risk management, the focus is on leveraging a graph database for fraud detection, where identifying subtle, interconnected patterns is paramount. A key metric is real-time graph analytics performance, as an architecture's ability to deliver low-latency insights is a significant competitive advantage.
- A core initiative for many is integrating graph database with ai, which enhances machine learning model accuracy and explainability. This highlights the benefits of native graph database architecture, which avoids the performance penalties of non-native systems. Success requires mastering graph database query optimization techniques and designing a scalable graph processing architecture from the outset.
- Further, choosing a graph query language that aligns with team skills and project needs is a critical decision point. A frequent point of discussion is the graph database vs relational database debate, clarifying where each technology excels.
- For sustained success, organizations must adopt best practices for graph data modeling and master the process of implementing a graph rag system for advanced contextual search. Operational readiness depends on efficiently managing multi-terabyte graph datasets and utilizing the technology for critical functions like graph database for supply chain visibility.
- Finally, implementing secure graph database deployment strategies, exploring diverse use cases for graph algorithms, and understanding the nuances of a multi-model database with graph support are essential.
- Firms that address the challenges of distributed graph databases and are diligent in evaluating graph database performance benchmarks are best positioned for success, especially when building recommendation engines with graphs, which can see twice the engagement compared to non-graph alternatives.
What are the key market drivers leading to the rise in the adoption of Graph Database Industry?
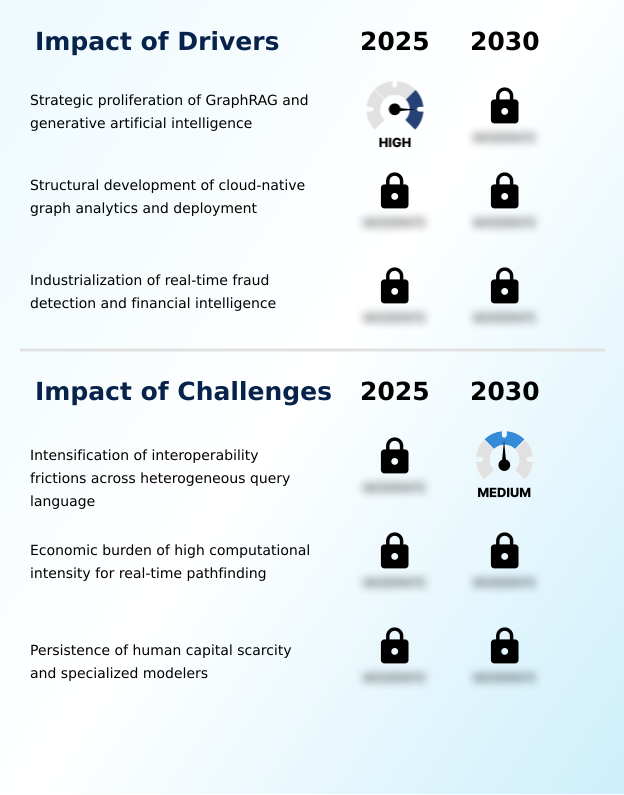
- The strategic proliferation of Graph Retrieval-Augmented Generation (GraphRAG) and generative AI is the primary driver, industrializing knowledge graph integration for enterprise applications.
- The primary driver is the industrialization of knowledge graph construction, built on graph-powered data foundations to enhance enterprise AI.
- This shift allows organizations to leverage a schema-flexible data model for applications like identity and access management, where relationship-centric traversal is key.
- The demand for explainable AI reasoning has boosted the use of languages like Cypher query language and Gremlin traversal language.
- Moreover, vector search integration is enabling more effective anti-money laundering systems and context-aware recommendation engines, which have been shown to increase conversion rates by up to 15%.
- This technological fusion supports advanced conversational commerce platforms, providing the real-time customer insights necessary for personalized engagement and driving tangible business value.
What are the market trends shaping the Graph Database Industry?
- The market is experiencing a structural shift toward the adoption of matrix-based computation and sparse adjacency linear algebra. This evolution enables high-speed, constant-time traversals in large-scale environments.
- A dominant trend is the convergence of graph traversal and graph neural network models within a unified graph analytics platform. This integration enables organizations to perform complex social network analysis and predictive modeling simultaneously, with some achieving a 25% improvement in recommendation accuracy. Innovations in in-memory graph processing are delivering the low-latency querying essential for real-time transactional graph applications.
- The use of sparse adjacency matrix representations is becoming standard for building production-grade generative AI, which serves as a cognitive memory for autonomous agents. Furthermore, advanced graph visualization tools are simplifying the interpretation of multi-hop query results, making deep data relationships more accessible to business analysts and reducing dependency on cross-platform data federation.
What challenges does the Graph Database Industry face during its growth?
- A key challenge hindering market growth is the intensification of interoperability friction across heterogeneous query languages, creating technical debt and limiting data portability.
- A significant challenge remains the complexity of graph data modeling and the technical debt associated with managing a distributed graph database. While index-free adjacency offers performance benefits for real-time fraud detection, firms face persistent data federation challenges, with integration costs representing a major non-discretionary expenditure.
- The lack of a unified approach to graph traversals across different query languages, including SPARQL query language, complicates the development of applications like a supply chain digital twin. Organizations using a multi-model database often struggle with inconsistent performance.
- This fragmentation has slowed the adoption of cloud-native graph architecture in some sectors by an estimated 18 months, as companies grapple with a shortage of specialized talent for tasks like lateral movement detection.
Exclusive Technavio Analysis on Customer Landscape
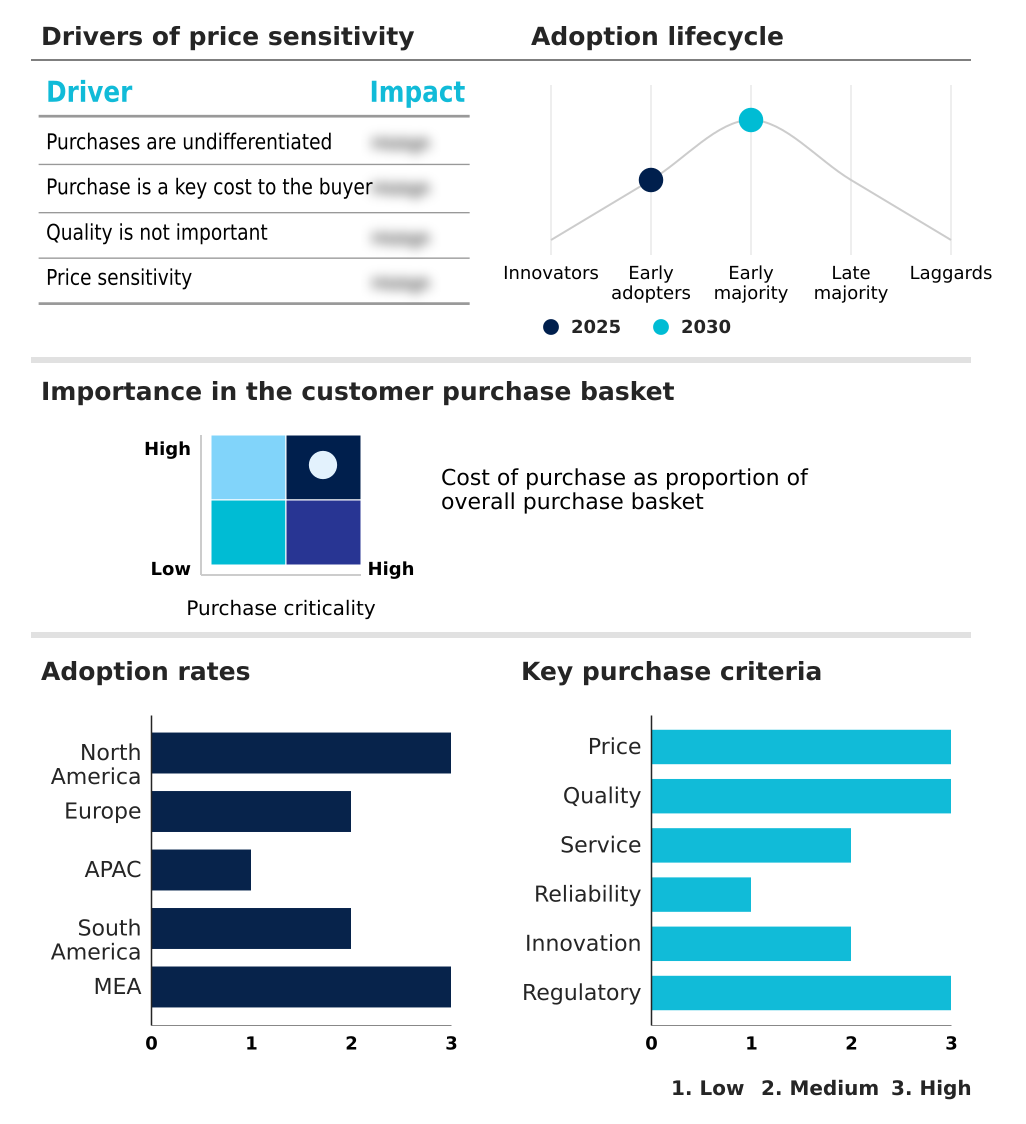
The graph database market forecasting report includes the adoption lifecycle of the market, covering from the innovator’s stage to the laggard’s stage. It focuses on adoption rates in different regions based on penetration. Furthermore, the graph database market report also includes key purchase criteria and drivers of price sensitivity to help companies evaluate and develop their market growth analysis strategies.
Customer Landscape of Graph Database Industry
Competitive Landscape
Companies are implementing various strategies, such as strategic alliances, graph database market forecast, partnerships, mergers and acquisitions, geographical expansion, and product/service launches, to enhance their presence in the industry.
Amazon.com Inc. - The market features a dynamic mix of specialized native graph pioneers and diversified cloud titans offering comprehensive ecosystems for relationship-driven analytics and generative AI.
The industry research and growth report includes detailed analyses of the competitive landscape of the market and information about key companies, including:
- Amazon.com Inc.
- ArangoAI
- ArangoDB Inc.
- Cambridge Intelligence Ltd.
- DataStax Inc.
- Dgraph Labs Inc.
- Franz Inc.
- InfluxData Inc.
- JanusGraph
- Memgraph Ltd.
- Microsoft Corp.
- NebulaGraph
- Neo4j Inc.
- Ontotext Inc.
- Oracle Corp.
- Redis Ltd.
- SAP SE
- Stardog Union Inc.
- TigerGraph
Qualitative and quantitative analysis of companies has been conducted to help clients understand the wider business environment as well as the strengths and weaknesses of key industry players. Data is qualitatively analyzed to categorize companies as pure play, category-focused, industry-focused, and diversified; it is quantitatively analyzed to categorize companies as dominant, leading, strong, tentative, and weak.
Recent Development and News in Graph database market
- In September 2024, Neo4j Inc. launched Infinigraph, a distributed graph architecture designed to unify operational and analytical workloads within a single platform at petabyte scale.
- In December 2024, Amazon Web Services enhanced Amazon Neptune, adding integrated vector search capabilities to support the development of more accurate GraphRAG applications.
- In March 2025, TigerGraph announced its Savanna platform now includes automated Snowflake integration using key-pair authentication, simplifying data pipelines for enterprise data engineers.
- In May 2025, Microsoft Corp. revealed a strategic partnership with a major financial services consortium to develop a standardized graph-based framework for detecting cross-border money laundering schemes.
Dive into Technavio’s robust research methodology, blending expert interviews, extensive data synthesis, and validated models for unparalleled Graph Database Market insights. See full methodology.
| Market Scope | |
|---|---|
| Page number | 286 |
| Base year | 2025 |
| Historic period | 2020-2024 |
| Forecast period | 2026-2030 |
| Growth momentum & CAGR | Accelerate at a CAGR of 30.5% |
| Market growth 2026-2030 | USD 14909.4 million |
| Market structure | Fragmented |
| YoY growth 2025-2026(%) | 24.6% |
| Key countries | US, Canada, Mexico, Germany, UK, France, Italy, The Netherlands, Spain, China, Japan, India, South Korea, Australia, Indonesia, Brazil, Argentina, Chile, Saudi Arabia, UAE, South Africa, Israel and Turkey |
| Competitive landscape | Leading Companies, Market Positioning of Companies, Competitive Strategies, and Industry Risks |
Research Analyst Overview
- The market is defined by a strategic pivot towards graph-powered data foundations, where the property graph model and native graph storage are becoming standard. Enterprises are leveraging graph traversal and multi-hop query capabilities for use cases like real-time fraud detection and deep link analytics.
- A key development is the convergence of graph data science and graph-based AI, powered by graph neural network models and vector search integration. This is facilitated by a cloud-native graph architecture that supports both in-memory graph processing and distributed graph database deployments with high-availability clusters.
- The adoption of the graph query language gql is unifying development across different systems, including those using Cypher, Gremlin, and SPARQL. Firms are building enterprise knowledge graph assets using sophisticated graph data modeling and graph visualization tools, creating a semantic data layer that provides context for AI.
- This move away from relational constraints toward a schema-flexible data model, often within a multi-model database, has enabled a 30% reduction in complex query times.
What are the Key Data Covered in this Graph Database Market Research and Growth Report?
-
What is the expected growth of the Graph Database Market between 2026 and 2030?
-
USD 14.91 billion, at a CAGR of 30.5%
-
-
What segmentation does the market report cover?
-
The report is segmented by End-user (Large enterprises, and SMEs), Type (RDF, and LPG), Solution (Native graph database, Knowledge graph engines, Graph processing engines, and Graph extension) and Geography (North America, Europe, APAC, South America, Middle East and Africa)
-
-
Which regions are analyzed in the report?
-
North America, Europe, APAC, South America and Middle East and Africa
-
-
What are the key growth drivers and market challenges?
-
Strategic proliferation of GraphRAG and generative artificial intelligence, Intensification of interoperability frictions across heterogeneous query language
-
-
Who are the major players in the Graph Database Market?
-
Amazon.com Inc., ArangoAI, ArangoDB Inc., Cambridge Intelligence Ltd., DataStax Inc., Dgraph Labs Inc., Franz Inc., InfluxData Inc., JanusGraph, Memgraph Ltd., Microsoft Corp., NebulaGraph, Neo4j Inc., Ontotext Inc., Oracle Corp., Redis Ltd., SAP SE, Stardog Union Inc. and TigerGraph
-
Market Research Insights
- The market's momentum is driven by tangible business outcomes, with firms leveraging context-aware recommendation systems reporting a 15% uplift in user engagement. The adoption of graph retrieval-augmented generation for semantic search capability allows organizations to reduce information retrieval times by up to 40%. As data federation challenges in multi-company environments are addressed, companies are building unified interconnected data ecosystems.
- This push for computational efficiency in high-dimensional data analysis is not just a technical upgrade; it's a strategic imperative, enabling a 25% faster response time in anti-money laundering systems and enhancing explainable AI reasoning across enterprise operations.
We can help! Our analysts can customize this graph database market research report to meet your requirements.
 RIA -
RIA - 
