
Enterprise Server Market Size 2024-2028
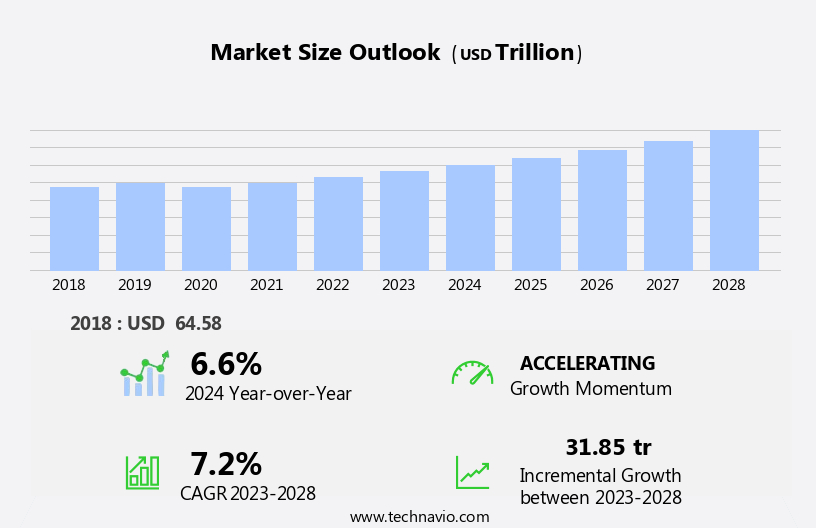
The enterprise server market size is forecast to increase by USD 31,852.7 billion at a CAGR of 7.2% between 2023 and 2028.
-
The market is experiencing significant growth due to the increasing demand for computing capacity and workload management in data center infrastructure. Rack optimized servers and rack servers are becoming increasingly popular as businesses seek to maximize space utilization in their data centers. The rise of cloud service providers and the adoption of cloud computing policies have led to an increased need for data centers storage and data center services. Moreover, the emergence of artificial intelligence (AI) and machine learning (ML) applications, as well as the deployment of 5G edge infrastructure, are driving the need for high-performance servers. Supermicro and other leading server manufacturers are responding to these trends by developing servers that offer superior processing power and energy efficiency. In addition, the growing popularity of flash-based storage devices and the increasing consolidation activity in the data center industry are also contributing to market growth. In summary, the market is experiencing strong growth due to the increasing demand for computing capacity, the emergence of new technologies like AI and ML, and the consolidation of data center infrastructure.
What will be the Size of the Market During the Forecast Period?
- The market is a significant segment of the computer hardware industry, focusing on providing high-performance computing solutions for businesses. These servers cater to the demands of big data, business intelligence applications, and high-performance computing needs. Enterprise servers play a crucial role in enhancing network performance and desktop performance for businesses. They offer substantial memory capacity, ensuring the swift processing of large data sets. In today's digital transformation era, these servers are indispensable for handling complex workloads and supporting advanced technologies like cloud computing, artificial intelligence (AI), and the Internet of Things (IoT). Network services, such as Transmission Control Protocol (TCP) and Internet Protocol (IP), are essential components of enterprise servers.
- Furthermore, network services, such as Transmission Control Protocol (TCP) and Internet Protocol (IP), are essential components of enterprise servers. They enable consolidated connections and multicast capabilities, ensuring seamless communication between various systems and applications. Hyperscale data centers are the backbone of modern IT infrastructure, and enterprise servers are a vital component of these facilities. These data centers house cloud service providers and support the growing demands for cloud servers and storage capacity. Security is a top priority for businesses, and enterprise servers offer advanced security features. They provide strong operating systems and server classes, including mid-range and volume servers, to cater to various business requirements.
How is this market segmented and which is the largest segment?
The market research report provides comprehensive data (region-wise segment analysis), with forecasts and estimates in "USD billion" for the period 2024-2028, as well as historical data from 2018-2022 for the following segments.
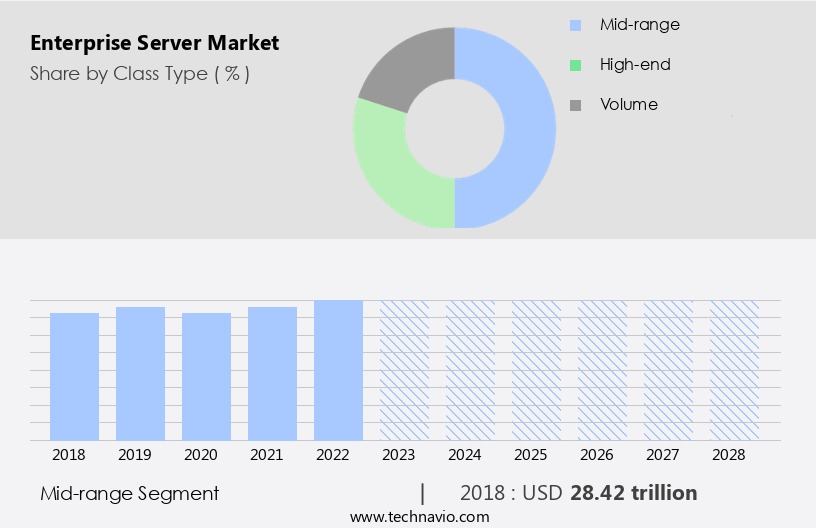
- Class Type
- Mid-range
- High-end
- Volume
- Geography
- North America
- Canada
- US
- Europe
- Germany
- UK
- APAC
- China
- Middle East and Africa
- South America
- North America
By Class Type Insights
- The mid-range segment is estimated to witness significant growth during the forecast period.
The mid-range segment of the market caters to businesses seeking a balance between cost-effectiveness and computing capacity. These servers are suitable for moderate-sized organizations and specific departments within larger enterprises that require more processing power than volume servers. Mid-range servers offer versatility with support for multiple operating systems, including Linux, Windows, and UNIX, ensuring flexibility in deployment. Rack-optimized servers, a popular configuration, are designed to maximize data center infrastructure efficiency by minimizing rack space and power consumption.
Furthermore, cloud service providers and data center services also leverage mid-range servers for their 5G Edge, Artificial Intelligence (AI), Machine Learning (ML), and Internet of Things (IoT) applications. Mid-range servers come in various configurations, enabling organizations to select solutions tailored to their unique needs.
Get a glance at the market report of share of various segments Request Free Sample
The mid-range segment was valued at USD 28.416 billion in 2018 and showed a gradual increase during the forecast period.
Regional Analysis
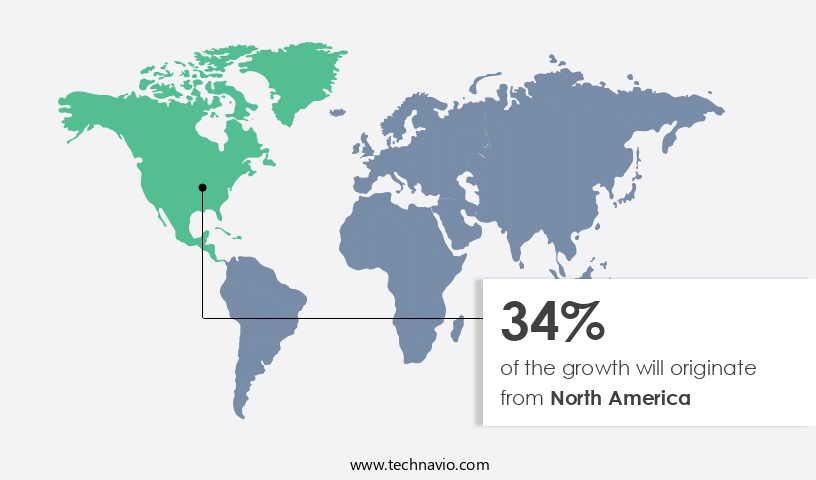
- North America is estimated to contribute 34% to the growth of the global market during the forecast period.
Technavio's analysts have elaborately explained the regional trends and drivers that shape the market during the forecast period.
For more insights on the market share of various regions Request Free Sample
The market in North America is experiencing significant growth due to increasing investments in hyperscale data centers. These data centers are revolutionizing the server industry and are expected to drive market expansion over the coming years. Additionally, a server refresh cycle is underway, providing an opportunity for industry growth. Emerging technologies such as flash storage, virtualization, and advanced management solutions are creating new avenues for market development. Furthermore, the demand for high-capacity memory servers, with an average requirement of 10-20 million GB dynamic random-access memory (DRAM), continues to fuel the growth of the North American market. The media and entertainment, healthcare, IT and telecommunications, electronics, semiconductor manufacturing, and supply chain industries are key contributors to this growth. Cloud applications, particularly those offered by AWS (Amazon Web Services), SAP deployments, and x86 high-end servers, are also significant market drivers.
Market Dynamics
Our researchers analyzed the data with 2023 as the base year, along with the key drivers, trends, and challenges. A holistic analysis of drivers will help companies refine their marketing strategies to gain a competitive advantage.
What are the key market drivers leading to the rise in adoption of Enterprise Server Market?
Increased popularity of flash-based storage devices is the key driver of the market.
- Enterprise servers continue to play a pivotal role in the global IT infrastructure market, particularly in the context of security, cloud computing solutions, and digital transformation. With the increasing adoption of cloud servers and edge data centers, the demand for servers with high storage capacity and processing speed is on the rise. Flash-based storage, such as solid-state drives (SSDs), has become a popular choice for enterprise server deployments due to their energy efficiency and compactness. Initially, SSDs were primarily used to accelerate I/O-intensive applications like databases and virtual desktop infrastructure. However, their benefits are now being leveraged in various other applications.
- Major companies are continually innovating to enhance the performance of SSDs, making them an attractive option for businesses seeking to optimize their IT hardware. The Production-Linked Incentive (PLI) scheme in India is expected to further boost the adoption of IT hardware, including servers, in the region. Software-defined networks (SDNs) are also gaining traction as they offer improved network agility and security. Overall, the market is poised for significant growth, driven by the increasing need for secure and efficient IT infrastructure to support big data and cloud computing solutions.
What are the market trends shaping the Enterprise Server Market?
The growing need for edge computing is the upcoming trend in the market.
- The market has witnessed significant growth due to the increasing demand for high-performance computing and business intelligence applications. With the increase in Big Data and the proliferation of the Internet of Things (IoT), the need for faster and more efficient servers has become imperative. The use of Enterprise Servers in edge computing, where data from IoT devices is processed near the source, has gained popularity. In 2022, the number of Internet-connected devices reached an estimated 14.4 billion, leading to a massive increase in data traffic. This trend is expected to continue as concepts such as connected cars, smart homes, and smart cities gain traction.
- In addition, to cater to the demands of high-speed data processing, Enterprise Servers are being deployed in hyperscale data centers. These data centers prioritize network performance, ensuring seamless multicast and TCP/IP connections. Desktop performance is also a crucial factor, as many businesses rely on servers to power their day-to-day operations. To meet the demands of these applications, Enterprise Servers are being equipped with advanced features such as Flash storage and faster memory. As the server-refresh cycle shortens, the need for high-performance servers becomes even more pressing. The use of Enterprise Servers in Big Data and high-performance computing applications is expected to continue driving market growth. Network performance and desktop performance are key considerations in the selection of Enterprise Servers, with TCP/IP and multicast connections being essential for efficient data transfer. In conclusion, the market is poised for continued growth as businesses seek to process and analyze the vast amounts of data generated by IoT devices and other applications.
What challenges does Enterprise Server Market face during the growth?
Increasing data center consolidation activity is a key challenge affecting the market growth.
- Infrastructure-as-a-service (IaaS) is a prominent cloud solution that enables businesses to access virtualized computing resources online. Notable IaaS providers include DigitalOcean, Linode, Rackspace, Amazon Web Services (AWS), Cisco Metapod, Microsoft Azure, and Google Compute Engine (GCE). The increasing popularity of IaaS has resulted in data center consolidation, a strategy aimed at minimizing operational expenses. By merging or downsizing data center facilities, companies can significantly reduce their costs. Furthermore, the shift towards a common cloud platform among software companies is further fueling this trend. Sustainability-linked financing is increasingly becoming a critical aspect of digital infrastructure development. The Open Compute Project, an initiative promoting open standards for data center hardware, is gaining traction.
- Hyper-converged infrastructure, a technology that integrates computing, storage, and networking into a single system, is also gaining popularity. The digital economy's growth is driving the demand for advanced IT and telecom infrastructure. Artificial Intelligence (AI) and 5G technologies are at the forefront of this transformation. A well-defined digital strategy is essential for businesses to remain competitive in this evolving landscape. Direct distribution, a sales model where manufacturers sell products directly to customers, is becoming more common in the IT and telecom sector. Resellers continue to play a vital role in the ecosystem, providing value-added services and customized solutions. In conclusion, IaaS is a significant trend in cloud computing, leading to data center consolidation.
Exclusive Customer Landscape
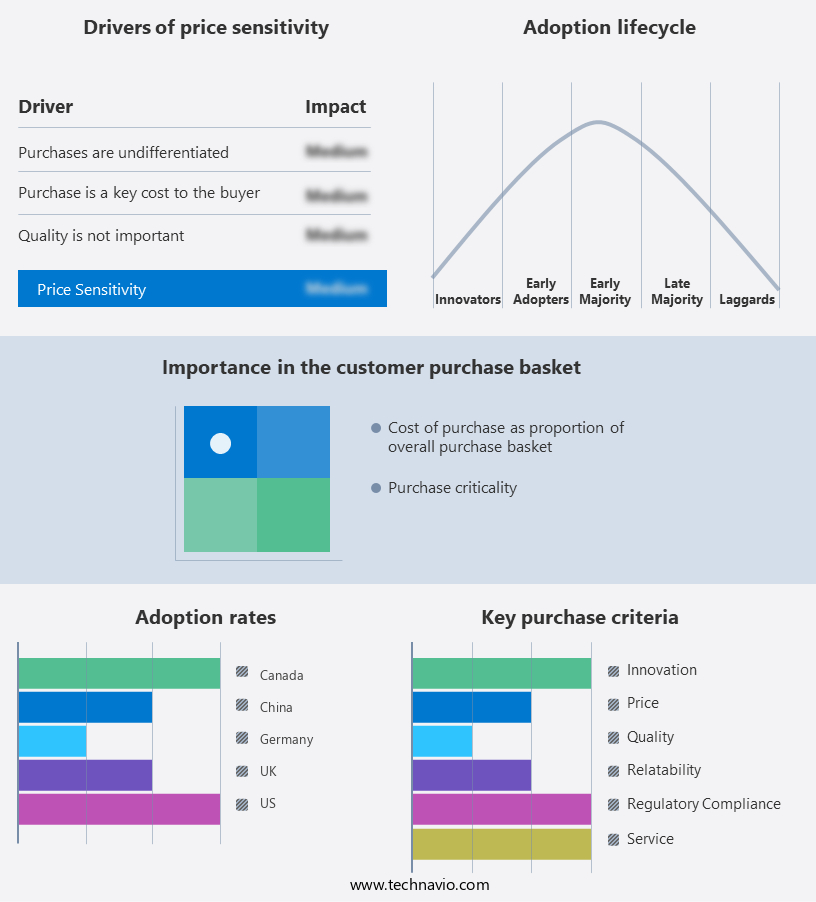
The market forecasting report includes the adoption lifecycle of the market, covering from the innovator's stage to the laggard's stage. It focuses on adoption rates in different regions based on penetration. Furthermore, the market report also includes key purchase criteria and drivers of price sensitivity to help companies evaluate and develop their market growth analysis strategies.
Customer Landscape
Key Companies & Market Insights
Companies are implementing various strategies, such as strategic alliances, market forecast, partnerships, mergers and acquisitions, geographical expansion, and product/service launches, to enhance their presence in the market. The market research and growth report includes detailed analyses of the competitive landscape of the market and information about key companies, including:
- ASUSTeK Computer Inc.
- Cisco Systems Inc.
- Dell Technologies Inc.
- Fujitsu Ltd.
- Hewlett Packard Enterprise Co.
- Huawei Technologies Co. Ltd.
- Inspur Group.
- International Business Machines Corp.
- Lenovo Group Ltd.
- Microsoft Corp.
- NEC Corp.
- Oracle Corp.
- Quanta Computer Inc.
- Super Micro Computer Inc.
- Toshiba Corp.
- Unisys Corp.
Qualitative and quantitative analysis of companies has been conducted to help clients understand the wider business environment as well as the strengths and weaknesses of key market players. Data is qualitatively analyzed to categorize companies as pure play, category-focused, industry-focused, and diversified; it is quantitatively analyzed to categorize companies as dominant, leading, strong, tentative, and weak.
Research Analyst Overview
The market is a dynamic and evolving landscape, driven by the increasing demand for high-performance computing, big data processing, and business intelligence applications. Enterprise servers are essential components of data center infrastructure, powering various industries such as healthcare, IT and telecommunication, media and entertainment, and electronics. These servers are designed to deliver superior speed and memory capabilities, enabling organizations to handle large workloads and data traffic. The market is witnessing a shift towards hyperscale data centers and rack-optimized servers, which offer increased computing capacity and network performance. Network services play a crucial role in enterprise servers, with TCP/IP and multicast technologies ensuring seamless connectivity.
Furthermore, desktop performance is also a critical consideration, with the need for fast processing and low latency. The market is witnessing a rise in demand for high-performance computing solutions, driven by the adoption of artificial intelligence (AI) and machine learning (ML) in various industries. The integration of 5G edge and IoT technologies is further fueling the growth of the market. Cloud service providers are increasingly offering server solutions, with AWS (Amazon Web Services) being a significant player. SAP deployments and x86 high-end servers are also popular choices for businesses looking to optimize their IT infrastructure. Security is a top priority in the market, with solutions designed to protect against cyber threats and ensure data privacy.
|
Market Scope |
|
|
Report Coverage |
Details |
|
Page number |
167 |
|
Base year |
2023 |
|
Historic period |
2018-2022 |
|
Forecast period |
2024-2028 |
|
Growth momentum & CAGR |
Accelerate at a CAGR of 7.2% |
|
Market Growth 2024-2028 |
USD 31,852.7 billion |
|
Market structure |
Fragmented |
|
YoY growth 2023-2024(%) |
6.6 |
|
Key countries |
US, Canada, Germany, China, and UK |
|
Competitive landscape |
Leading Companies, Market Positioning of Companies, Competitive Strategies, and Industry Risks |
What are the Key Data Covered in this Market Research and Growth Report?
- CAGR of the market during the forecast period
- Detailed information on factors that will drive the market growth and forecasting between 2024 and 2028
- Precise estimation of the size of the market and its contribution of the market in focus to the parent market
- Accurate predictions about upcoming market growth and trends and changes in consumer behaviour
- Growth of the market across North America, Europe, APAC, Middle East and Africa, and South America
- Thorough analysis of the market's competitive landscape and detailed information about companies
- Comprehensive analysis of factors that will challenge the growth of market companies
We can help! Our analysts can customize this market research report to meet your requirements. Get in touch
 RIA -
RIA - 
