Esports Market Analysis, Size, and Forecast 2026-2030: APAC (China, Japan, and India), Europe (Germany, UK, and France), North America (US, Canada, and Mexico), South America (Brazil and Argentina), Middle East and Africa (Saudi Arabia, South Africa, and UAE), and Rest of World (ROW)

Esports Market Analysis, Size, and Forecast 2026-2030:
APAC (China, Japan, and India), Europe (Germany, UK, and France), North America (US, Canada, and Mexico), South America (Brazil and Argentina), Middle East and Africa (Saudi Arabia, South Africa, and UAE), and Rest of World (ROW)

Published: May 2026 301 Pages SKU: IRTNTR43348

Market Overview at a Glance

$5.28 B
Market Opportunity
21.4%
CAGR 2025 - 2030
42.1%
APAC Growth
$1.62 B
Sponsorships segment 2024

Esports Market Size 2026-2030

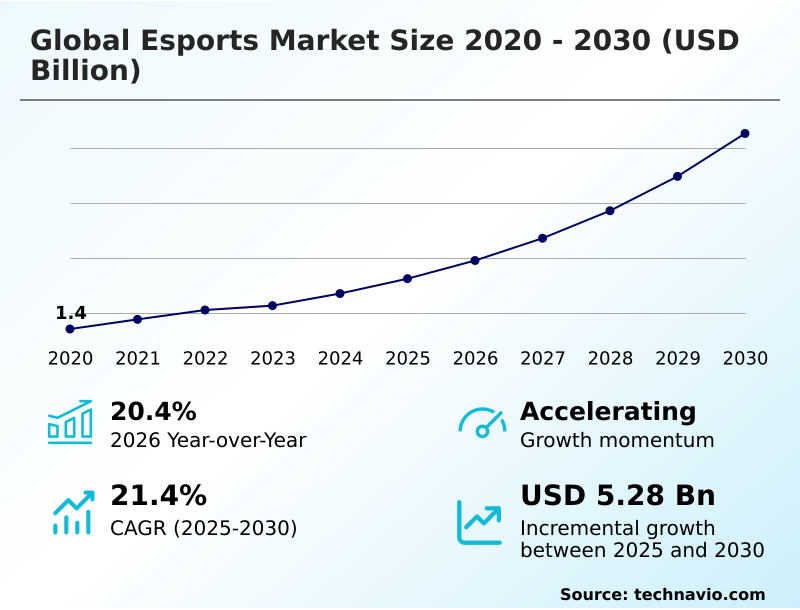
The esports market size is valued to increase by USD 5.28 billion, at a CAGR of 21.4% from 2025 to 2030. Proliferation of strategic brand sponsorships and commercial partnerships will drive the esports market.

Major Market Trends & Insights

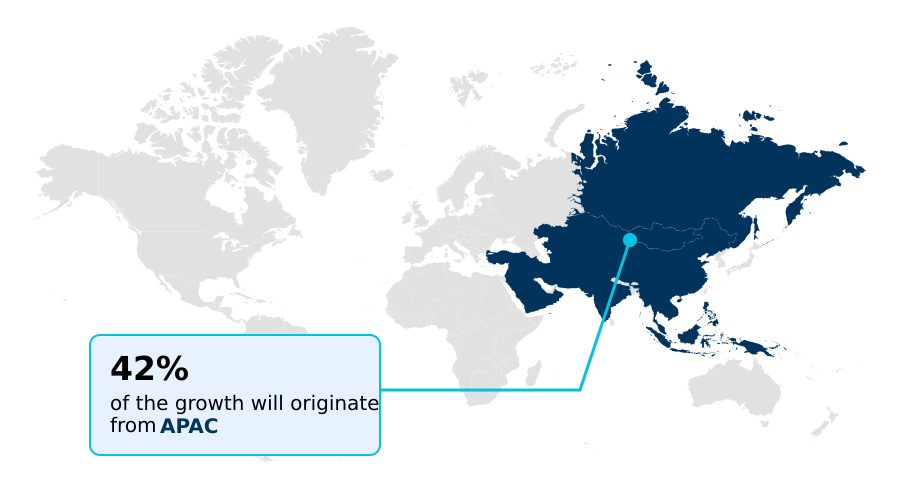
  • APAC dominated the market and accounted for a 42.1% growth during the forecast period.
  • By Revenue Stream - Sponsorships segment was valued at USD 1.62 billion in 2024
  • By Genre - MOBA segment accounted for the largest market revenue share in 2024

Market Size & Forecast

  • Market Opportunities: USD 7.11 billion
  • Market Future Opportunities: USD 5.28 billion
  • CAGR from 2025 to 2030 : 21.4%

Market Summary

  • The esports market is undergoing a period of rapid professionalization and commercial expansion, transitioning from a niche hobby into a mainstream entertainment industry. This growth is propelled by increasing institutional investment from non-endemic brands, the formalization of media rights agreements, and continuous advancements in streaming technology.
  • The ecosystem is now a complex interplay of game publishers, who control the intellectual property; professional team organizations managing high-performance training facilities; and tournament organizers staging large-scale live events. A core dynamic involves balancing the interests of these stakeholders.
  • For instance, a game publisher must manage game updates to maintain competitive integrity and viewer interest, which directly impacts professional player contracts and team strategies, all while creating opportunities for sponsorship activation and digital content creation.
  • Challenges such as player salary inflation and the need for sustainable fan monetization models persist, requiring innovative business strategies to ensure long-term viability for the entire competitive gaming ecosystem.

What will be the Size of the Esports Market during the forecast period?

Get Key Insights on Market Forecast (PDF) Get Free Sample

How is the Esports Market Segmented?

The esports industry research report provides comprehensive data (region-wise segment analysis), with forecasts and estimates in "USD million" for the period 2026-2030, as well as historical data from 2020-2024 for the following segments.
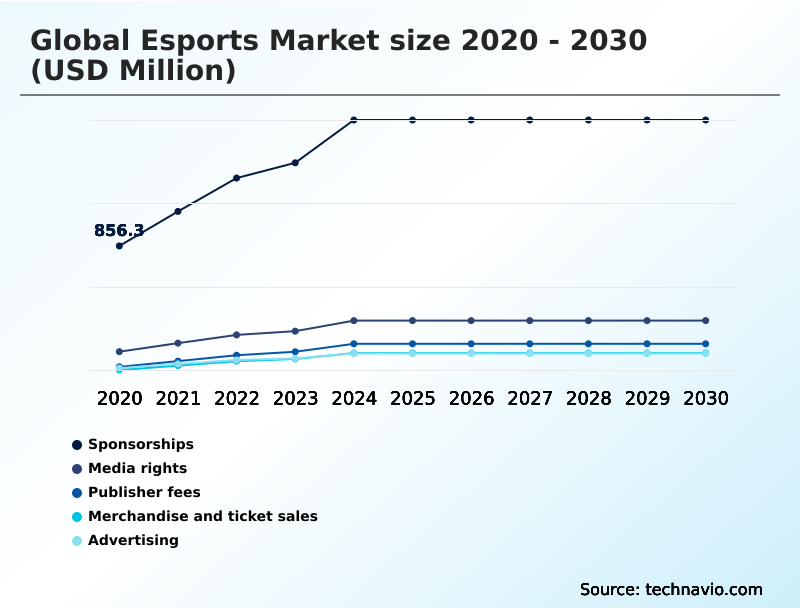
  • Revenue stream
    • Sponsorships
    • Media rights
    • Publisher fees
    • Merchandise and ticket sales
    • Advertising
  • Genre
    • MOBA
    • FPS
    • RTS
    • Others
  • Device
    • Smart phone and smart TV
    • Gaming console
    • Desktop/laptop/tablets
  • Geography
    • APAC
      • China
      • Japan
      • India
    • Europe
      • Germany
      • UK
      • France
    • North America
      • US
      • Canada
      • Mexico
    • South America
      • Brazil
      • Argentina
    • Middle East and Africa
      • Saudi Arabia
      • South Africa
      • UAE
    • Rest of World (ROW)

By Revenue Stream Insights

The sponsorships segment is estimated to witness significant growth during the forecast period.

The sponsorships segment is a foundational revenue stream, evolving from simple logo placement to complex, multifaceted campaigns. Sophisticated sponsorship activation now involves bespoke digital content, co-branded products, and experiential marketing at live events.

The segment's appeal lies in reaching a young, digitally native audience that is often elusive through traditional media. Data analytics are crucial, with organizations leveraging detailed viewer engagement metrics to demonstrate clear ROI, justifying premium fees and fostering strategic partnerships.

This influx of capital from non-endemic brands is critical for financial stability, supporting everything from high-performance training facilities to larger tournament prize pools.

As a result of such integrated strategies, some teams have seen fan merchandise sales increase by over 25% following a new sponsorship announcement.

Get Free Sample

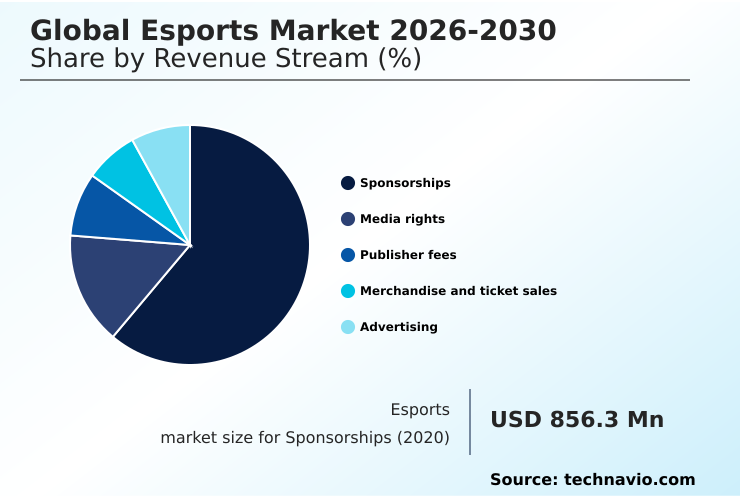
The Sponsorships segment was valued at USD 1.62 billion in 2024 and showed a gradual increase during the forecast period.

Get Free Sample

Regional Analysis

APAC is estimated to contribute 42.1% to the growth of the global market during the forecast period.Technavio’s analysts have elaborately explained the regional trends and drivers that shape the market during the forecast period.

See How Esports Market Demand is Rising in APAC Get Free Sample

The geographic landscape of the global esports market is diversifying, with APAC poised to contribute 42.1% of the total incremental growth.

This region's competitive gaming ecosystem is heavily influenced by mobile-first battle royale and team-based strategic combat titles, reflecting unique audience demographics and preferences.

In North America, the market is characterized by mature, franchise-based professional leagues for sports simulation games and first-person shooters, which attract substantial media rights deals.

Europe shows a fragmented but passionate market, with strong national leagues and a thriving grassroots competition scene. The growth in these key regions is underpinned by a global trend toward professionalization.

For example, organizations adopting structured collegiate esports programs report a 15% higher rate of securing top-tier talent from grassroots levels, solidifying the global talent pipeline.

Market Dynamics

Our researchers analyzed the data with 2025 as the base year, along with the key drivers, trends, and challenges. A holistic analysis of drivers will help companies refine their marketing strategies to gain a competitive advantage.

  • A critical examination of the global esports market 2026-2030 reveals nuanced strategic questions that extend beyond surface-level growth metrics. Stakeholders are increasingly focused on the long-term ROI of non-endemic brand sponsorship in esports, seeking data-driven proof of value.
  • Concurrently, the debate over publisher control versus third-party tournament organizers intensifies as the ecosystem matures, raising questions about competitive balance and revenue distribution. The industry is also exploring optimal monetization strategies for mobile esports titles, which command massive audiences but often have lower per-user revenue compared to their PC counterparts.
  • A significant area of innovation is the impact of AI on professional player performance, with teams using analytics to gain a competitive edge. This has led to the development of new legal frameworks for international player contracts that account for data rights and performance metrics.
  • Another key area is comparing franchised vs open tournament circuits, as organizations weigh financial stability against competitive dynamism. The role of cloud gaming in esports accessibility is reshaping infrastructure planning, while educational institutions are focused on building a sustainable collegiate esports program to create a formal talent pipeline.
  • Finally, the evolution of fan engagement models in team-based strategic combat games and understanding new revenue streams from virtual goods in battle royale games are central to achieving long-term profitability.

What are the key market drivers leading to the rise in the adoption of Esports Industry?

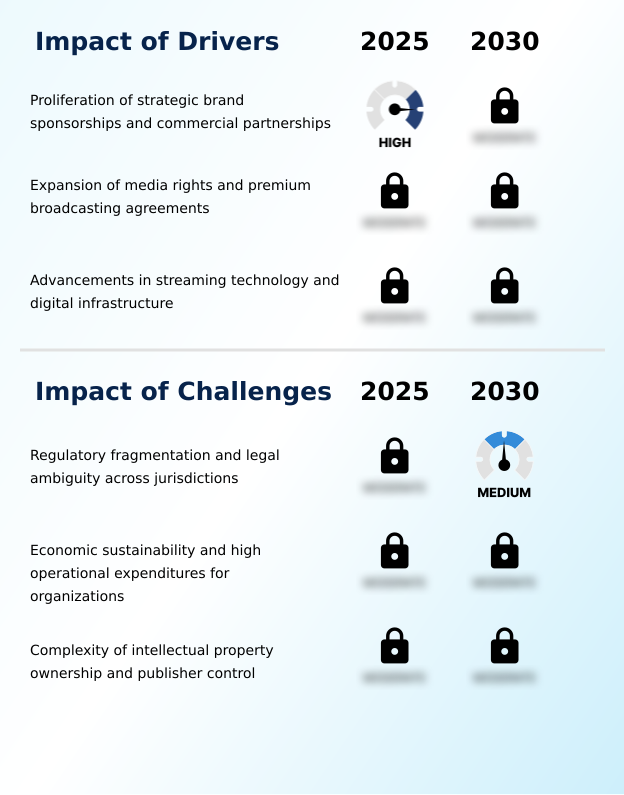
  • The proliferation of strategic brand sponsorships and commercial partnerships from non-endemic companies is a primary driver fueling the market's commercialization and professional growth.

  • The market's rapid commercialization is fueled by several key drivers, most notably the influx of non-endemic brands executing sophisticated sponsorship activation strategies.
  • These brand partnerships extend beyond simple logo placement, integrating into digital content creation and leveraging broadcasting services for maximum reach.
  • The formalization of media rights agreements with major digital streaming platforms is creating a stable, high-value revenue stream, with exclusive deals increasing a platform's subscriber base by up to 15% during a tournament season.
  • Furthermore, continuous advancements in streaming technology are enhancing the viewer experience and expanding accessibility.
  • The adoption of new compression technologies has reduced data usage for mobile viewers by 30%, broadening the addressable audience in data-sensitive markets and reinforcing the value proposition for advertisers and sponsors.

What are the market trends shaping the Esports Industry?

  • The expansion of mobile esports, propelled by significant regional infrastructure development in emerging markets, is reshaping the competitive landscape and audience demographics.

  • Key trends are reshaping the competitive landscape, led by the expansion of mobile esports and the requisite build-out of regional infrastructure. This shift democratizes access and creates new avenues for fan monetization, where tailored virtual goods sales in mobile-first markets have increased average revenue per user by 15%.
  • Simultaneously, the integration of AI and advanced data analytics is revolutionizing both performance and consumption. Teams are using these tools to refine strategies, improving win rates in specific matchups by up to 10%.
  • On the broadcast side, AI-driven viewer engagement metrics provide real-time feedback that allows platforms to personalize content, which has proven to extend average watch times by over 20%. This data-centric approach is becoming a cornerstone of the industry's evolution.

What challenges does the Esports Industry face during its growth?

  • Regulatory fragmentation and persistent legal ambiguity across key international jurisdictions present a primary challenge to scalable, global operations and investment stability.

  • The market faces significant structural challenges that temper its growth trajectory. The primary issue is the lack of a unified regulatory framework, creating legal ambiguity in areas like professional player contracts and cross-border operations. This regulatory fragmentation increases compliance costs by an estimated 20% for organizations operating globally.
  • Another critical challenge is achieving economic sustainability amid high operational expenditures and rampant player salary inflation. Many teams struggle to diversify beyond brand sponsorships, with over 60% of revenue for mid-tier organizations still coming from this single source.
  • Finally, the absolute intellectual property ownership and control wielded by game publishers create inherent market instability, as they can unilaterally alter a game's competitive ecosystem, risking the investments of all other stakeholders.

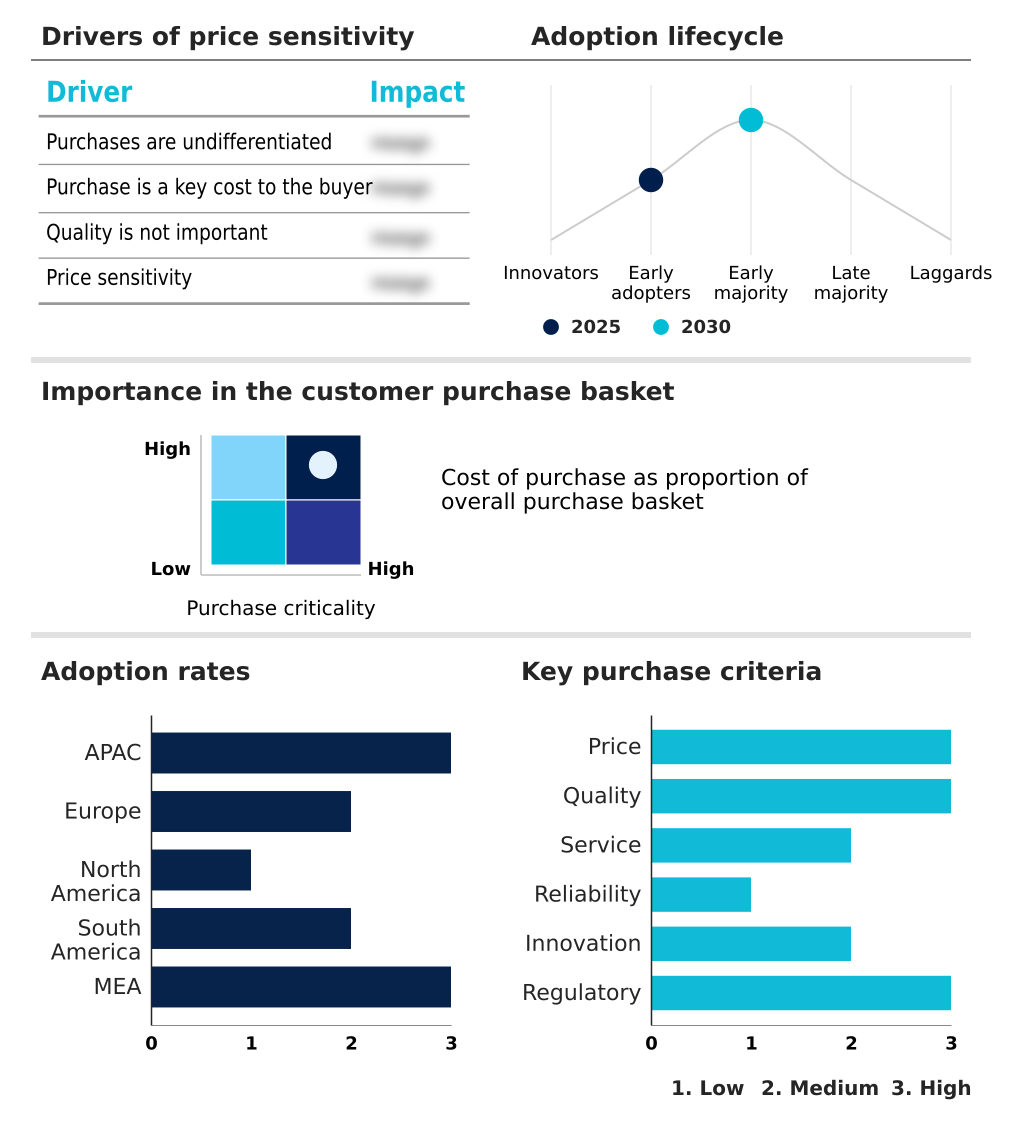
Exclusive Technavio Analysis on Customer Landscape

The esports market forecasting report includes the adoption lifecycle of the market, covering from the innovator’s stage to the laggard’s stage. It focuses on adoption rates in different regions based on penetration. Furthermore, the esports market report also includes key purchase criteria and drivers of price sensitivity to help companies evaluate and develop their market growth analysis strategies.

Customer Landscape of Esports Industry

Competitive Landscape

Companies are implementing various strategies, such as strategic alliances, esports market forecast, partnerships, mergers and acquisitions, geographical expansion, and product/service launches, to enhance their presence in the industry.

100 Thieves LLC - The company provides a portfolio of premier esports leagues and competitive gaming tournaments, operating key franchises that are central to the professional competitive ecosystem.

The industry research and growth report includes detailed analyses of the competitive landscape of the market and information about key companies, including:

  • 100 Thieves LLC
  • Activision Blizzard Inc.
  • BLAST ApS
  • Cloud9 Esports Inc
  • DreamHack AB
  • Electronic Arts Inc.
  • Epic Games Inc.
  • ESL FACEIT Group
  • FaZe Holdings Inc
  • Fnatic Ltd.
  • G2 Esports GmbH
  • Garena
  • Krafton Inc.
  • Logitech International SA
  • Nintendo Co. Ltd.
  • Riot Games Inc.
  • Team Liquid
  • TSM FTX Inc
  • Ubisoft Entertainment SA
  • Valve Corp.

Qualitative and quantitative analysis of companies has been conducted to help clients understand the wider business environment as well as the strengths and weaknesses of key industry players. Data is qualitatively analyzed to categorize companies as pure play, category-focused, industry-focused, and diversified; it is quantitatively analyzed to categorize companies as dominant, leading, strong, tentative, and weak.

Recent Development and News in Esports market

  • In March 2025, the Esports World Cup Foundation expanded its Club Partner Program, committing an additional $20 million to support team development and fan engagement initiatives.
  • In March 2025, Activision Blizzard Inc. announced a strategic overhaul for its main franchise league, shifting to an open, tournament-based circuit to reduce financial burdens on teams and improve viewership.
  • In January 2025, Riot Games Inc. adjusted its global partnership policies, officially permitting its partnered teams in major leagues to secure sponsorships from approved betting companies to enhance team financial sustainability.
  • In January 2025, the German Federal Ministry for Digital and Transport launched a $50 million fund to upgrade municipal arenas with fiber optic technology, bolstering the nation's esports infrastructure.

Dive into Technavio’s robust research methodology, blending expert interviews, extensive data synthesis, and validated models for unparalleled Esports Market insights. See full methodology.

Market Scope
Page number 301
Base year 2025
Historic period 2020-2024
Forecast period 2026-2030
Growth momentum & CAGR Accelerate at a CAGR of 21.4%
Market growth 2026-2030 USD 5282.6 million
Market structure Fragmented
YoY growth 2025-2026(%) 20.4%
Key countries China, Japan, India, South Korea, Australia, Indonesia, Germany, UK, France, Italy, Spain, The Netherlands, US, Canada, Mexico, Brazil, Argentina, Chile, Saudi Arabia, South Africa, UAE, Israel and Turkey
Competitive landscape Leading Companies, Market Positioning of Companies, Competitive Strategies, and Industry Risks

Request Free Sample

Research Analyst Overview

  • The esports market is defined by a highly structured competitive gaming ecosystem, where franchise-based leagues and major tournament prize pools are becoming standard. This professionalization is underpinned by sophisticated live event production and advancements in streaming technology, which facilitate a richer viewer experience through enhanced data analytics.
  • The integration of non-endemic brands via complex sponsorship activation has become a crucial revenue stream, though it necessitates careful management of intellectual property ownership and publisher control. A key boardroom consideration is the high operational cost, including player salary inflation and investments in high-performance training facilities, which must be balanced against revenue from media rights agreements and in-game monetization.
  • Organizations that successfully leverage digital content creation and fan monetization strategies see higher engagement. For instance, teams integrating direct-to-fan virtual goods sales have achieved a 30% increase in ancillary revenue per fan. Success hinges on navigating this complex environment, from managing professional player contracts to fostering grassroots competition and exploring ancillary markets like esports betting.

What are the Key Data Covered in this Esports Market Research and Growth Report?

  • What is the expected growth of the Esports Market between 2026 and 2030?

    • USD 5.28 billion, at a CAGR of 21.4%

  • What segmentation does the market report cover?

    • The report is segmented by Revenue Stream (Sponsorships, Media rights, Publisher fees, Merchandise and ticket sales, and Advertising), Genre (MOBA, FPS, RTS, and Others), Device (Smart phone and smart TV, Gaming console, and Desktop/laptop/tablets) and Geography (APAC, Europe, North America, South America, Middle East and Africa)

  • Which regions are analyzed in the report?

    • APAC, Europe, North America, South America and Middle East and Africa

  • What are the key growth drivers and market challenges?

    • Proliferation of strategic brand sponsorships and commercial partnerships, Regulatory fragmentation and legal ambiguity across jurisdictions

  • Who are the major players in the Esports Market?

    • 100 Thieves LLC, Activision Blizzard Inc., BLAST ApS, Cloud9 Esports Inc, DreamHack AB, Electronic Arts Inc., Epic Games Inc., ESL FACEIT Group, FaZe Holdings Inc, Fnatic Ltd., G2 Esports GmbH, Garena, Krafton Inc., Logitech International SA, Nintendo Co. Ltd., Riot Games Inc., Team Liquid, TSM FTX Inc, Ubisoft Entertainment SA and Valve Corp.

Market Research Insights

  • Market dynamics are defined by a push toward sustainable monetization strategies and enhanced viewer engagement. The reliance on brand sponsorships is diversifying, with professional leagues now generating significant revenue from media rights, where exclusive broadcast deals have shown to increase platform-specific viewership by up to 40%.
  • Concurrently, data-driven insights are optimizing brand partnerships, improving activation ROI by over 25% through precise audience analytics. However, a key tension exists between publisher relations and team organizations over revenue sharing from virtual items and franchised league fees.
  • This competitive landscape requires organizations to innovate fan engagement models beyond traditional methods, exploring new avenues to secure long-term financial health in a rapidly professionalizing industry.

We can help! Our analysts can customize this esports market research report to meet your requirements.

Get in touch

1. Executive Summary

1.1 Market overview

Executive Summary - Chart on Market Overview
Executive Summary - Data Table on Market Overview
Executive Summary - Chart on Global Market Characteristics
Executive Summary - Chart on Market by Geography
Executive Summary - Chart on Market Segmentation by Revenue Stream
Executive Summary - Chart on Market Segmentation by Genre
Executive Summary - Chart on Market Segmentation by Device
Executive Summary - Chart on Incremental Growth
Executive Summary - Data Table on Incremental Growth
Executive Summary - Chart on Company Market Positioning

2. Technavio Analysis

2.1 Analysis of price sensitivity, lifecycle, customer purchase basket, adoption rates, and purchase criteria

2.2 Criticality of inputs and Factors of differentiation

Chart on Overview on criticality of inputs and factors of differentiation

2.3 Factors of disruption

Chart on Overview on factors of disruption

2.4 Impact of drivers and challenges

Chart on Impact of drivers and challenges in 2025 and 2030

3. Market Landscape

3.1 Market ecosystem

Chart on Parent Market
Data Table on - Parent Market

3.2 Market characteristics

Chart on Market characteristics analysis

3.3 Value chain analysis

Chart on Value chain analysis

4. Market Sizing

4.1 Market definition

Data Table on Offerings of companies included in the market definition

4.2 Market segment analysis

Market segments

4.3 Market size 2025

4.4 Market outlook: Forecast for 2025-2030

Chart on Global - Market size and forecast 2025-2030 ($ million)
Data Table on Global - Market size and forecast 2025-2030 ($ million)
Chart on Global Market: Year-over-year growth 2025-2030 (%)
Data Table on Global Market: Year-over-year growth 2025-2030 (%)

5. Historic Market Size

5.1 Global Esports Market 2020 - 2024

Historic Market Size - Data Table on Global Esports Market 2020 - 2024 ($ million)

5.2 Revenue Stream segment analysis 2020 - 2024

Historic Market Size - Revenue Stream Segment 2020 - 2024 ($ million)

5.3 Genre segment analysis 2020 - 2024

Historic Market Size - Genre Segment 2020 - 2024 ($ million)

5.4 Device segment analysis 2020 - 2024

Historic Market Size - Device Segment 2020 - 2024 ($ million)

5.5 Geography segment analysis 2020 - 2024

Historic Market Size - Geography Segment 2020 - 2024 ($ million)

5.6 Country segment analysis 2020 - 2024

Historic Market Size - Country Segment 2020 - 2024 ($ million)

6. Qualitative Analysis

6.1 Impact of AI on global esports market

6.2 Impact of geopolitical conflicts on global esports market

7. Five Forces Analysis

7.1 Five forces summary

Five forces analysis - Comparison between 2025 and 2030

7.2 Bargaining power of buyers

Bargaining power of buyers - Impact of key factors 2025 and 2030

7.3 Bargaining power of suppliers

Bargaining power of suppliers - Impact of key factors in 2025 and 2030

7.4 Threat of new entrants

Threat of new entrants - Impact of key factors in 2025 and 2030

7.5 Threat of substitutes

Threat of substitutes - Impact of key factors in 2025 and 2030

7.6 Threat of rivalry

Threat of rivalry - Impact of key factors in 2025 and 2030

7.7 Market condition

Chart on Market condition - Five forces 2025 and 2030

8. Market Segmentation by Revenue Stream

8.1 Market segments

Chart on Revenue Stream - Market share 2025-2030 (%)
Data Table on Revenue Stream - Market share 2025-2030 (%)

8.2 Comparison by Revenue Stream

Chart on Comparison by Revenue Stream
Data Table on Comparison by Revenue Stream

8.3 Sponsorships - Market size and forecast 2025-2030

Chart on Sponsorships - Market size and forecast 2025-2030 ($ million)
Data Table on Sponsorships - Market size and forecast 2025-2030 ($ million)
Chart on Sponsorships - Year-over-year growth 2025-2030 (%)
Data Table on Sponsorships - Year-over-year growth 2025-2030 (%)

8.4 Media rights - Market size and forecast 2025-2030

Chart on Media rights - Market size and forecast 2025-2030 ($ million)
Data Table on Media rights - Market size and forecast 2025-2030 ($ million)
Chart on Media rights - Year-over-year growth 2025-2030 (%)
Data Table on Media rights - Year-over-year growth 2025-2030 (%)

8.5 Publisher fees - Market size and forecast 2025-2030

Chart on Publisher fees - Market size and forecast 2025-2030 ($ million)
Data Table on Publisher fees - Market size and forecast 2025-2030 ($ million)
Chart on Publisher fees - Year-over-year growth 2025-2030 (%)
Data Table on Publisher fees - Year-over-year growth 2025-2030 (%)

8.6 Merchandise and ticket sales - Market size and forecast 2025-2030

Chart on Merchandise and ticket sales - Market size and forecast 2025-2030 ($ million)
Data Table on Merchandise and ticket sales - Market size and forecast 2025-2030 ($ million)
Chart on Merchandise and ticket sales - Year-over-year growth 2025-2030 (%)
Data Table on Merchandise and ticket sales - Year-over-year growth 2025-2030 (%)

8.7 Advertising - Market size and forecast 2025-2030

Chart on Advertising - Market size and forecast 2025-2030 ($ million)
Data Table on Advertising - Market size and forecast 2025-2030 ($ million)
Chart on Advertising - Year-over-year growth 2025-2030 (%)
Data Table on Advertising - Year-over-year growth 2025-2030 (%)

8.8 Market opportunity by Revenue Stream

Market opportunity by Revenue Stream ($ million)
Data Table on Market opportunity by Revenue Stream ($ million)

9. Market Segmentation by Genre

9.1 Market segments

Chart on Genre - Market share 2025-2030 (%)
Data Table on Genre - Market share 2025-2030 (%)

9.2 Comparison by Genre

Chart on Comparison by Genre
Data Table on Comparison by Genre

9.3 MOBA - Market size and forecast 2025-2030

Chart on MOBA - Market size and forecast 2025-2030 ($ million)
Data Table on MOBA - Market size and forecast 2025-2030 ($ million)
Chart on MOBA - Year-over-year growth 2025-2030 (%)
Data Table on MOBA - Year-over-year growth 2025-2030 (%)

9.4 FPS - Market size and forecast 2025-2030

Chart on FPS - Market size and forecast 2025-2030 ($ million)
Data Table on FPS - Market size and forecast 2025-2030 ($ million)
Chart on FPS - Year-over-year growth 2025-2030 (%)
Data Table on FPS - Year-over-year growth 2025-2030 (%)

9.5 RTS - Market size and forecast 2025-2030

Chart on RTS - Market size and forecast 2025-2030 ($ million)
Data Table on RTS - Market size and forecast 2025-2030 ($ million)
Chart on RTS - Year-over-year growth 2025-2030 (%)
Data Table on RTS - Year-over-year growth 2025-2030 (%)

9.6 Others - Market size and forecast 2025-2030

Chart on Others - Market size and forecast 2025-2030 ($ million)
Data Table on Others - Market size and forecast 2025-2030 ($ million)
Chart on Others - Year-over-year growth 2025-2030 (%)
Data Table on Others - Year-over-year growth 2025-2030 (%)

9.7 Market opportunity by Genre

Market opportunity by Genre ($ million)
Data Table on Market opportunity by Genre ($ million)

10. Market Segmentation by Device

10.1 Market segments

Chart on Device - Market share 2025-2030 (%)
Data Table on Device - Market share 2025-2030 (%)

10.2 Comparison by Device

Chart on Comparison by Device
Data Table on Comparison by Device

10.3 Smart phone and smart TV - Market size and forecast 2025-2030

Chart on Smart phone and smart TV - Market size and forecast 2025-2030 ($ million)
Data Table on Smart phone and smart TV - Market size and forecast 2025-2030 ($ million)
Chart on Smart phone and smart TV - Year-over-year growth 2025-2030 (%)
Data Table on Smart phone and smart TV - Year-over-year growth 2025-2030 (%)

10.4 Gaming console - Market size and forecast 2025-2030

Chart on Gaming console - Market size and forecast 2025-2030 ($ million)
Data Table on Gaming console - Market size and forecast 2025-2030 ($ million)
Chart on Gaming console - Year-over-year growth 2025-2030 (%)
Data Table on Gaming console - Year-over-year growth 2025-2030 (%)

10.5 Desktop/laptop/tablets - Market size and forecast 2025-2030

Chart on Desktop/laptop/tablets - Market size and forecast 2025-2030 ($ million)
Data Table on Desktop/laptop/tablets - Market size and forecast 2025-2030 ($ million)
Chart on Desktop/laptop/tablets - Year-over-year growth 2025-2030 (%)
Data Table on Desktop/laptop/tablets - Year-over-year growth 2025-2030 (%)

10.6 Market opportunity by Device

Market opportunity by Device ($ million)
Data Table on Market opportunity by Device ($ million)

11. Customer Landscape

11.1 Customer landscape overview

Analysis of price sensitivity, lifecycle, customer purchase basket, adoption rates, and purchase criteria

12. Geographic Landscape

12.1 Geographic segmentation

Chart on Market share by geography 2025-2030 (%)
Data Table on Market share by geography 2025-2030 (%)

12.2 Geographic comparison

Chart on Geographic comparison
Data Table on Geographic comparison

12.3 APAC - Market size and forecast 2025-2030

Chart on APAC - Market size and forecast 2025-2030 ($ million)
Data Table on APAC - Market size and forecast 2025-2030 ($ million)
Chart on APAC - Year-over-year growth 2025-2030 (%)
Data Table on APAC - Year-over-year growth 2025-2030 (%)
Chart on Regional Comparison - APAC
Data Table on Regional Comparison - APAC

12.3.1 China - Market size and forecast 2025-2030

Chart on China - Market size and forecast 2025-2030 ($ million)
Data Table on China - Market size and forecast 2025-2030 ($ million)
Chart on China - Year-over-year growth 2025-2030 (%)
Data Table on China - Year-over-year growth 2025-2030 (%)

12.3.2 Japan - Market size and forecast 2025-2030

Chart on Japan - Market size and forecast 2025-2030 ($ million)
Data Table on Japan - Market size and forecast 2025-2030 ($ million)
Chart on Japan - Year-over-year growth 2025-2030 (%)
Data Table on Japan - Year-over-year growth 2025-2030 (%)

12.3.3 India - Market size and forecast 2025-2030

Chart on India - Market size and forecast 2025-2030 ($ million)
Data Table on India - Market size and forecast 2025-2030 ($ million)
Chart on India - Year-over-year growth 2025-2030 (%)
Data Table on India - Year-over-year growth 2025-2030 (%)

12.3.4 South Korea - Market size and forecast 2025-2030

Chart on South Korea - Market size and forecast 2025-2030 ($ million)
Data Table on South Korea - Market size and forecast 2025-2030 ($ million)
Chart on South Korea - Year-over-year growth 2025-2030 (%)
Data Table on South Korea - Year-over-year growth 2025-2030 (%)

12.3.5 Australia - Market size and forecast 2025-2030

Chart on Australia - Market size and forecast 2025-2030 ($ million)
Data Table on Australia - Market size and forecast 2025-2030 ($ million)
Chart on Australia - Year-over-year growth 2025-2030 (%)
Data Table on Australia - Year-over-year growth 2025-2030 (%)

12.3.6 Indonesia - Market size and forecast 2025-2030

Chart on Indonesia - Market size and forecast 2025-2030 ($ million)
Data Table on Indonesia - Market size and forecast 2025-2030 ($ million)
Chart on Indonesia - Year-over-year growth 2025-2030 (%)
Data Table on Indonesia - Year-over-year growth 2025-2030 (%)

12.4 Europe - Market size and forecast 2025-2030

Chart on Europe - Market size and forecast 2025-2030 ($ million)
Data Table on Europe - Market size and forecast 2025-2030 ($ million)
Chart on Europe - Year-over-year growth 2025-2030 (%)
Data Table on Europe - Year-over-year growth 2025-2030 (%)
Chart on Regional Comparison - Europe
Data Table on Regional Comparison - Europe

12.4.1 Germany - Market size and forecast 2025-2030

Chart on Germany - Market size and forecast 2025-2030 ($ million)
Data Table on Germany - Market size and forecast 2025-2030 ($ million)
Chart on Germany - Year-over-year growth 2025-2030 (%)
Data Table on Germany - Year-over-year growth 2025-2030 (%)

12.4.2 UK - Market size and forecast 2025-2030

Chart on UK - Market size and forecast 2025-2030 ($ million)
Data Table on UK - Market size and forecast 2025-2030 ($ million)
Chart on UK - Year-over-year growth 2025-2030 (%)
Data Table on UK - Year-over-year growth 2025-2030 (%)

12.4.3 France - Market size and forecast 2025-2030

Chart on France - Market size and forecast 2025-2030 ($ million)
Data Table on France - Market size and forecast 2025-2030 ($ million)
Chart on France - Year-over-year growth 2025-2030 (%)
Data Table on France - Year-over-year growth 2025-2030 (%)

12.4.4 Italy - Market size and forecast 2025-2030

Chart on Italy - Market size and forecast 2025-2030 ($ million)
Data Table on Italy - Market size and forecast 2025-2030 ($ million)
Chart on Italy - Year-over-year growth 2025-2030 (%)
Data Table on Italy - Year-over-year growth 2025-2030 (%)

12.4.5 Spain - Market size and forecast 2025-2030

Chart on Spain - Market size and forecast 2025-2030 ($ million)
Data Table on Spain - Market size and forecast 2025-2030 ($ million)
Chart on Spain - Year-over-year growth 2025-2030 (%)
Data Table on Spain - Year-over-year growth 2025-2030 (%)

12.4.6 The Netherlands - Market size and forecast 2025-2030

Chart on The Netherlands - Market size and forecast 2025-2030 ($ million)
Data Table on The Netherlands - Market size and forecast 2025-2030 ($ million)
Chart on The Netherlands - Year-over-year growth 2025-2030 (%)
Data Table on The Netherlands - Year-over-year growth 2025-2030 (%)

12.5 North America - Market size and forecast 2025-2030

Chart on North America - Market size and forecast 2025-2030 ($ million)
Data Table on North America - Market size and forecast 2025-2030 ($ million)
Chart on North America - Year-over-year growth 2025-2030 (%)
Data Table on North America - Year-over-year growth 2025-2030 (%)
Chart on Regional Comparison - North America
Data Table on Regional Comparison - North America

12.5.1 US - Market size and forecast 2025-2030

Chart on US - Market size and forecast 2025-2030 ($ million)
Data Table on US - Market size and forecast 2025-2030 ($ million)
Chart on US - Year-over-year growth 2025-2030 (%)
Data Table on US - Year-over-year growth 2025-2030 (%)

12.5.2 Canada - Market size and forecast 2025-2030

Chart on Canada - Market size and forecast 2025-2030 ($ million)
Data Table on Canada - Market size and forecast 2025-2030 ($ million)
Chart on Canada - Year-over-year growth 2025-2030 (%)
Data Table on Canada - Year-over-year growth 2025-2030 (%)

12.5.3 Mexico - Market size and forecast 2025-2030

Chart on Mexico - Market size and forecast 2025-2030 ($ million)
Data Table on Mexico - Market size and forecast 2025-2030 ($ million)
Chart on Mexico - Year-over-year growth 2025-2030 (%)
Data Table on Mexico - Year-over-year growth 2025-2030 (%)

12.6 South America - Market size and forecast 2025-2030

Chart on South America - Market size and forecast 2025-2030 ($ million)
Data Table on South America - Market size and forecast 2025-2030 ($ million)
Chart on South America - Year-over-year growth 2025-2030 (%)
Data Table on South America - Year-over-year growth 2025-2030 (%)
Chart on Regional Comparison - South America
Data Table on Regional Comparison - South America

12.6.1 Brazil - Market size and forecast 2025-2030

Chart on Brazil - Market size and forecast 2025-2030 ($ million)
Data Table on Brazil - Market size and forecast 2025-2030 ($ million)
Chart on Brazil - Year-over-year growth 2025-2030 (%)
Data Table on Brazil - Year-over-year growth 2025-2030 (%)

12.6.2 Argentina - Market size and forecast 2025-2030

Chart on Argentina - Market size and forecast 2025-2030 ($ million)
Data Table on Argentina - Market size and forecast 2025-2030 ($ million)
Chart on Argentina - Year-over-year growth 2025-2030 (%)
Data Table on Argentina - Year-over-year growth 2025-2030 (%)

12.6.3 Chile - Market size and forecast 2025-2030

Chart on Chile - Market size and forecast 2025-2030 ($ million)
Data Table on Chile - Market size and forecast 2025-2030 ($ million)
Chart on Chile - Year-over-year growth 2025-2030 (%)
Data Table on Chile - Year-over-year growth 2025-2030 (%)

12.7 Middle East and Africa - Market size and forecast 2025-2030

Chart on Middle East and Africa - Market size and forecast 2025-2030 ($ million)
Data Table on Middle East and Africa - Market size and forecast 2025-2030 ($ million)
Chart on Middle East and Africa - Year-over-year growth 2025-2030 (%)
Data Table on Middle East and Africa - Year-over-year growth 2025-2030 (%)
Chart on Regional Comparison - Middle East and Africa
Data Table on Regional Comparison - Middle East and Africa

12.7.1 Saudi Arabia - Market size and forecast 2025-2030

Chart on Saudi Arabia - Market size and forecast 2025-2030 ($ million)
Data Table on Saudi Arabia - Market size and forecast 2025-2030 ($ million)
Chart on Saudi Arabia - Year-over-year growth 2025-2030 (%)
Data Table on Saudi Arabia - Year-over-year growth 2025-2030 (%)

12.7.2 South Africa - Market size and forecast 2025-2030

Chart on South Africa - Market size and forecast 2025-2030 ($ million)
Data Table on South Africa - Market size and forecast 2025-2030 ($ million)
Chart on South Africa - Year-over-year growth 2025-2030 (%)
Data Table on South Africa - Year-over-year growth 2025-2030 (%)

12.7.3 UAE - Market size and forecast 2025-2030

Chart on UAE - Market size and forecast 2025-2030 ($ million)
Data Table on UAE - Market size and forecast 2025-2030 ($ million)
Chart on UAE - Year-over-year growth 2025-2030 (%)
Data Table on UAE - Year-over-year growth 2025-2030 (%)

12.7.4 Israel - Market size and forecast 2025-2030

Chart on Israel - Market size and forecast 2025-2030 ($ million)
Data Table on Israel - Market size and forecast 2025-2030 ($ million)
Chart on Israel - Year-over-year growth 2025-2030 (%)
Data Table on Israel - Year-over-year growth 2025-2030 (%)

12.7.5 Turkey - Market size and forecast 2025-2030

Chart on Turkey - Market size and forecast 2025-2030 ($ million)
Data Table on Turkey - Market size and forecast 2025-2030 ($ million)
Chart on Turkey - Year-over-year growth 2025-2030 (%)
Data Table on Turkey - Year-over-year growth 2025-2030 (%)

12.8 Market opportunity by geography

Market opportunity by geography ($ million)
Data Tables on Market opportunity by geography ($ million)

13. Drivers, Challenges, and Opportunity

13.1 Market drivers

Proliferation of strategic brand sponsorships and commercial partnerships
Expansion of media rights and premium broadcasting agreements
Advancements in streaming technology and digital infrastructure

13.2 Market challenges

Regulatory fragmentation and legal ambiguity across jurisdictions
Economic sustainability and high operational expenditures for organizations
Complexity of intellectual property ownership and publisher control

13.3 Impact of drivers and challenges

Impact of drivers and challenges in 2025 and 2030

13.4 Market opportunities

Expansion of mobile esports and regional infrastructure development
Integration of artificial intelligence and advanced data analytics
Rise of national identity and government-backed ecosystems

14. Competitive Landscape

14.1 Overview

14.2

Overview on criticality of inputs and factors of differentiation

14.3 Landscape disruption

Overview on factors of disruption

14.4 Industry risks

Impact of key risks on business

15. Competitive Analysis

15.1 Companies profiled

Companies covered

15.2 Company ranking index

15.3 Market positioning of companies

Matrix on companies position and classification

15.4 100 Thieves LLC

100 Thieves LLC - Overview
100 Thieves LLC - Product / Service
100 Thieves LLC - Key offerings
SWOT

15.5 Activision Blizzard Inc.

Activision Blizzard Inc. - Overview
Activision Blizzard Inc. - Product / Service
Activision Blizzard Inc. - Key offerings
SWOT

15.6 BLAST ApS

BLAST ApS - Overview
BLAST ApS - Product / Service
BLAST ApS - Key offerings
SWOT

15.7 DreamHack AB

DreamHack AB - Overview
DreamHack AB - Product / Service
DreamHack AB - Key offerings
SWOT

15.8 Electronic Arts Inc.

Electronic Arts Inc. - Overview
Electronic Arts Inc. - Product / Service
Electronic Arts Inc. - Key offerings
SWOT

15.9 Epic Games Inc.

Epic Games Inc. - Overview
Epic Games Inc. - Product / Service
Epic Games Inc. - Key offerings
SWOT

15.10 ESL FACEIT Group

ESL FACEIT Group - Overview
ESL FACEIT Group - Product / Service
ESL FACEIT Group - Key offerings
SWOT

15.11 FaZe Holdings Inc

FaZe Holdings Inc - Overview
FaZe Holdings Inc - Product / Service
FaZe Holdings Inc - Key offerings
SWOT

15.12 Garena

Garena - Overview
Garena - Product / Service
Garena - Key offerings
SWOT

15.13 Krafton Inc.

Krafton Inc. - Overview
Krafton Inc. - Product / Service
Krafton Inc. - Key offerings
SWOT

15.14 Logitech International SA

Logitech International SA - Overview
Logitech International SA - Business segments
Logitech International SA - Key news
Logitech International SA - Key offerings
Logitech International SA - Segment focus
SWOT

15.15 Nintendo Co. Ltd.

Nintendo Co. Ltd. - Overview
Nintendo Co. Ltd. - Product / Service
Nintendo Co. Ltd. - Key offerings
SWOT

15.16 Riot Games Inc.

Riot Games Inc. - Overview
Riot Games Inc. - Product / Service
Riot Games Inc. - Key offerings
SWOT

15.17 Ubisoft Entertainment SA

Ubisoft Entertainment SA - Overview
Ubisoft Entertainment SA - Business segments
Ubisoft Entertainment SA - Key offerings
Ubisoft Entertainment SA - Segment focus
SWOT

15.18 Valve Corp.

Valve Corp. - Overview
Valve Corp. - Product / Service
Valve Corp. - Key offerings
SWOT

16. Appendix

16.1 Scope of the report

Market definition
Objectives
Notes and caveats

16.2 Inclusions and exclusions checklist

Inclusions checklist
Exclusions checklist

16.3 Currency conversion rates for US$

16.4 Research methodology

16.5 Data procurement

Information sources

16.6 Data validation

16.7 Validation techniques employed for market sizing

16.8 Data synthesis

16.9 360 degree market analysis

16.10 List of abbreviations

Research Methodology

Technavio presents a detailed picture of the market by way of study, synthesis, and summation of data from multiple sources. The analysts have presented the various facets of the market with a particular focus on identifying the key industry influencers. The data thus presented is comprehensive, reliable, and the result of extensive research, both primary and secondary.

INFORMATION SOURCES

Primary sources

  • Manufacturers and suppliers
  • Channel partners
  • Industry experts
  • Strategic decision makers

Secondary sources

  • Industry journals and periodicals
  • Government data
  • Financial reports of key industry players
  • Historical data
  • Press releases

DATA ANALYSIS

Data Synthesis

  • Collation of data
  • Estimation of key figures
  • Analysis of derived insights

Data Validation

  • Triangulation with data models
  • Reference against proprietary databases
  • Corroboration with industry experts

REPORT WRITING

Qualitative

  • Market drivers
  • Market challenges
  • Market trends
  • Five forces analysis

Quantitative

  • Market size and forecast
  • Market segmentation
  • Geographical insights
  • Competitive landscape

Interested in this report?

Get your sample now to see our research methodology and insights!

Download Now

Frequently Asked Questions

Esports market growth will increase by USD 5282.6 million during 2026-2030.

The Esports market is expected to grow at a CAGR of 21.4% during 2026-2030.

Esports market is segmented by Revenue stream (Sponsorships, Media rights, Publisher fees, Merchandise and ticket sales, Advertising) Genre (MOBA, FPS, RTS, Others) Device (Smart phone and smart TV, Gaming console, Desktop/laptop/tablets)

100 Thieves LLC, Activision Blizzard Inc., BLAST ApS, Cloud9 Esports Inc, DreamHack AB, Electronic Arts Inc., Epic Games Inc., ESL FACEIT Group, FaZe Holdings Inc, Fnatic Ltd., G2 Esports GmbH, Garena, Krafton Inc., Logitech International SA, Nintendo Co. Ltd., Riot Games Inc., Team Liquid, TSM FTX Inc, Ubisoft Entertainment SA, Valve Corp. are a few of the key vendors in the Esports market.

APAC will register the highest growth rate of 42.1% among the other regions. Therefore, the Esports market in APAC is expected to garner significant business opportunities for the vendors during the forecast period.

China, Japan, India, South Korea, Australia, Indonesia, Germany, UK, France, Italy, Spain, The Netherlands, US, Canada, Mexico, Brazil, Argentina, Chile, Saudi Arabia, South Africa, UAE, Israel, Turkey

  • Proliferation of strategic brand sponsorships and commercial partnerships is the driving factor this market.

The Esports market vendors should focus on grabbing business opportunities from the Revenue stream segment as it accounted for the largest market share in the base year.
RIA - Research AI Assistant
Ask RIA