Ethernet Communication Modules Market Analysis, Size, and Forecast 2026-2030: APAC (China, Japan, and South Korea), North America (US, Canada, and Mexico), Europe (Germany, Italy, and France), South America (Brazil, Argentina, and Chile), Middle East and Africa (Saudi Arabia, UAE, and South Africa), and Rest of World (ROW)

Ethernet Communication Modules Market Analysis, Size, and Forecast 2026-2030:
APAC (China, Japan, and South Korea), North America (US, Canada, and Mexico), Europe (Germany, Italy, and France), South America (Brazil, Argentina, and Chile), Middle East and Africa (Saudi Arabia, UAE, and South Africa), and Rest of World (ROW)

Published: Oct 2026 321 Pages SKU: IRTNTR81713

Market Overview at a Glance

$894.4 Mn
Market Opportunity
8.5%
CAGR 2025 - 2030
43.2%
APAC Growth
$428.3 Mn
I/O modules segment 2024

Ethernet Communication Modules Market Size 2026-2030

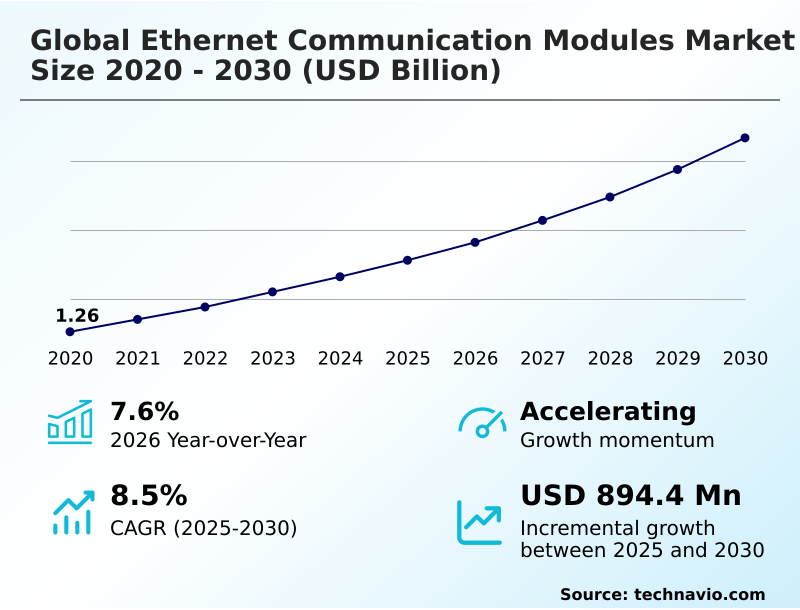
The ethernet communication modules market size is valued to increase by USD 894.4 million, at a CAGR of 8.5% from 2025 to 2030. Industrial automation and proliferation of smart factory ecosystems will drive the ethernet communication modules market.

Major Market Trends & Insights

  • APAC dominated the market and accounted for a 43.2% growth during the forecast period.
  • By Type - I/O modules segment was valued at USD 428.3 million in 2024
  • By Product Type - 8 channels segment accounted for the largest market revenue share in 2024

Market Size & Forecast

  • Market Opportunities: USD 1.41 billion
  • Market Future Opportunities: USD 894.4 million
  • CAGR from 2025 to 2030 : 8.5%

Market Summary

  • The Ethernet Communication Modules Market represents a critical infrastructure layer facilitating high speed data transmission across automated commercial ecosystems. Industrial facilities rely heavily on these components to maintain continuous connectivity between robotic assembly lines and central management servers.
  • A large scale automotive manufacturing plant transitioning to these advanced interfaces experienced a 22% reduction in unmapped network latency compared to legacy fieldbus setups. This adoption is primarily driven by the rapid expansion of smart factory ecosystems, where the necessity for real time analytics compels operators to upgrade their physical routing hardware.
  • Consequently, plant managers can execute synchronized operations with greater precision. However, this increased connectivity introduces severe cybersecurity vulnerabilities, as expanded digital footprints provide new vectors for malicious intrusions. The integration of robust encryption directly at the hardware level remains a complex requirement, forcing manufacturers to balance stringent security compliance with operational throughput demands.
  • Ultimately, these communication modules dictate the efficiency and safety of modern mechanized production networks.

What will be the Size of the Ethernet Communication Modules Market during the forecast period?
Get Key Insights on Market Forecast (PDF) Get Free Sample

How is the Ethernet Communication Modules Market Segmented?

The ethernet communication modules industry research report provides comprehensive data (region-wise segment analysis), with forecasts and estimates in "USD million" for the period 2026-2030, as well as historical data from 2020-2024 for the following segments.

  • Type
    • I/O modules
    • Media converter modules
    • Interface modules
    • Switch modules
    • Others
  • Product type
    • 8 channels
    • 16 channels
    • Others
  • Application
    • Industrial automation
    • Building automation
    • Transportation
    • Energy and utilities
    • Others
  • Geography
    • APAC
      • China
      • Japan
      • South Korea
      • India
      • Taiwan
      • Australia
    • North America
      • US
      • Canada
      • Mexico
    • Europe
      • Germany
      • Italy
      • France
      • UK
      • Spain
      • The Netherlands
    • South America
      • Brazil
      • Argentina
      • Chile
    • Middle East and Africa
      • Saudi Arabia
      • UAE
      • South Africa
      • Israel
      • Turkey

By Type Insights

The i/o modules segment is estimated to witness significant growth during the forecast period.

The input and output configurations facilitate the direct conversion of field level data into deterministic digital formats across factory floors. Operations utilizing these hardware components demonstrate a 15% improvement in signal reliability compared to legacy analog setups.

This shift occurs because galvanic channel isolation prevents electrical noise from corrupting data streams, directly enabling more accurate predictive maintenance telemetry.

Facilities rely on this hardware to establish a reliable industrial protocol gateway between raw physical measurements and central programmable logic controllers. The integration of sensor node aggregation allows for seamless real time diagnostics without straining primary network bandwidth.

By replacing traditional copper twisted pair connections with advanced digital routing, plant managers achieve highly stable closed loop control within complex supervisory control arrays.
Get Free Sample

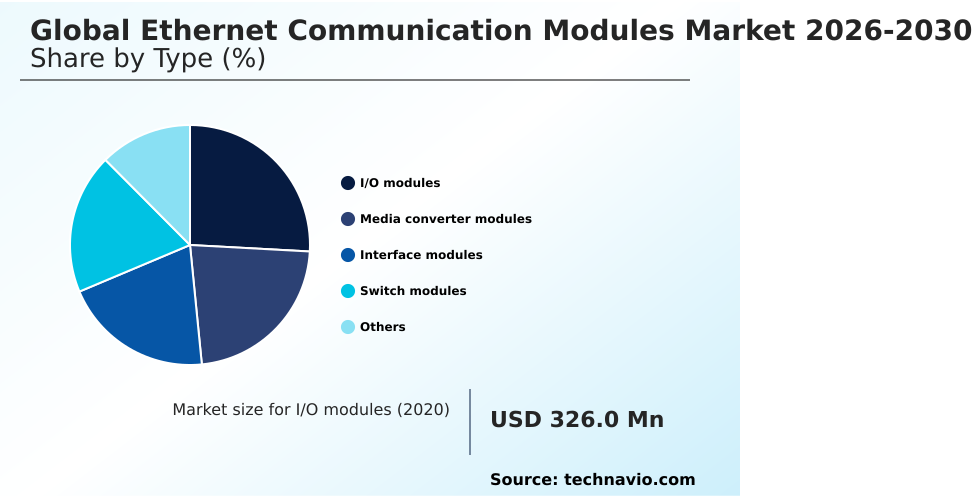
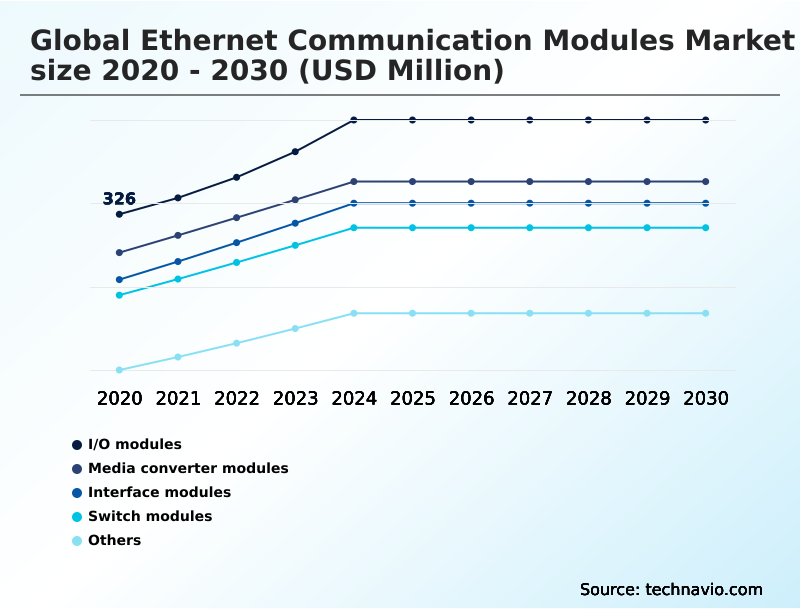
The I/O modules segment was valued at USD 428.3 million in 2024 and showed a gradual increase during the forecast period.
Get Free Sample

Regional Analysis

APAC is estimated to contribute 43.2% to the growth of the global market during the forecast period.Technavio’s analysts have elaborately explained the regional trends and drivers that shape the market during the forecast period.
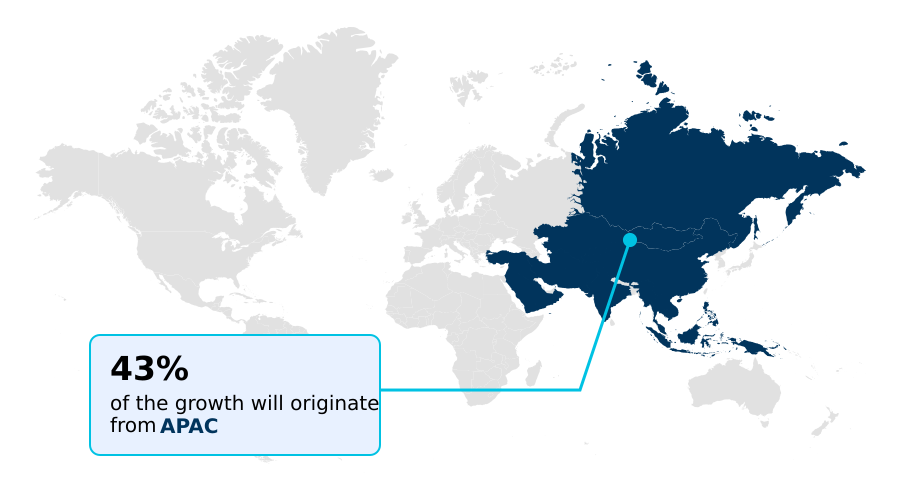
See How Ethernet Communication Modules Market Demand is Rising in APAC Get Free Sample

Regional supply chain dynamics dictate the adoption rates of advanced networking hardware across the Ethernet Communication Modules Market.

The APAC region demonstrates a rapid integration rate, utilizing smart factory automation frameworks to achieve a 28% higher deployment density of communication nodes compared to North America.

This disparity occurs because APAC manufacturers heavily prioritize robotic axis synchronization within their massive automated assembly cells to counteract labor shortages. Conversely, North America focuses on edge computing localized processing, improving diagnostic response times by 18% through decentralized data handling.

The shift toward single pair topology in European automotive plants reduces cabling weight, directly cutting installation labor costs by up to 15%. By leveraging predictive maintenance telemetry, facility operators across these regions drastically minimize unplanned mechanical failures, securing continuous output.

Market Dynamics

Our researchers analyzed the data with 2025 as the base year, along with the key drivers, trends, and challenges. A holistic analysis of drivers will help companies refine their marketing strategies to gain a competitive advantage.

  • Modern industrial environments require highly sophisticated communication architectures to manage vast amounts of operational data without interruption. The implementation of time sensitive deterministic packet routing ensures that critical motion control commands reach their destination with absolute priority, eliminating the microsecond delays that historically caused mechanical misalignment.
  • When compared to legacy standard networking, facilities utilizing these advanced protocols achieve nearly a 40% reduction in automated assembly errors, which directly translates to improved output yield and lower material waste.
  • Furthermore, the transition toward high bandwidth optical media conversion allows plant engineers to extend network reach across vast manufacturing campuses while completely bypassing the electrical noise inherent to heavy machinery operations. Establishing galvanically isolated industrial control connectivity provides a vital safeguard, protecting sensitive central processing units from catastrophic voltage spikes generated by high power equipment.
  • To further optimize physical infrastructure, the adoption of single pair power over data technology minimizes the physical cabling footprint, allowing for faster deployment of sensors in constrained spaces. As facilities continue to decentralize their data analytics, the integration of ruggedized edge computing localized processing enables immediate diagnostic filtering directly at the machine level.
  • This strategy significantly reduces the burden on centralized enterprise networks, streamlining compliance reporting and operational planning across the entire supply chain.

What are the key market drivers leading to the rise in the adoption of Ethernet Communication Modules Industry?

  • Rapid industrial automation combined with the proliferation of smart factory ecosystems serves as the primary catalyst for market expansion. These integrated systems require continuous and high speed data transmission to function effectively.

  • The aggressive expansion of smart grid infrastructure acts as a primary catalyst for upgrading industrial networking hardware. Utility operators demand a high bandwidth backbone to process complex power distribution metrics, which compels the integration of sophisticated communication nodes.
  • Substations retrofitted with these digital interfaces achieve a 40% improvement in load balancing response times, alongside a 25% decrease in localized power failures.
  • This performance surge is driven by sub millisecond latency capabilities that instantly trigger automated safety relays during grid fluctuations. To support this efficiency, innovations in printed circuit fabrication deliver extreme low power consumption across thousands of deployed sensors.
  • The strategic use of power over data line technology paired with redundant power inputs guarantees uninterrupted industrial internet connectivity during critical energy transfers.

What are the market trends shaping the Ethernet Communication Modules Industry?

  • The emergence of single pair ethernet technology acts as a foundational element for advancing industrial internet connectivity. This development significantly streamlines wiring requirements across expansive automated facilities.

  • Advanced diagnostic integration is rapidly replacing standalone sensor networks across heavy industrial environments. This transition occurs as deterministic packet routing guarantees precise delivery times for critical safety commands, preventing system overrides. Manufacturing facilities utilizing these upgraded protocols demonstrate a 30% reduction in unmapped data collisions, while automated warehousing sites show a 22% improvement in continuous operation tracking.
  • Within the automotive sector, the adoption of zonal vehicle architecture consolidates electronic control units, reducing wiring weight by nearly 15%. This structural shift relies heavily on multi rate interoperability to maintain seamless communication across disparate vehicle sensors. Additionally, hyperscale cluster synchronization ensures that complex machine vision bandwidth requirements are met without degrading overall network speed.
  • Implementing rigorous hardware level encryption within din rail mounting modules safeguards these high speed transmissions from external interference.

What challenges does the Ethernet Communication Modules Industry face during its growth?

  • Escalating cybersecurity vulnerabilities paired with the complexities of digital convergence present substantial challenges to overall industry growth. Addressing these risks demands sophisticated hardware level encryption and rigorous operational compliance.

  • Integrating legacy manufacturing equipment with modern digital ecosystems presents severe architectural limitations for facility engineers. Because older machinery lacks native support for software defined networking, operators are forced to deploy complex intermediary hardware, which inadvertently increases data transmission delays by up to 18%. This bottleneck severely restricts network congestion mitigation efforts during peak production hours.
  • Attempting to segment traffic using virtual local area networks often overloads older processing units, causing a 12% drop in overall diagnostic accuracy. Furthermore, establishing parallel redundancy protocols requires extensive packet buffering, which strains the computational limits of standard controllers.
  • Resolving these incompatibilities while maintaining a secure boot cryptographic engine demands highly specialized routing configurations, forcing enterprises to heavily subsidize custom integration labor over rapid spanning tree deployments.

Exclusive Technavio Analysis on Customer Landscape

The ethernet communication modules market forecasting report includes the adoption lifecycle of the market, covering from the innovator’s stage to the laggard’s stage. It focuses on adoption rates in different regions based on penetration. Furthermore, the ethernet communication modules market report also includes key purchase criteria and drivers of price sensitivity to help companies evaluate and develop their market growth analysis strategies.
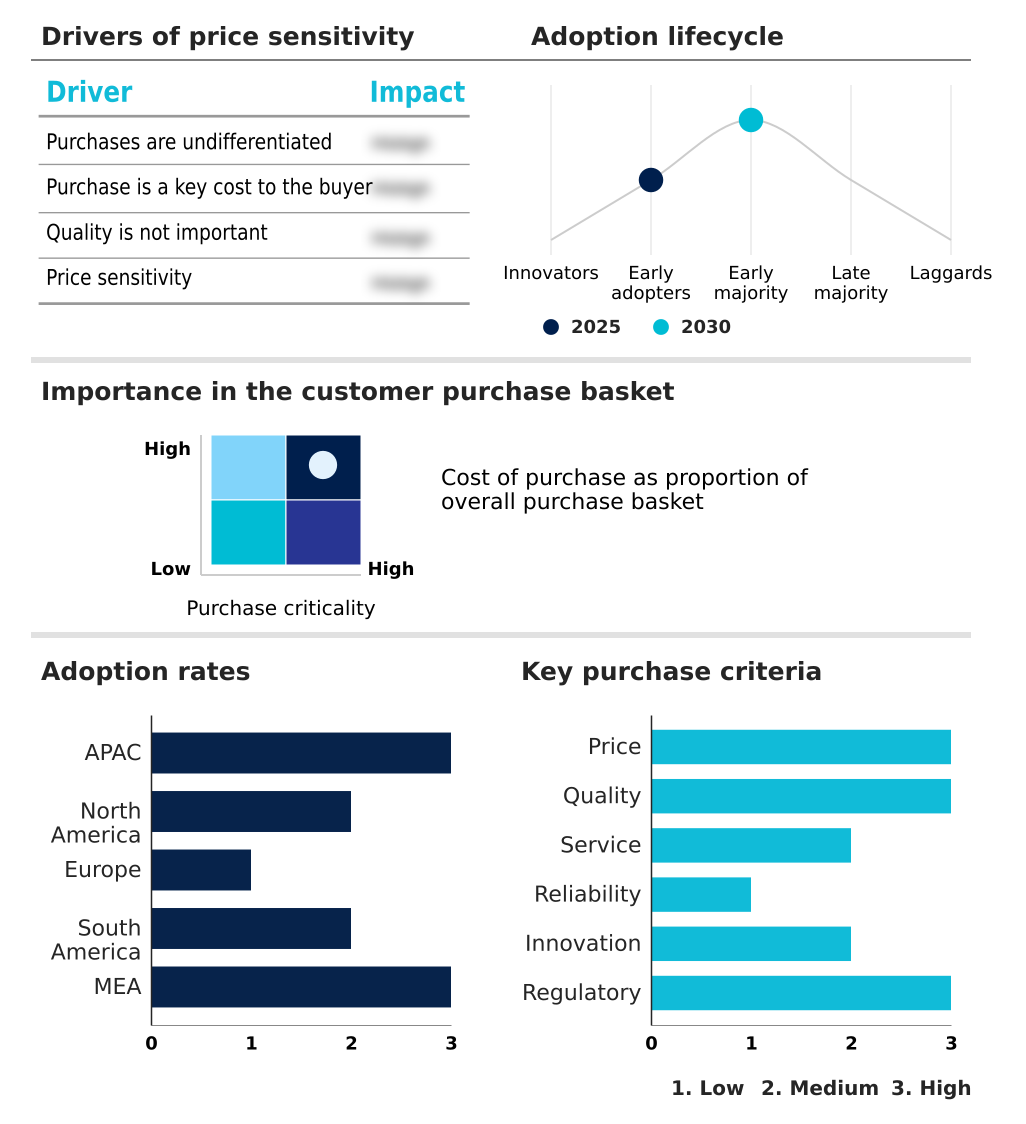
Customer Landscape of Ethernet Communication Modules Industry

Competitive Landscape

Companies are implementing various strategies, such as strategic alliances, ethernet communication modules market forecast, partnerships, mergers and acquisitions, geographical expansion, and product/service launches, to enhance their presence in the industry.

ABB Ltd. - The product portfolio includes standardized hardware interfaces designed to facilitate reliable machine connectivity and seamless protocol integration across complex industrial automation environments.

The industry research and growth report includes detailed analyses of the competitive landscape of the market and information about key companies, including:

  • ABB Ltd.
  • Advantech Co. Ltd.
  • Balluff GmbH
  • Beckhoff Automation GmbH
  • Belden Inc.
  • Digi International Inc.
  • HARTING Technology Group
  • HMS Networks AB
  • Keyence Corp.
  • Lantronix Inc.
  • Microchip Technology Inc.
  • Mitsubishi Electric Corp.
  • Molex LLC
  • Moxa Inc.
  • OMRON Corp.
  • Pepperl and Fuchs SE
  • Rockwell Automation Inc.
  • Schneider Electric SE
  • Siemens AG
  • WAGO GmbH and Co. KG

Qualitative and quantitative analysis of companies has been conducted to help clients understand the wider business environment as well as the strengths and weaknesses of key industry players. Data is qualitatively analyzed to categorize companies as pure play, category-focused, industry-focused, and diversified; it is quantitatively analyzed to categorize companies as dominant, leading, strong, tentative, and weak.

Recent Development and News in Ethernet communication modules market

  • In the Communications Equipment industry, the aggressive rollout of high density 5G infrastructure has mandated ultra low latency backhaul connections, directly impacting Ethernet Communication Modules demand by accelerating the shift toward optical transceivers capable of multi gigabit throughput.
  • In the Communications Equipment industry, stringent data privacy regulations requiring hardware level encryption have shifted manufacturing priorities, directly impacting Ethernet Communication Modules demand by forcing operators to replace legacy unmanaged hardware with secure boot cryptographic engine enabled devices.
  • In the Communications Equipment industry, the widespread adoption of AI infrastructure in hyperscale data centers has created massive bandwidth bottlenecks, directly impacting Ethernet Communication Modules demand by driving the deployment of parallel redundancy protocols to ensure zero failover packet delivery.
  • In the Communications Equipment industry, the transition toward software defined networking architectures has decoupled control planes from physical routing hardware, directly impacting Ethernet Communication Modules demand by increasing the requirement for programmable high bandwidth backbone connections.

Dive into Technavio’s robust research methodology, blending expert interviews, extensive data synthesis, and validated models for unparalleled Ethernet Communication Modules Market insights. See full methodology.

Market Scope
Page number 321
Base year 2025
Historic period 2020-2024
Forecast period 2026-2030
Growth momentum & CAGR Accelerate at a CAGR of 8.5%
Market growth 2026-2030 USD 894.4 million
Market structure Fragmented
YoY growth 2025-2026(%) 7.6%
Key countries China, Japan, South Korea, India, Taiwan, Australia, US, Canada, Mexico, Germany, Italy, France, UK, Spain, The Netherlands, Brazil, Argentina, Chile, Saudi Arabia, UAE, South Africa, Israel and Turkey
Competitive landscape Leading Companies, Market Positioning of Companies, Competitive Strategies, and Industry Risks

Request Free Sample

Research Analyst Overview

  • The continuous evolution of communication hardware fundamentally redefines how industrial enterprises structure their operational technology networks. Boardrooms now prioritize the integration of time sensitive networking protocols to guarantee absolute precision in automated workflows, a strategy that directly minimizes mechanical desynchronization risks.
  • Facilities implementing these advanced routing configurations achieve a 25% reduction in unexpected production halts compared to those utilizing standard asynchronous data links. This reliability is further bolstered by ruggedized enclosure design and electromagnetic interference shielding, which ensure that fiber optic transceivers maintain optimal signal integrity amidst the severe electrical noise of heavy manufacturing.
  • The push for high density switching architectures allows facility planners to maximize data throughput without expanding the physical footprint of their control cabinets. Consequently, optimizing thermal management efficiency within these compact modules has become a critical budgetary consideration, directly influencing hardware lifecycle costs and long term infrastructure planning.
  • This physical layer resilience acts as the core enabler for seamless plant wide automation.

What are the Key Data Covered in this Ethernet Communication Modules Market Research and Growth Report?

  • What is the expected growth of the Ethernet Communication Modules Market between 2026 and 2030?

    • USD 894.4 million, at a CAGR of 8.5%

  • What segmentation does the market report cover?

    • The report is segmented by Type (I/O modules, Media converter modules, Interface modules, Switch modules, and Others), Product Type (8 channels, 16 channels, and Others), Application (Industrial automation, Building automation, Transportation, Energy and utilities, and Others) and Geography (APAC, North America, Europe, South America, Middle East and Africa)

  • Which regions are analyzed in the report?

    • APAC, North America, Europe, South America and Middle East and Africa

  • What are the key growth drivers and market challenges?

    • Industrial automation and proliferation of smart factory ecosystems, Cybersecurity vulnerabilities and complexity of IoT convergence

  • Who are the major players in the Ethernet Communication Modules Market?

    • ABB Ltd., Advantech Co. Ltd., Balluff GmbH, Beckhoff Automation GmbH, Belden Inc., Digi International Inc., HARTING Technology Group, HMS Networks AB, Keyence Corp., Lantronix Inc., Microchip Technology Inc., Mitsubishi Electric Corp., Molex LLC, Moxa Inc., OMRON Corp., Pepperl and Fuchs SE, Rockwell Automation Inc., Schneider Electric SE, Siemens AG and WAGO GmbH and Co. KG

Market Research Insights

  • The Ethernet Communication Modules Market enables sophisticated industrial frameworks by providing reliable data pathways across demanding operational environments. Facilities upgrading from traditional architectures report a 35% improvement in network congestion mitigation, largely due to superior packet management capabilities.
  • Furthermore, the integration of seamless media conversion between optical and copper pathways has increased transmission distance viability by up to 50% in expansive mining operations. As legacy fieldbus obsolescence accelerates, enterprises replace outdated systems with high capacity digital modules to streamline complex diagnostics.
  • Harsh environment deployment remains highly effective, ensuring that mission critical data flows uninterrupted despite severe thermal or electrical interference on the factory floor.

We can help! Our analysts can customize this ethernet communication modules market research report to meet your requirements.

Get in touch

1. Executive Summary

1.1 Market overview

Executive Summary - Chart on Market Overview
Executive Summary - Data Table on Market Overview
Executive Summary - Chart on Global Market Characteristics
Executive Summary - Chart on Market by Geography
Executive Summary - Chart on Market Segmentation by Type
Executive Summary - Chart on Market Segmentation by Product Type
Executive Summary - Chart on Market Segmentation by Application
Executive Summary - Chart on Incremental Growth
Executive Summary - Data Table on Incremental Growth
Executive Summary - Chart on Company Market Positioning

2. Technavio Analysis

2.1 Analysis of price sensitivity, lifecycle, customer purchase basket, adoption rates, and purchase criteria

2.2 Criticality of inputs and Factors of differentiation

Chart on Overview on criticality of inputs and factors of differentiation

2.3 Factors of disruption

Chart on Overview on factors of disruption

2.4 Impact of drivers and challenges

Chart on Impact of drivers and challenges in 2025 and 2030

3. Market Landscape

3.1 Market ecosystem

Chart on Parent Market
Data Table on - Parent Market

3.2 Market characteristics

Chart on Market characteristics analysis

3.3 Value chain analysis

Chart on Value chain analysis

4. Market Sizing

4.1 Market definition

Data Table on Offerings of companies included in the market definition

4.2 Market segment analysis

Market segments

4.3 Market size 2025

4.4 Market outlook: Forecast for 2025-2030

Chart on Global - Market size and forecast 2025-2030 ($ million)
Data Table on Global - Market size and forecast 2025-2030 ($ million)
Chart on Global Market: Year-over-year growth 2025-2030 (%)
Data Table on Global Market: Year-over-year growth 2025-2030 (%)

5. Historic Market Size

5.1 Global Ethernet Communication Modules Market 2020 - 2024

Historic Market Size - Data Table on Global Ethernet Communication Modules Market 2020 - 2024 ($ million)

5.2 Type segment analysis 2020 - 2024

Historic Market Size - Type Segment 2020 - 2024 ($ million)

5.3 Product Type segment analysis 2020 - 2024

Historic Market Size - Product Type Segment 2020 - 2024 ($ million)

5.4 Application segment analysis 2020 - 2024

Historic Market Size - Application Segment 2020 - 2024 ($ million)

5.5 Geography segment analysis 2020 - 2024

Historic Market Size - Geography Segment 2020 - 2024 ($ million)

5.6 Country segment analysis 2020 - 2024

Historic Market Size - Country Segment 2020 - 2024 ($ million)

6. Qualitative Analysis

6.1 Impact of AI on Global Ethernet Communication Modules Market

6.2 Impact of geopolitical conflicts on Global Ethernet Communication Modules Market

7. Five Forces Analysis

7.1 Five forces summary

Five forces analysis - Comparison between 2025 and 2030

7.2 Bargaining power of buyers

Bargaining power of buyers - Impact of key factors 2025 and 2030

7.3 Bargaining power of suppliers

Bargaining power of suppliers - Impact of key factors in 2025 and 2030

7.4 Threat of new entrants

Threat of new entrants - Impact of key factors in 2025 and 2030

7.5 Threat of substitutes

Threat of substitutes - Impact of key factors in 2025 and 2030

7.6 Threat of rivalry

Threat of rivalry - Impact of key factors in 2025 and 2030

7.7 Market condition

Chart on Market condition - Five forces 2025 and 2030

8. Market Segmentation by Type

8.1 Market segments

Chart on Type - Market share 2025-2030 (%)
Data Table on Type - Market share 2025-2030 (%)

8.2 Comparison by Type

Chart on Comparison by Type
Data Table on Comparison by Type

8.3 I/O modules - Market size and forecast 2025-2030

Chart on I/O modules - Market size and forecast 2025-2030 ($ million)
Data Table on I/O modules - Market size and forecast 2025-2030 ($ million)
Chart on I/O modules - Year-over-year growth 2025-2030 (%)
Data Table on I/O modules - Year-over-year growth 2025-2030 (%)

8.4 Media converter modules - Market size and forecast 2025-2030

Chart on Media converter modules - Market size and forecast 2025-2030 ($ million)
Data Table on Media converter modules - Market size and forecast 2025-2030 ($ million)
Chart on Media converter modules - Year-over-year growth 2025-2030 (%)
Data Table on Media converter modules - Year-over-year growth 2025-2030 (%)

8.5 Interface modules - Market size and forecast 2025-2030

Chart on Interface modules - Market size and forecast 2025-2030 ($ million)
Data Table on Interface modules - Market size and forecast 2025-2030 ($ million)
Chart on Interface modules - Year-over-year growth 2025-2030 (%)
Data Table on Interface modules - Year-over-year growth 2025-2030 (%)

8.6 Switch modules - Market size and forecast 2025-2030

Chart on Switch modules - Market size and forecast 2025-2030 ($ million)
Data Table on Switch modules - Market size and forecast 2025-2030 ($ million)
Chart on Switch modules - Year-over-year growth 2025-2030 (%)
Data Table on Switch modules - Year-over-year growth 2025-2030 (%)

8.7 Others - Market size and forecast 2025-2030

Chart on Others - Market size and forecast 2025-2030 ($ million)
Data Table on Others - Market size and forecast 2025-2030 ($ million)
Chart on Others - Year-over-year growth 2025-2030 (%)
Data Table on Others - Year-over-year growth 2025-2030 (%)

8.8 Market opportunity by Type

Market opportunity by Type ($ million)
Data Table on Market opportunity by Type ($ million)

9. Market Segmentation by Product Type

9.1 Market segments

Chart on Product Type - Market share 2025-2030 (%)
Data Table on Product Type - Market share 2025-2030 (%)

9.2 Comparison by Product Type

Chart on Comparison by Product Type
Data Table on Comparison by Product Type

9.3 8 channels - Market size and forecast 2025-2030

Chart on 8 channels - Market size and forecast 2025-2030 ($ million)
Data Table on 8 channels - Market size and forecast 2025-2030 ($ million)
Chart on 8 channels - Year-over-year growth 2025-2030 (%)
Data Table on 8 channels - Year-over-year growth 2025-2030 (%)

9.4 16 channels - Market size and forecast 2025-2030

Chart on 16 channels - Market size and forecast 2025-2030 ($ million)
Data Table on 16 channels - Market size and forecast 2025-2030 ($ million)
Chart on 16 channels - Year-over-year growth 2025-2030 (%)
Data Table on 16 channels - Year-over-year growth 2025-2030 (%)

9.5 Others - Market size and forecast 2025-2030

Chart on Others - Market size and forecast 2025-2030 ($ million)
Data Table on Others - Market size and forecast 2025-2030 ($ million)
Chart on Others - Year-over-year growth 2025-2030 (%)
Data Table on Others - Year-over-year growth 2025-2030 (%)

9.6 Market opportunity by Product Type

Market opportunity by Product Type ($ million)
Data Table on Market opportunity by Product Type ($ million)

10. Market Segmentation by Application

10.1 Market segments

Chart on Application - Market share 2025-2030 (%)
Data Table on Application - Market share 2025-2030 (%)

10.2 Comparison by Application

Chart on Comparison by Application
Data Table on Comparison by Application

10.3 Industrial automation - Market size and forecast 2025-2030

Chart on Industrial automation - Market size and forecast 2025-2030 ($ million)
Data Table on Industrial automation - Market size and forecast 2025-2030 ($ million)
Chart on Industrial automation - Year-over-year growth 2025-2030 (%)
Data Table on Industrial automation - Year-over-year growth 2025-2030 (%)

10.4 Building automation - Market size and forecast 2025-2030

Chart on Building automation - Market size and forecast 2025-2030 ($ million)
Data Table on Building automation - Market size and forecast 2025-2030 ($ million)
Chart on Building automation - Year-over-year growth 2025-2030 (%)
Data Table on Building automation - Year-over-year growth 2025-2030 (%)

10.5 Transportation - Market size and forecast 2025-2030

Chart on Transportation - Market size and forecast 2025-2030 ($ million)
Data Table on Transportation - Market size and forecast 2025-2030 ($ million)
Chart on Transportation - Year-over-year growth 2025-2030 (%)
Data Table on Transportation - Year-over-year growth 2025-2030 (%)

10.6 Energy and utilities - Market size and forecast 2025-2030

Chart on Energy and utilities - Market size and forecast 2025-2030 ($ million)
Data Table on Energy and utilities - Market size and forecast 2025-2030 ($ million)
Chart on Energy and utilities - Year-over-year growth 2025-2030 (%)
Data Table on Energy and utilities - Year-over-year growth 2025-2030 (%)

10.7 Others - Market size and forecast 2025-2030

Chart on Others - Market size and forecast 2025-2030 ($ million)
Data Table on Others - Market size and forecast 2025-2030 ($ million)
Chart on Others - Year-over-year growth 2025-2030 (%)
Data Table on Others - Year-over-year growth 2025-2030 (%)

10.8 Market opportunity by Application

Market opportunity by Application ($ million)
Data Table on Market opportunity by Application ($ million)

11. Customer Landscape

11.1 Customer landscape overview

Analysis of price sensitivity, lifecycle, customer purchase basket, adoption rates, and purchase criteria

12. Geographic Landscape

12.1 Geographic segmentation

Chart on Market share by geography 2025-2030 (%)
Data Table on Market share by geography 2025-2030 (%)

12.2 Geographic comparison

Chart on Geographic comparison
Data Table on Geographic comparison

12.3 APAC - Market size and forecast 2025-2030

Chart on APAC - Market size and forecast 2025-2030 ($ million)
Data Table on APAC - Market size and forecast 2025-2030 ($ million)
Chart on APAC - Year-over-year growth 2025-2030 (%)
Data Table on APAC - Year-over-year growth 2025-2030 (%)
Chart on Regional Comparison - APAC
Data Table on Regional Comparison - APAC

12.3.1 China - Market size and forecast 2025-2030

Chart on China - Market size and forecast 2025-2030 ($ million)
Data Table on China - Market size and forecast 2025-2030 ($ million)
Chart on China - Year-over-year growth 2025-2030 (%)
Data Table on China - Year-over-year growth 2025-2030 (%)

12.3.2 Japan - Market size and forecast 2025-2030

Chart on Japan - Market size and forecast 2025-2030 ($ million)
Data Table on Japan - Market size and forecast 2025-2030 ($ million)
Chart on Japan - Year-over-year growth 2025-2030 (%)
Data Table on Japan - Year-over-year growth 2025-2030 (%)

12.3.3 South Korea - Market size and forecast 2025-2030

Chart on South Korea - Market size and forecast 2025-2030 ($ million)
Data Table on South Korea - Market size and forecast 2025-2030 ($ million)
Chart on South Korea - Year-over-year growth 2025-2030 (%)
Data Table on South Korea - Year-over-year growth 2025-2030 (%)

12.3.4 India - Market size and forecast 2025-2030

Chart on India - Market size and forecast 2025-2030 ($ million)
Data Table on India - Market size and forecast 2025-2030 ($ million)
Chart on India - Year-over-year growth 2025-2030 (%)
Data Table on India - Year-over-year growth 2025-2030 (%)

12.3.5 Taiwan - Market size and forecast 2025-2030

Chart on Taiwan - Market size and forecast 2025-2030 ($ million)
Data Table on Taiwan - Market size and forecast 2025-2030 ($ million)
Chart on Taiwan - Year-over-year growth 2025-2030 (%)
Data Table on Taiwan - Year-over-year growth 2025-2030 (%)

12.3.6 Australia - Market size and forecast 2025-2030

Chart on Australia - Market size and forecast 2025-2030 ($ million)
Data Table on Australia - Market size and forecast 2025-2030 ($ million)
Chart on Australia - Year-over-year growth 2025-2030 (%)
Data Table on Australia - Year-over-year growth 2025-2030 (%)

12.4 North America - Market size and forecast 2025-2030

Chart on North America - Market size and forecast 2025-2030 ($ million)
Data Table on North America - Market size and forecast 2025-2030 ($ million)
Chart on North America - Year-over-year growth 2025-2030 (%)
Data Table on North America - Year-over-year growth 2025-2030 (%)
Chart on Regional Comparison - North America
Data Table on Regional Comparison - North America

12.4.1 US - Market size and forecast 2025-2030

Chart on US - Market size and forecast 2025-2030 ($ million)
Data Table on US - Market size and forecast 2025-2030 ($ million)
Chart on US - Year-over-year growth 2025-2030 (%)
Data Table on US - Year-over-year growth 2025-2030 (%)

12.4.2 Canada - Market size and forecast 2025-2030

Chart on Canada - Market size and forecast 2025-2030 ($ million)
Data Table on Canada - Market size and forecast 2025-2030 ($ million)
Chart on Canada - Year-over-year growth 2025-2030 (%)
Data Table on Canada - Year-over-year growth 2025-2030 (%)

12.4.3 Mexico - Market size and forecast 2025-2030

Chart on Mexico - Market size and forecast 2025-2030 ($ million)
Data Table on Mexico - Market size and forecast 2025-2030 ($ million)
Chart on Mexico - Year-over-year growth 2025-2030 (%)
Data Table on Mexico - Year-over-year growth 2025-2030 (%)

12.5 Europe - Market size and forecast 2025-2030

Chart on Europe - Market size and forecast 2025-2030 ($ million)
Data Table on Europe - Market size and forecast 2025-2030 ($ million)
Chart on Europe - Year-over-year growth 2025-2030 (%)
Data Table on Europe - Year-over-year growth 2025-2030 (%)
Chart on Regional Comparison - Europe
Data Table on Regional Comparison - Europe

12.5.1 Germany - Market size and forecast 2025-2030

Chart on Germany - Market size and forecast 2025-2030 ($ million)
Data Table on Germany - Market size and forecast 2025-2030 ($ million)
Chart on Germany - Year-over-year growth 2025-2030 (%)
Data Table on Germany - Year-over-year growth 2025-2030 (%)

12.5.2 Italy - Market size and forecast 2025-2030

Chart on Italy - Market size and forecast 2025-2030 ($ million)
Data Table on Italy - Market size and forecast 2025-2030 ($ million)
Chart on Italy - Year-over-year growth 2025-2030 (%)
Data Table on Italy - Year-over-year growth 2025-2030 (%)

12.5.3 France - Market size and forecast 2025-2030

Chart on France - Market size and forecast 2025-2030 ($ million)
Data Table on France - Market size and forecast 2025-2030 ($ million)
Chart on France - Year-over-year growth 2025-2030 (%)
Data Table on France - Year-over-year growth 2025-2030 (%)

12.5.4 UK - Market size and forecast 2025-2030

Chart on UK - Market size and forecast 2025-2030 ($ million)
Data Table on UK - Market size and forecast 2025-2030 ($ million)
Chart on UK - Year-over-year growth 2025-2030 (%)
Data Table on UK - Year-over-year growth 2025-2030 (%)

12.5.5 Spain - Market size and forecast 2025-2030

Chart on Spain - Market size and forecast 2025-2030 ($ million)
Data Table on Spain - Market size and forecast 2025-2030 ($ million)
Chart on Spain - Year-over-year growth 2025-2030 (%)
Data Table on Spain - Year-over-year growth 2025-2030 (%)

12.5.6 The Netherlands - Market size and forecast 2025-2030

Chart on The Netherlands - Market size and forecast 2025-2030 ($ million)
Data Table on The Netherlands - Market size and forecast 2025-2030 ($ million)
Chart on The Netherlands - Year-over-year growth 2025-2030 (%)
Data Table on The Netherlands - Year-over-year growth 2025-2030 (%)

12.6 South America - Market size and forecast 2025-2030

Chart on South America - Market size and forecast 2025-2030 ($ million)
Data Table on South America - Market size and forecast 2025-2030 ($ million)
Chart on South America - Year-over-year growth 2025-2030 (%)
Data Table on South America - Year-over-year growth 2025-2030 (%)
Chart on Regional Comparison - South America
Data Table on Regional Comparison - South America

12.6.1 Brazil - Market size and forecast 2025-2030

Chart on Brazil - Market size and forecast 2025-2030 ($ million)
Data Table on Brazil - Market size and forecast 2025-2030 ($ million)
Chart on Brazil - Year-over-year growth 2025-2030 (%)
Data Table on Brazil - Year-over-year growth 2025-2030 (%)

12.6.2 Argentina - Market size and forecast 2025-2030

Chart on Argentina - Market size and forecast 2025-2030 ($ million)
Data Table on Argentina - Market size and forecast 2025-2030 ($ million)
Chart on Argentina - Year-over-year growth 2025-2030 (%)
Data Table on Argentina - Year-over-year growth 2025-2030 (%)

12.6.3 Chile - Market size and forecast 2025-2030

Chart on Chile - Market size and forecast 2025-2030 ($ million)
Data Table on Chile - Market size and forecast 2025-2030 ($ million)
Chart on Chile - Year-over-year growth 2025-2030 (%)
Data Table on Chile - Year-over-year growth 2025-2030 (%)

12.7 Middle East and Africa - Market size and forecast 2025-2030

Chart on Middle East and Africa - Market size and forecast 2025-2030 ($ million)
Data Table on Middle East and Africa - Market size and forecast 2025-2030 ($ million)
Chart on Middle East and Africa - Year-over-year growth 2025-2030 (%)
Data Table on Middle East and Africa - Year-over-year growth 2025-2030 (%)
Chart on Regional Comparison - Middle East and Africa
Data Table on Regional Comparison - Middle East and Africa

12.7.1 Saudi Arabia - Market size and forecast 2025-2030

Chart on Saudi Arabia - Market size and forecast 2025-2030 ($ million)
Data Table on Saudi Arabia - Market size and forecast 2025-2030 ($ million)
Chart on Saudi Arabia - Year-over-year growth 2025-2030 (%)
Data Table on Saudi Arabia - Year-over-year growth 2025-2030 (%)

12.7.2 UAE - Market size and forecast 2025-2030

Chart on UAE - Market size and forecast 2025-2030 ($ million)
Data Table on UAE - Market size and forecast 2025-2030 ($ million)
Chart on UAE - Year-over-year growth 2025-2030 (%)
Data Table on UAE - Year-over-year growth 2025-2030 (%)

12.7.3 South Africa - Market size and forecast 2025-2030

Chart on South Africa - Market size and forecast 2025-2030 ($ million)
Data Table on South Africa - Market size and forecast 2025-2030 ($ million)
Chart on South Africa - Year-over-year growth 2025-2030 (%)
Data Table on South Africa - Year-over-year growth 2025-2030 (%)

12.7.4 Israel - Market size and forecast 2025-2030

Chart on Israel - Market size and forecast 2025-2030 ($ million)
Data Table on Israel - Market size and forecast 2025-2030 ($ million)
Chart on Israel - Year-over-year growth 2025-2030 (%)
Data Table on Israel - Year-over-year growth 2025-2030 (%)

12.7.5 Turkey - Market size and forecast 2025-2030

Chart on Turkey - Market size and forecast 2025-2030 ($ million)
Data Table on Turkey - Market size and forecast 2025-2030 ($ million)
Chart on Turkey - Year-over-year growth 2025-2030 (%)
Data Table on Turkey - Year-over-year growth 2025-2030 (%)

12.8 Market opportunity by geography

Market opportunity by geography ($ million)
Data Tables on Market opportunity by geography ($ million)

13. Drivers, Challenges, and Opportunity

13.1 Market drivers

Industrial automation and proliferation of smart factory ecosystems
Surge in hyperscale data center construction and AI requirements
Transformation of automotive architecture toward software-defined networking

13.2 Market challenges

Cybersecurity vulnerabilities and complexity of IoT convergence
Technical interoperability constraints and absence of unified global standards
Supply chain volatility and rising cost of high-frequency semiconductor components

13.3 Impact of drivers and challenges

Impact of drivers and challenges in 2025 and 2030

13.4 Market opportunities

Emergence of single pair ethernet as foundation for industrial IoT connectivity
Rapid proliferation of high-bandwidth modules driven by AI and edge computing
Integration of advanced power over ethernet capabilities in smart infrastructure and urban development

14. Competitive Landscape

14.1 Overview

14.2

Overview on criticality of inputs and factors of differentiation

14.3 Landscape disruption

Overview on factors of disruption

14.4 Industry risks

Impact of key risks on business

15. Competitive Analysis

15.1 Companies profiled

Companies covered

15.2 Company ranking index

15.3 Market positioning of companies

Matrix on companies position and classification

15.4 ABB Ltd.

ABB Ltd. - Overview
ABB Ltd. - Business segments
ABB Ltd. - Key news
ABB Ltd. - Key offerings
ABB Ltd. - Segment focus
SWOT

15.5 Advantech Co. Ltd.

Advantech Co. Ltd. - Overview
Advantech Co. Ltd. - Business segments
Advantech Co. Ltd. - Key offerings
Advantech Co. Ltd. - Segment focus
SWOT

15.6 Balluff GmbH

Balluff GmbH - Overview
Balluff GmbH - Product / Service
Balluff GmbH - Key offerings
SWOT

15.7 Beckhoff Automation GmbH

Beckhoff Automation GmbH - Overview
Beckhoff Automation GmbH - Product / Service
Beckhoff Automation GmbH - Key offerings
SWOT

15.8 Belden Inc.

Belden Inc. - Overview
Belden Inc. - Business segments
Belden Inc. - Key news
Belden Inc. - Key offerings
Belden Inc. - Segment focus
SWOT

15.9 Digi International Inc.

Digi International Inc. - Overview
Digi International Inc. - Business segments
Digi International Inc. - Key news
Digi International Inc. - Key offerings
Digi International Inc. - Segment focus
SWOT

15.10 HMS Networks AB

HMS Networks AB - Overview
HMS Networks AB - Product / Service
HMS Networks AB - Key offerings
SWOT

15.11 Keyence Corp.

Keyence Corp. - Overview
Keyence Corp. - Product / Service
Keyence Corp. - Key offerings
SWOT

15.12 Lantronix Inc.

Lantronix Inc. - Overview
Lantronix Inc. - Product / Service
Lantronix Inc. - Key offerings
SWOT

15.13 Microchip Technology Inc.

Microchip Technology Inc. - Overview
Microchip Technology Inc. - Business segments
Microchip Technology Inc. - Key offerings
Microchip Technology Inc. - Segment focus
SWOT

15.14 Mitsubishi Electric Corp.

Mitsubishi Electric Corp. - Overview
Mitsubishi Electric Corp. - Business segments
Mitsubishi Electric Corp. - Key offerings
Mitsubishi Electric Corp. - Segment focus
SWOT

15.15 OMRON Corp.

OMRON Corp. - Overview
OMRON Corp. - Business segments
OMRON Corp. - Key offerings
OMRON Corp. - Segment focus
SWOT

15.16 Rockwell Automation Inc.

Rockwell Automation Inc. - Overview
Rockwell Automation Inc. - Business segments
Rockwell Automation Inc. - Key news
Rockwell Automation Inc. - Key offerings
Rockwell Automation Inc. - Segment focus
SWOT

15.17 Schneider Electric SE

Schneider Electric SE - Overview
Schneider Electric SE - Business segments
Schneider Electric SE - Key offerings
Schneider Electric SE - Segment focus
SWOT

15.18 Siemens AG

Siemens AG - Overview
Siemens AG - Business segments
Siemens AG - Key news
Siemens AG - Key offerings
Siemens AG - Segment focus
SWOT

16. Appendix

16.1 Scope of the report

Market definition
Objectives
Notes and caveats

16.2 Inclusions and exclusions checklist

Inclusions checklist
Exclusions checklist

16.3 Currency conversion rates for US$

16.4 Research methodology

16.5 Data procurement

Information sources

16.6 Data validation

16.7 Validation techniques employed for market sizing

16.8 Data synthesis

16.9 360 degree market analysis

16.10 List of abbreviations

Research Methodology

Technavio presents a detailed picture of the market by way of study, synthesis, and summation of data from multiple sources. The analysts have presented the various facets of the market with a particular focus on identifying the key industry influencers. The data thus presented is comprehensive, reliable, and the result of extensive research, both primary and secondary.

INFORMATION SOURCES

Primary sources

  • Manufacturers and suppliers
  • Channel partners
  • Industry experts
  • Strategic decision makers

Secondary sources

  • Industry journals and periodicals
  • Government data
  • Financial reports of key industry players
  • Historical data
  • Press releases

DATA ANALYSIS

Data Synthesis

  • Collation of data
  • Estimation of key figures
  • Analysis of derived insights

Data Validation

  • Triangulation with data models
  • Reference against proprietary databases
  • Corroboration with industry experts

REPORT WRITING

Qualitative

  • Market drivers
  • Market challenges
  • Market trends
  • Five forces analysis

Quantitative

  • Market size and forecast
  • Market segmentation
  • Geographical insights
  • Competitive landscape

Interested in this report?

Get your sample now to see our research methodology and insights!

Download Now

Frequently Asked Questions

Ethernet Communication Modules market growth will increase by USD 894.4 million during 2026-2030.

The Ethernet Communication Modules market is expected to grow at a CAGR of 8.5% during 2026-2030.

Ethernet Communication Modules market is segmented by Type (I/O modules, Media converter modules, Interface modules, Switch modules, Others) Product type (8 channels, 16 channels, Others) Application (Industrial automation, Building automation, Transportation, Energy and utilities, Others)

ABB Ltd., Advantech Co. Ltd., Balluff GmbH, Beckhoff Automation GmbH, Belden Inc., Digi International Inc., HARTING Technology Group, HMS Networks AB, Keyence Corp., Lantronix Inc., Microchip Technology Inc., Mitsubishi Electric Corp., Molex LLC, Moxa Inc., OMRON Corp., Pepperl and Fuchs SE, Rockwell Automation Inc., Schneider Electric SE, Siemens AG, WAGO GmbH and Co. KG are a few of the key vendors in the Ethernet Communication Modules market.

APAC will register the highest growth rate of 43.2% among the other regions. Therefore, the Ethernet Communication Modules market in APAC is expected to garner significant business opportunities for the vendors during the forecast period.

China, Japan, South Korea, India, Taiwan, Australia, US, Canada, Mexico, Germany, Italy, France, UK, Spain, The Netherlands, Brazil, Argentina, Chile, Saudi Arabia, UAE, South Africa, Israel, Turkey

  • Industrial automation and proliferation of smart factory ecosystems is the driving factor this market.

The Ethernet Communication Modules market vendors should focus on grabbing business opportunities from the Type segment as it accounted for the largest market share in the base year.
RIA - Research AI Assistant
Ask RIA
