Exosome Therapeutics Market Analysis, Size, and Forecast 2026-2030: North America (US, Canada, and Mexico), Europe (Germany, UK, and France), APAC (China, Japan, and India), South America (Brazil, Argentina, and Colombia), Middle East and Africa (Saudi Arabia, South Africa, and UAE), Asia, Rest of World (ROW)

Exosome Therapeutics Market Analysis, Size, and Forecast 2026-2030:
North America (US, Canada, and Mexico), Europe (Germany, UK, and France), APAC (China, Japan, and India), South America (Brazil, Argentina, and Colombia), Middle East and Africa (Saudi Arabia, South Africa, and UAE), Asia, Rest of World (ROW)

Published: Dec 2025 284 Pages SKU: IRTNTR80112

Market Overview at a Glance

$408.62 Mn
Market Opportunity
19.6%
CAGR 2025 - 2030
29.7%
North America Growth
$144.97 Mn
Cancer therapies segment 2024

Exosome Therapeutics Market Size 2026-2030

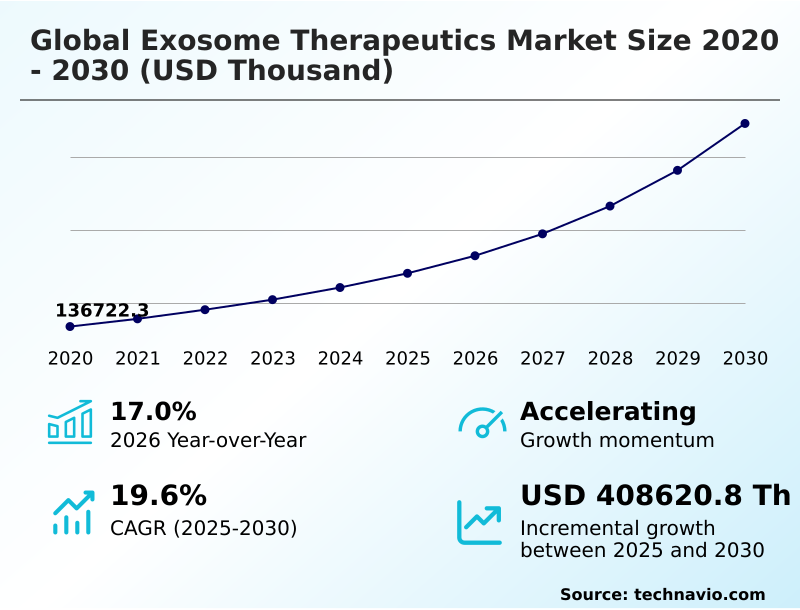
The exosome therapeutics market size is valued to increase by USD 408.62 million, at a CAGR of 19.6% from 2025 to 2030. Increasingly sophisticated and scalable manufacturing technologies will drive the exosome therapeutics market.

Major Market Trends & Insights

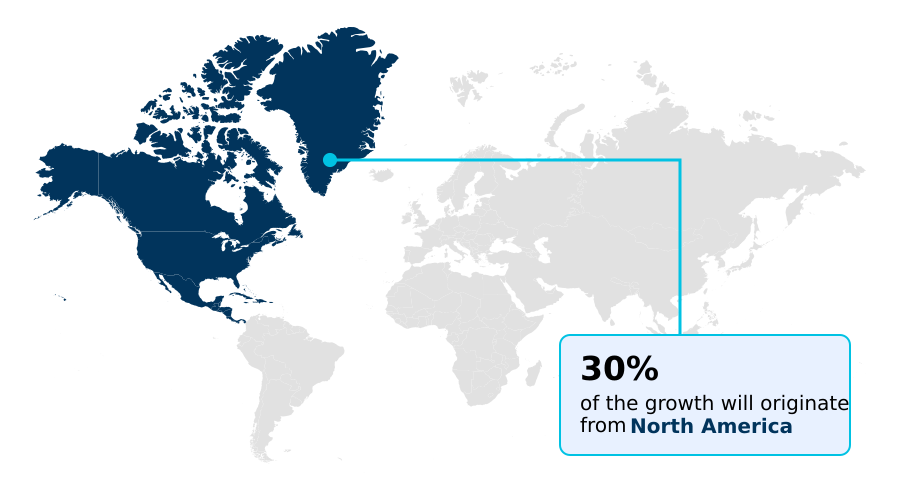
  • North America dominated the market and accounted for a 29.7% growth during the forecast period.
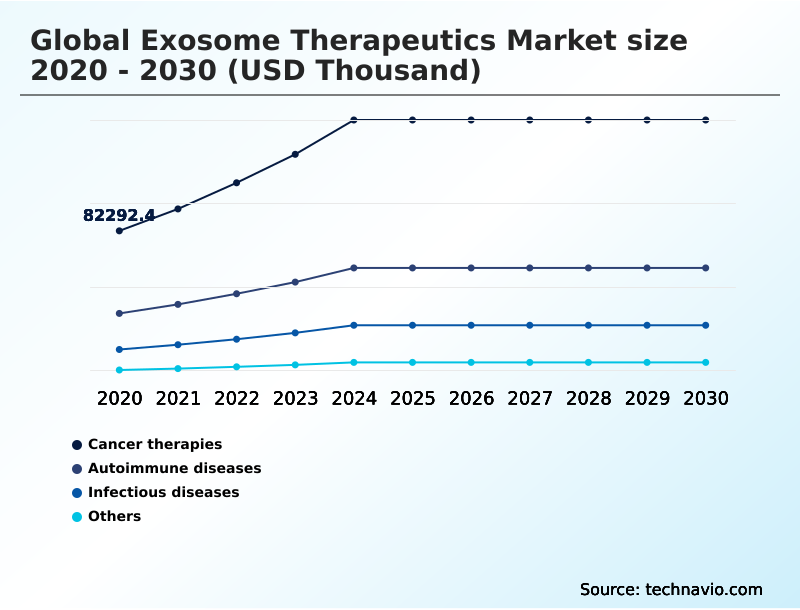
  • By Application - Cancer therapies segment was valued at USD 144.97 million in 2024
  • By Distribution Channel - Hospital pharmacy segment accounted for the largest market revenue share in 2024

Market Size & Forecast

  • Market Opportunities:
  • Market Future Opportunities: USD 408.62 million
  • CAGR from 2025 to 2030 : 19.6%

Market Summary

  • The exosome therapeutics market is undergoing a significant transformation, moving beyond academic research toward clinical and commercial viability. This shift is centered on harnessing the natural intercellular communication capabilities of these vesicles for therapeutic purposes. Key progress is seen in the clinical pipeline expansion and the development of exosome-based vaccines.
  • For instance, a biotech firm navigating the path to commercialization must decide between building in-house gmp manufacturing of exosomes capabilities or partnering with an exosome contract manufacturing organization. This decision directly impacts capital expenditure and speed to market, with outsourced partnerships often reducing time-to-clinic by up to 25%.
  • While the promise of cell-free therapy is immense, particularly for regenerative medicine and rna-based therapies, the industry must address persistent challenges. These include establishing robust exosome isolation techniques and meeting the stringent requirements for an investigational new drug application and eventual biologics license application.
  • The evolution from research-grade to clinical-grade production is a critical hurdle, defining the pace of market adoption and the successful translation of nanovesicle drug delivery platforms into approved treatments for patients.

What will be the Size of the Exosome Therapeutics Market during the forecast period?

Get Key Insights on Market Forecast (PDF) Request Free Sample

How is the Exosome Therapeutics Market Segmented?

The exosome therapeutics industry research report provides comprehensive data (region-wise segment analysis), with forecasts and estimates in "USD thousand" for the period 2026-2030, as well as historical data from 2020-2024 for the following segments.

  • Application
    • Cancer therapies
    • Autoimmune diseases
    • Infectious diseases
    • Others
  • Distribution channel
    • Hospital pharmacy
    • Retail pharmacy
    • Online pharmacy
  • Type
    • Allogeneic
    • Autologous
  • Geography
    • North America
      • US
      • Canada
      • Mexico
    • Europe
      • Germany
      • UK
      • France
    • Asia
    • Rest of World (ROW)

By Application Insights

The cancer therapies segment is estimated to witness significant growth during the forecast period.

The cancer therapies segment is a central pillar of the exosome therapeutics market, where these vesicles are critical in both disease progression and as a treatment modality.

The focus on targeted drug delivery is paramount, utilizing exosome engineering to create vehicles for therapeutic payload delivery to tumor sites, which enhances efficacy. Innovations in allogeneic vs autologous exosomes approaches are defining personalized medicine strategies.

Leveraging their immunomodulatory properties for oncology applications is a key research area, particularly for exosome-based treatment for cancer.

Advancements in exosome purification methods are improving yields by over 25% compared to legacy techniques, enabling more robust biomarker discovery and development of extracellular vesicle therapeutics for this application, including for exosomes in neurodegenerative diseases.

Request Free Sample

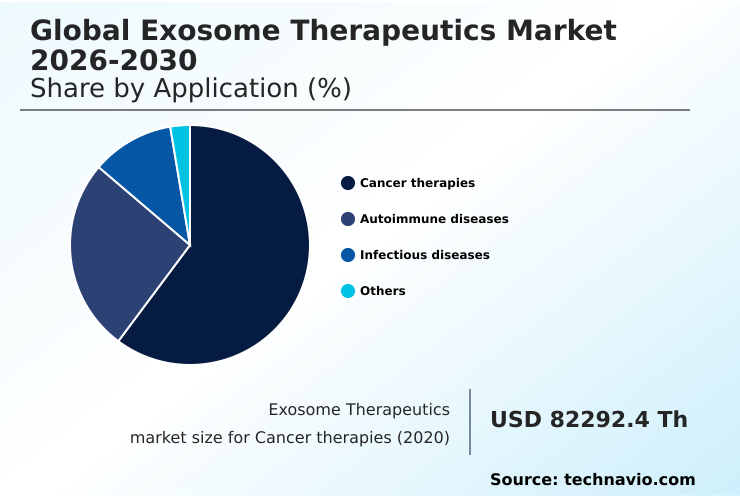
The Cancer therapies segment was valued at USD 144.97 million in 2024 and showed a gradual increase during the forecast period.

Request Free Sample

Regional Analysis

North America is estimated to contribute 29.7% to the growth of the global market during the forecast period.Technavio’s analysts have elaborately explained the regional trends and drivers that shape the market during the forecast period.

See How Exosome Therapeutics Market Demand is Rising in North America Request Free Sample

The geographic landscape of the exosome therapeutics market is led by North America, which is projected to account for nearly 30% of the incremental growth, closely followed by Europe at just over 26%.

This dominance is driven by a robust R&D ecosystem and significant venture capital funding. In Europe, collaborative research is advancing the use of mesenchymal stem cell exosomes and anti-inflammatory exosomes.

Asia is the fastest-growing region, with countries like South Korea and Japan making significant strides in both regulatory approvals and exosome cGMP guidelines for exosome cargo engineering.

This regional growth is fueled by government support for biotechnology and an increasing number of local firms developing proprietary platforms for exosome-based diagnostics and therapies.

The disparity in clinical trial for exosomes activity, with North America leading, underscores the different stages of market maturity across regions.

Market Dynamics

Our researchers analyzed the data with 2025 as the base year, along with the key drivers, trends, and challenges. A holistic analysis of drivers will help companies refine their marketing strategies to gain a competitive advantage.

  • The commercialization of the exosome therapeutics market hinges on resolving several complex technical and regulatory issues. Significant advancements in exosome manufacturing technology are critical for scaling production from laboratory to clinical-grade quantities, a transition that remains a primary bottleneck for many developers.
  • The therapeutic promise is immense, particularly for indications like exosome therapy for acute ischemic stroke, where the ability of these vesicles to cross the blood-brain barrier offers a unique advantage over traditional biologics. However, demonstrating the clinical efficacy of msc-derived exosomes in large-scale human trials is a crucial next step that requires substantial investment and time.
  • Adding to the complexity are the regulatory challenges for exosome therapeutics, as agencies worldwide work to establish clear guidelines for this novel class of therapy. This ambiguity can delay development timelines, with some firms reporting that navigating differing international requirements extends their pre-market phase by up to 18 months compared to more established drug classes.
  • Furthermore, the successful exosome-based delivery of sirna and mrna represents a major opportunity, positioning exosomes as a key platform technology in the future of genetic medicine and personalized treatments. Addressing these interconnected challenges is essential for unlocking the full potential of this innovative field.

What are the key market drivers leading to the rise in the adoption of Exosome Therapeutics Industry?

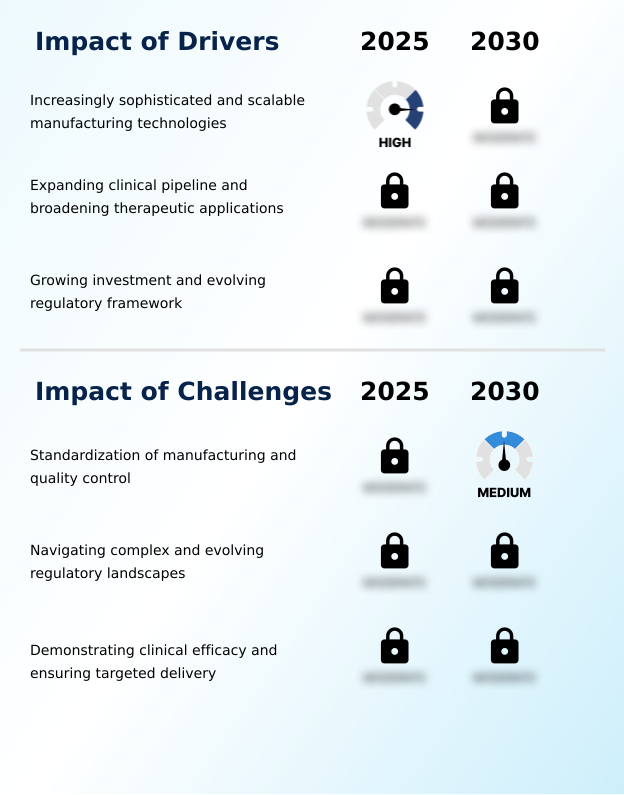
  • Increasingly sophisticated and scalable manufacturing technologies are a key driver of market growth.

  • Market growth is significantly driven by advancements in manufacturing, where new exosome purification methods are improving yields by up to 50%.
  • This addresses historical bottlenecks in gmp manufacturing of exosomes and enables the development of commercially viable advanced therapy medicinal products. A diversifying clinical pipeline expansion, moving into indications such as cardioprotective exosomes and neurodegenerative diseases, is attracting substantial investment.
  • Early-stage funding rounds are reportedly 30% larger year-over-year. Concurrently, a clearer regulatory pathways for exosomes framework is reducing uncertainty for developers.
  • This is crucial for advancing products through the investigational new drug application and biologics license application stages, fostering a stable environment for innovation in cell-free therapy and allogeneic exosome therapy.

What are the market trends shaping the Exosome Therapeutics Industry?

  • The expansion of exosomes as sophisticated drug delivery systems represents a significant upcoming market trend. This is driven by their inherent ability to transport therapeutic payloads to targeted cells.

  • A primary trend shaping the exosome therapeutics market is the engineering of these vesicles into sophisticated exosome drug delivery systems. This approach is enhancing therapeutic payload delivery, with some studies showing a reduction in off-target effects by over 40% compared to conventional methods.
  • The development of artificial and hybrid exosomes is addressing limitations in exosome manufacturing scale-up, allowing for greater consistency and control. This innovation is critical for exosome therapeutic applications in complex areas like oncology and neurodegeneration. Furthermore, rising partnerships are accelerating development timelines by an average of 25%, pooling expertise in areas like exosome cargo engineering and regulatory navigation.
  • This collaborative trend is expanding the utility of autologous exosome therapy and exosomes for autoimmune disorders.

What challenges does the Exosome Therapeutics Industry face during its growth?

  • The lack of standardization in manufacturing and quality control presents a key challenge to industry growth.

  • A primary challenge for the market is establishing standardized exosome quality control standards to manage product heterogeneity. Batch-to-batch variability, often exceeding 20%, complicates the path to regulatory approval and hinders the development of reliable nanovesicle drug delivery platforms.
  • Navigating complex and fragmented exosome cGMP guidelines across different regions can extend development timelines by up to 18 months, posing a significant risk for developers of mesenchymal stem cell exosomes. Furthermore, demonstrating clinical efficacy and understanding exosome stability and storage, exosome pharmacokinetics, and biodistribution remain critical hurdles.
  • The industry must move beyond preclinical success to deliver consistent outcomes in human exosome therapy clinical trials, which is essential for building confidence in this novel therapeutic modality.

Exclusive Technavio Analysis on Customer Landscape

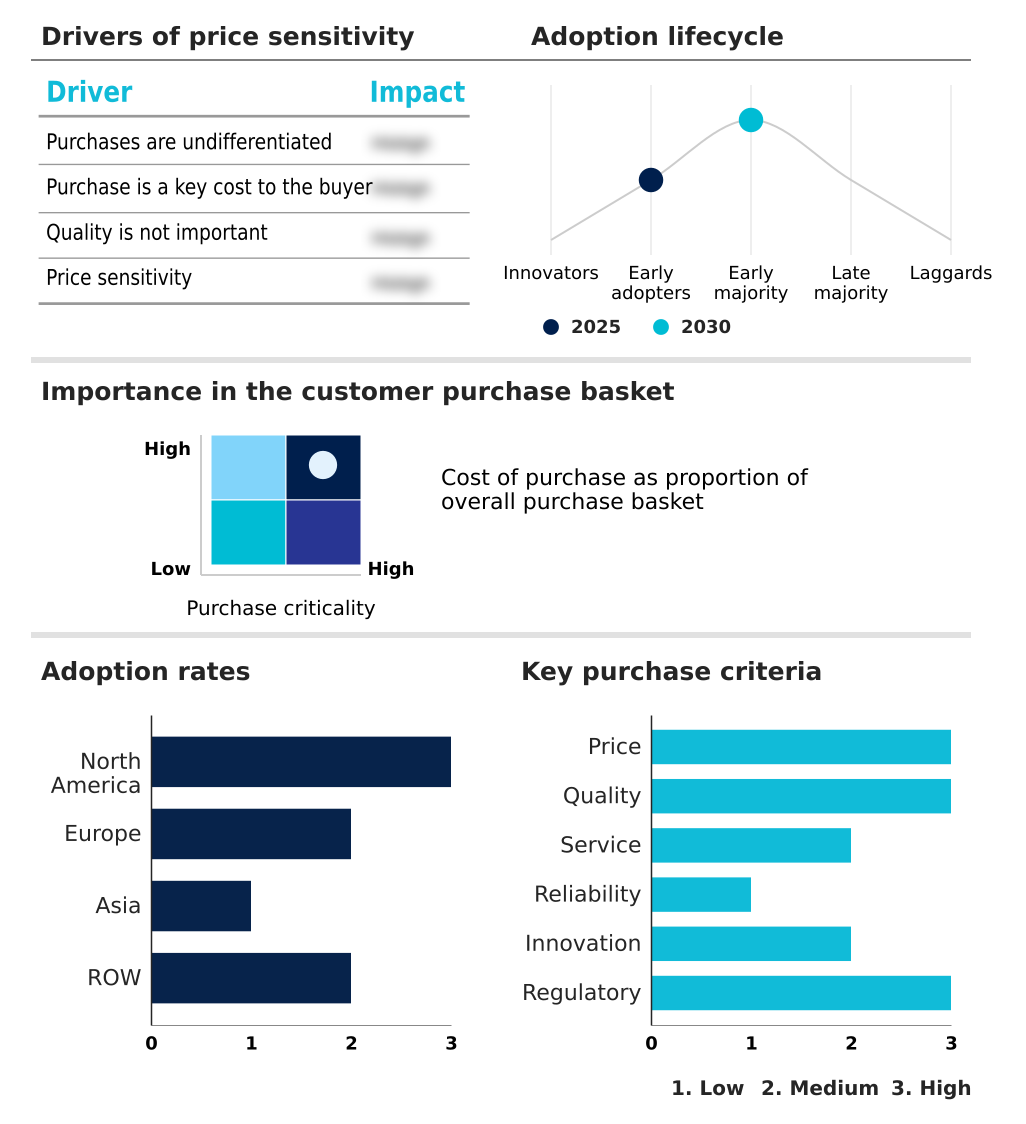
The exosome therapeutics market forecasting report includes the adoption lifecycle of the market, covering from the innovator’s stage to the laggard’s stage. It focuses on adoption rates in different regions based on penetration. Furthermore, the exosome therapeutics market report also includes key purchase criteria and drivers of price sensitivity to help companies evaluate and develop their market growth analysis strategies.

Customer Landscape of Exosome Therapeutics Industry

Competitive Landscape

Companies are implementing various strategies, such as strategic alliances, exosome therapeutics market forecast, partnerships, mergers and acquisitions, geographical expansion, and product/service launches, to enhance their presence in the industry.

Aegle Therapeutics - Focus is on developing extracellular vesicle-based therapies for dermatological conditions, utilizing regenerative medicine to modulate tissue repair and address inflammatory responses.

The industry research and growth report includes detailed analyses of the competitive landscape of the market and information about key companies, including:

  • Aegle Therapeutics
  • AMS Biotechnology Europe Ltd.
  • Aruna Bio Inc.
  • Capricor Therapeutics Inc.
  • CIloa SAS
  • Creative Biolabs
  • Cytiva
  • Direct Biologics LLC
  • Evotec SE
  • Evox Therapeutics Ltd.
  • ExoCoBio Inc.
  • ILIAS Biologics Inc.
  • Lonza Group Ltd.
  • NanoFCM Co. Ltd
  • ReNeuron Group plc
  • Rion Inc.
  • Thermo Fisher Scientific Inc.

Qualitative and quantitative analysis of companies has been conducted to help clients understand the wider business environment as well as the strengths and weaknesses of key industry players. Data is qualitatively analyzed to categorize companies as pure play, category-focused, industry-focused, and diversified; it is quantitatively analyzed to categorize companies as dominant, leading, strong, tentative, and weak.

Recent Development and News in Exosome therapeutics market

  • In August 2024, Capricor Therapeutics announced a successful pre-Biologics License Application meeting with the US FDA for its candidate CAP-1002, aimed at treating Duchenne muscular dystrophy.
  • In January 2025, NurExone Biologic announced the acquisition of a master cell bank from a US-based manufacturer to secure and scale its supply chain for exosome-based therapies.
  • In April 2025, RoosterBio Inc. and Thermo Fisher Scientific announced a collaboration to accelerate the manufacturing of cell and exosome therapies, addressing scalability and cost challenges.
  • In May 2025, South Korea's Ministry of Food and Drug Safety granted approval to S and E bio Co. Ltd. to commence a Phase 1b clinical trial for an exosome-based stroke treatment.

Dive into Technavio’s robust research methodology, blending expert interviews, extensive data synthesis, and validated models for unparalleled Exosome Therapeutics Market insights. See full methodology.

Market Scope
Page number 284
Base year 2025
Historic period 2020-2024
Forecast period 2026-2030
Growth momentum & CAGR Accelerate at a CAGR of 19.6%
Market growth 2026-2030 USD 408620.8 thousand
Market structure Fragmented
YoY growth 2025-2026(%) 17.0%
Key countries US, Canada, Mexico, Germany, UK, France, Italy, Spain, The Netherlands, China, Japan, India, South Korea, Thailand, Indonesia, Brazil, Saudi Arabia, South Africa, UAE, Israel, Argentina, Colombia and Turkey
Competitive landscape Leading Companies, Market Positioning of Companies, Competitive Strategies, and Industry Risks

Request Free Sample

Research Analyst Overview

  • The exosome therapeutics market is advancing rapidly, driven by innovation in exosome isolation techniques such as tangential flow filtration and size exclusion chromatography. These methods are pivotal for ensuring the purity and consistency required for gmp manufacturing of exosomes.
  • A key boardroom-level decision is whether to invest in in-house manufacturing or leverage specialized contract development and manufacturing organizations, a choice that significantly impacts capital allocation and speed to market. This move towards professionalized production is enabling a notable clinical pipeline expansion, with a focus on allogeneic exosome therapy as a scalable, off-the-shelf solution.
  • Advancements in exosome characterization and exosome drug loading are allowing for more precise targeted drug delivery, including for rna-based therapies. This progress is critical for demonstrating efficacy in exosome-based treatment for cancer and realizing the potential of the neural exosome platform for blood-brain barrier penetration.
  • The industry is moving from autologous exosome therapy toward more commercially viable models, underpinned by robust biomarker discovery and the development of exosome-based vaccines and other forms of cell-free therapy for regenerative medicine and extracellular vesicle therapeutics.

What are the Key Data Covered in this Exosome Therapeutics Market Research and Growth Report?

  • What is the expected growth of the Exosome Therapeutics Market between 2026 and 2030?

    • USD 408.62 million, at a CAGR of 19.6%

  • What segmentation does the market report cover?

    • The report is segmented by Application (Cancer therapies, Autoimmune diseases, Infectious diseases, and Others), Distribution Channel (Hospital pharmacy, Retail pharmacy, and Online pharmacy), Type (Allogeneic, and Autologous) and Geography (North America, Europe, Asia, Rest of World (ROW))

  • Which regions are analyzed in the report?

    • North America, Europe, Asia and Rest of World (ROW)

  • What are the key growth drivers and market challenges?

    • Increasingly sophisticated and scalable manufacturing technologies, Standardization of manufacturing and quality control

  • Who are the major players in the Exosome Therapeutics Market?

    • Aegle Therapeutics, AMS Biotechnology Europe Ltd., Aruna Bio Inc., Capricor Therapeutics Inc., CIloa SAS, Creative Biolabs, Cytiva, Direct Biologics LLC, Evotec SE, Evox Therapeutics Ltd., ExoCoBio Inc., ILIAS Biologics Inc., Lonza Group Ltd., NanoFCM Co. Ltd, ReNeuron Group plc, Rion Inc. and Thermo Fisher Scientific Inc.

Market Research Insights

  • The exosome therapeutics market is shaped by dynamic interactions between technological innovation and regulatory evolution. The development of advanced therapy medicinal products is accelerating, with exosome therapeutic applications expanding into new disease areas. Collaborations are proving crucial, with strategic partnerships reducing early-stage R&D timelines by an estimated 20%.
  • The industry is focused on exosome manufacturing scale-up, with new methods yielding purity levels over 95%, a significant improvement that supports exosome stability and storage. As exosome therapy clinical trials progress, there is a clear push towards establishing exosome quality control standards to ensure product consistency and safety.
  • Understanding exosome pharmacokinetics and exosome biodistribution studies is essential for validating efficacy and gaining regulatory approval. The focus on dermatological exosome applications and cardioprotective exosomes highlights the diversification of the clinical pipeline beyond oncology.

We can help! Our analysts can customize this exosome therapeutics market research report to meet your requirements.

Get in touch

1. Executive Summary

1.1 Market overview

Executive Summary - Chart on Market Overview
Executive Summary - Data Table on Market Overview
Executive Summary - Chart on Global Market Characteristics
Executive Summary - Chart on Market by Geography
Executive Summary - Chart on Market Segmentation by Application
Executive Summary - Chart on Market Segmentation by Distribution Channel
Executive Summary - Chart on Market Segmentation by Type
Executive Summary - Chart on Incremental Growth
Executive Summary - Data Table on Incremental Growth
Executive Summary - Chart on Company Market Positioning

2. Technavio Analysis

2.1 Analysis of price sensitivity, lifecycle, customer purchase basket, adoption rates, and purchase criteria

2.2 Criticality of inputs and Factors of differentiation

Chart on Overview on criticality of inputs and factors of differentiation

2.3 Factors of disruption

Chart on Overview on factors of disruption

2.4 Impact of drivers and challenges

Chart on Impact of drivers and challenges in 2025 and 2030

3. Market Landscape

3.1 Market ecosystem

Chart on Parent Market
Data Table on - Parent Market

3.2 Market characteristics

Chart on Market characteristics analysis

3.3 Value chain analysis

Chart on Value chain analysis

4. Market Sizing

4.1 Market definition

Data Table on Offerings of companies included in the market definition

4.2 Market segment analysis

Market segments

4.3 Market size 2025

4.4 Market outlook: Forecast for 2025-2030

Chart on Global - Market size and forecast 2025-2030 ($ thousand)
Data Table on Global - Market size and forecast 2025-2030 ($ thousand)
Chart on Global Market: Year-over-year growth 2025-2030 (%)
Data Table on Global Market: Year-over-year growth 2025-2030 (%)

5. Historic Market Size

5.1 Global Exosome Therapeutics Market 2020 - 2024

Historic Market Size - Data Table on Global Exosome Therapeutics Market 2020 - 2024 ($ thousand)

5.2 Application segment analysis 2020 - 2024

Historic Market Size - Application Segment 2020 - 2024 ($ thousand)

5.3 Distribution Channel segment analysis 2020 - 2024

Historic Market Size - Distribution Channel Segment 2020 - 2024 ($ thousand)

5.4 Type segment analysis 2020 - 2024

Historic Market Size - Type Segment 2020 - 2024 ($ thousand)

5.5 Geography segment analysis 2020 - 2024

Historic Market Size - Geography Segment 2020 - 2024 ($ thousand)

5.6 Country segment analysis 2020 - 2024

Historic Market Size - Country Segment 2020 - 2024 ($ thousand)

6. Qualitative Analysis

6.1 Impact of AI in the Global Exosome Therapeutics Market

7. Five Forces Analysis

7.1 Five forces summary

Five forces analysis - Comparison between 2025 and 2030

7.2 Bargaining power of buyers

Bargaining power of buyers - Impact of key factors 2025 and 2030

7.3 Bargaining power of suppliers

Bargaining power of suppliers - Impact of key factors in 2025 and 2030

7.4 Threat of new entrants

Threat of new entrants - Impact of key factors in 2025 and 2030

7.5 Threat of substitutes

Threat of substitutes - Impact of key factors in 2025 and 2030

7.6 Threat of rivalry

Threat of rivalry - Impact of key factors in 2025 and 2030

7.7 Market condition

Chart on Market condition - Five forces 2025 and 2030

8. Market Segmentation by Application

8.1 Market segments

Chart on Application - Market share 2025-2030 (%)
Data Table on Application - Market share 2025-2030 (%)

8.2 Comparison by Application

Chart on Comparison by Application
Data Table on Comparison by Application

8.3 Cancer therapies - Market size and forecast 2025-2030

Chart on Cancer therapies - Market size and forecast 2025-2030 ($ thousand)
Data Table on Cancer therapies - Market size and forecast 2025-2030 ($ thousand)
Chart on Cancer therapies - Year-over-year growth 2025-2030 (%)
Data Table on Cancer therapies - Year-over-year growth 2025-2030 (%)

8.4 Autoimmune diseases - Market size and forecast 2025-2030

Chart on Autoimmune diseases - Market size and forecast 2025-2030 ($ thousand)
Data Table on Autoimmune diseases - Market size and forecast 2025-2030 ($ thousand)
Chart on Autoimmune diseases - Year-over-year growth 2025-2030 (%)
Data Table on Autoimmune diseases - Year-over-year growth 2025-2030 (%)

8.5 Infectious diseases - Market size and forecast 2025-2030

Chart on Infectious diseases - Market size and forecast 2025-2030 ($ thousand)
Data Table on Infectious diseases - Market size and forecast 2025-2030 ($ thousand)
Chart on Infectious diseases - Year-over-year growth 2025-2030 (%)
Data Table on Infectious diseases - Year-over-year growth 2025-2030 (%)

8.6 Others - Market size and forecast 2025-2030

Chart on Others - Market size and forecast 2025-2030 ($ thousand)
Data Table on Others - Market size and forecast 2025-2030 ($ thousand)
Chart on Others - Year-over-year growth 2025-2030 (%)
Data Table on Others - Year-over-year growth 2025-2030 (%)

8.7 Market opportunity by Application

Market opportunity by Application ($ thousand)
Data Table on Market opportunity by Application ($ thousand)

9. Market Segmentation by Distribution Channel

9.1 Market segments

Chart on Distribution Channel - Market share 2025-2030 (%)
Data Table on Distribution Channel - Market share 2025-2030 (%)

9.2 Comparison by Distribution Channel

Chart on Comparison by Distribution Channel
Data Table on Comparison by Distribution Channel

9.3 Hospital pharmacy - Market size and forecast 2025-2030

Chart on Hospital pharmacy - Market size and forecast 2025-2030 ($ thousand)
Data Table on Hospital pharmacy - Market size and forecast 2025-2030 ($ thousand)
Chart on Hospital pharmacy - Year-over-year growth 2025-2030 (%)
Data Table on Hospital pharmacy - Year-over-year growth 2025-2030 (%)

9.4 Retail pharmacy - Market size and forecast 2025-2030

Chart on Retail pharmacy - Market size and forecast 2025-2030 ($ thousand)
Data Table on Retail pharmacy - Market size and forecast 2025-2030 ($ thousand)
Chart on Retail pharmacy - Year-over-year growth 2025-2030 (%)
Data Table on Retail pharmacy - Year-over-year growth 2025-2030 (%)

9.5 Online pharmacy - Market size and forecast 2025-2030

Chart on Online pharmacy - Market size and forecast 2025-2030 ($ thousand)
Data Table on Online pharmacy - Market size and forecast 2025-2030 ($ thousand)
Chart on Online pharmacy - Year-over-year growth 2025-2030 (%)
Data Table on Online pharmacy - Year-over-year growth 2025-2030 (%)

9.6 Market opportunity by Distribution Channel

Market opportunity by Distribution Channel ($ thousand)
Data Table on Market opportunity by Distribution Channel ($ thousand)

10. Market Segmentation by Type

10.1 Market segments

Chart on Type - Market share 2025-2030 (%)
Data Table on Type - Market share 2025-2030 (%)

10.2 Comparison by Type

Chart on Comparison by Type
Data Table on Comparison by Type

10.3 Allogeneic - Market size and forecast 2025-2030

Chart on Allogeneic - Market size and forecast 2025-2030 ($ thousand)
Data Table on Allogeneic - Market size and forecast 2025-2030 ($ thousand)
Chart on Allogeneic - Year-over-year growth 2025-2030 (%)
Data Table on Allogeneic - Year-over-year growth 2025-2030 (%)

10.4 Autologous - Market size and forecast 2025-2030

Chart on Autologous - Market size and forecast 2025-2030 ($ thousand)
Data Table on Autologous - Market size and forecast 2025-2030 ($ thousand)
Chart on Autologous - Year-over-year growth 2025-2030 (%)
Data Table on Autologous - Year-over-year growth 2025-2030 (%)

10.5 Market opportunity by Type

Market opportunity by Type ($ thousand)
Data Table on Market opportunity by Type ($ thousand)

11. Customer Landscape

11.1 Customer landscape overview

Analysis of price sensitivity, lifecycle, customer purchase basket, adoption rates, and purchase criteria

12. Geographic Landscape

12.1 Geographic segmentation

Chart on Market share by geography 2025-2030 (%)
Data Table on Market share by geography 2025-2030 (%)

12.2 Geographic comparison

Chart on Geographic comparison
Data Table on Geographic comparison

12.3 North America - Market size and forecast 2025-2030

Chart on North America - Market size and forecast 2025-2030 ($ thousand)
Data Table on North America - Market size and forecast 2025-2030 ($ thousand)
Chart on North America - Year-over-year growth 2025-2030 (%)
Data Table on North America - Year-over-year growth 2025-2030 (%)
Chart on Regional Comparison - North America
Data Table on Regional Comparison - North America

12.3.1 US - Market size and forecast 2025-2030

Chart on US - Market size and forecast 2025-2030 ($ thousand)
Data Table on US - Market size and forecast 2025-2030 ($ thousand)
Chart on US - Year-over-year growth 2025-2030 (%)
Data Table on US - Year-over-year growth 2025-2030 (%)

12.3.2 Canada - Market size and forecast 2025-2030

Chart on Canada - Market size and forecast 2025-2030 ($ thousand)
Data Table on Canada - Market size and forecast 2025-2030 ($ thousand)
Chart on Canada - Year-over-year growth 2025-2030 (%)
Data Table on Canada - Year-over-year growth 2025-2030 (%)

12.3.3 Mexico - Market size and forecast 2025-2030

Chart on Mexico - Market size and forecast 2025-2030 ($ thousand)
Data Table on Mexico - Market size and forecast 2025-2030 ($ thousand)
Chart on Mexico - Year-over-year growth 2025-2030 (%)
Data Table on Mexico - Year-over-year growth 2025-2030 (%)

12.4 Europe - Market size and forecast 2025-2030

Chart on Europe - Market size and forecast 2025-2030 ($ thousand)
Data Table on Europe - Market size and forecast 2025-2030 ($ thousand)
Chart on Europe - Year-over-year growth 2025-2030 (%)
Data Table on Europe - Year-over-year growth 2025-2030 (%)
Chart on Regional Comparison - Europe
Data Table on Regional Comparison - Europe

12.4.1 Germany - Market size and forecast 2025-2030

Chart on Germany - Market size and forecast 2025-2030 ($ thousand)
Data Table on Germany - Market size and forecast 2025-2030 ($ thousand)
Chart on Germany - Year-over-year growth 2025-2030 (%)
Data Table on Germany - Year-over-year growth 2025-2030 (%)

12.4.2 UK - Market size and forecast 2025-2030

Chart on UK - Market size and forecast 2025-2030 ($ thousand)
Data Table on UK - Market size and forecast 2025-2030 ($ thousand)
Chart on UK - Year-over-year growth 2025-2030 (%)
Data Table on UK - Year-over-year growth 2025-2030 (%)

12.4.3 France - Market size and forecast 2025-2030

Chart on France - Market size and forecast 2025-2030 ($ thousand)
Data Table on France - Market size and forecast 2025-2030 ($ thousand)
Chart on France - Year-over-year growth 2025-2030 (%)
Data Table on France - Year-over-year growth 2025-2030 (%)

12.4.4 Italy - Market size and forecast 2025-2030

Chart on Italy - Market size and forecast 2025-2030 ($ thousand)
Data Table on Italy - Market size and forecast 2025-2030 ($ thousand)
Chart on Italy - Year-over-year growth 2025-2030 (%)
Data Table on Italy - Year-over-year growth 2025-2030 (%)

12.4.5 Spain - Market size and forecast 2025-2030

Chart on Spain - Market size and forecast 2025-2030 ($ thousand)
Data Table on Spain - Market size and forecast 2025-2030 ($ thousand)
Chart on Spain - Year-over-year growth 2025-2030 (%)
Data Table on Spain - Year-over-year growth 2025-2030 (%)

12.4.6 The Netherlands - Market size and forecast 2025-2030

Chart on The Netherlands - Market size and forecast 2025-2030 ($ thousand)
Data Table on The Netherlands - Market size and forecast 2025-2030 ($ thousand)
Chart on The Netherlands - Year-over-year growth 2025-2030 (%)
Data Table on The Netherlands - Year-over-year growth 2025-2030 (%)

12.5 Asia - Market size and forecast 2025-2030

Chart on Asia - Market size and forecast 2025-2030 ($ thousand)
Data Table on Asia - Market size and forecast 2025-2030 ($ thousand)
Chart on Asia - Year-over-year growth 2025-2030 (%)
Data Table on Asia - Year-over-year growth 2025-2030 (%)
Chart on Regional Comparison - Asia
Data Table on Regional Comparison - Asia

12.5.1 China - Market size and forecast 2025-2030

Chart on China - Market size and forecast 2025-2030 ($ thousand)
Data Table on China - Market size and forecast 2025-2030 ($ thousand)
Chart on China - Year-over-year growth 2025-2030 (%)
Data Table on China - Year-over-year growth 2025-2030 (%)

12.5.2 Japan - Market size and forecast 2025-2030

Chart on Japan - Market size and forecast 2025-2030 ($ thousand)
Data Table on Japan - Market size and forecast 2025-2030 ($ thousand)
Chart on Japan - Year-over-year growth 2025-2030 (%)
Data Table on Japan - Year-over-year growth 2025-2030 (%)

12.5.3 India - Market size and forecast 2025-2030

Chart on India - Market size and forecast 2025-2030 ($ thousand)
Data Table on India - Market size and forecast 2025-2030 ($ thousand)
Chart on India - Year-over-year growth 2025-2030 (%)
Data Table on India - Year-over-year growth 2025-2030 (%)

12.5.4 South Korea - Market size and forecast 2025-2030

Chart on South Korea - Market size and forecast 2025-2030 ($ thousand)
Data Table on South Korea - Market size and forecast 2025-2030 ($ thousand)
Chart on South Korea - Year-over-year growth 2025-2030 (%)
Data Table on South Korea - Year-over-year growth 2025-2030 (%)

12.5.5 Thailand - Market size and forecast 2025-2030

Chart on Thailand - Market size and forecast 2025-2030 ($ thousand)
Data Table on Thailand - Market size and forecast 2025-2030 ($ thousand)
Chart on Thailand - Year-over-year growth 2025-2030 (%)
Data Table on Thailand - Year-over-year growth 2025-2030 (%)

12.5.6 Indonesia - Market size and forecast 2025-2030

Chart on Indonesia - Market size and forecast 2025-2030 ($ thousand)
Data Table on Indonesia - Market size and forecast 2025-2030 ($ thousand)
Chart on Indonesia - Year-over-year growth 2025-2030 (%)
Data Table on Indonesia - Year-over-year growth 2025-2030 (%)

12.6 Rest of World (ROW) - Market size and forecast 2025-2030

Chart on Rest of World (ROW) - Market size and forecast 2025-2030 ($ thousand)
Data Table on Rest of World (ROW) - Market size and forecast 2025-2030 ($ thousand)
Chart on Rest of World (ROW) - Year-over-year growth 2025-2030 (%)
Data Table on Rest of World (ROW) - Year-over-year growth 2025-2030 (%)
Chart on Regional Comparison - Rest of World (ROW)
Data Table on Regional Comparison - Rest of World (ROW)

12.6.1 Brazil - Market size and forecast 2025-2030

Chart on Brazil - Market size and forecast 2025-2030 ($ thousand)
Data Table on Brazil - Market size and forecast 2025-2030 ($ thousand)
Chart on Brazil - Year-over-year growth 2025-2030 (%)
Data Table on Brazil - Year-over-year growth 2025-2030 (%)

12.6.2 Saudi Arabia - Market size and forecast 2025-2030

Chart on Saudi Arabia - Market size and forecast 2025-2030 ($ thousand)
Data Table on Saudi Arabia - Market size and forecast 2025-2030 ($ thousand)
Chart on Saudi Arabia - Year-over-year growth 2025-2030 (%)
Data Table on Saudi Arabia - Year-over-year growth 2025-2030 (%)

12.6.3 South Africa - Market size and forecast 2025-2030

Chart on South Africa - Market size and forecast 2025-2030 ($ thousand)
Data Table on South Africa - Market size and forecast 2025-2030 ($ thousand)
Chart on South Africa - Year-over-year growth 2025-2030 (%)
Data Table on South Africa - Year-over-year growth 2025-2030 (%)

12.6.4 UAE - Market size and forecast 2025-2030

Chart on UAE - Market size and forecast 2025-2030 ($ thousand)
Data Table on UAE - Market size and forecast 2025-2030 ($ thousand)
Chart on UAE - Year-over-year growth 2025-2030 (%)
Data Table on UAE - Year-over-year growth 2025-2030 (%)

12.6.5 Israel - Market size and forecast 2025-2030

Chart on Israel - Market size and forecast 2025-2030 ($ thousand)
Data Table on Israel - Market size and forecast 2025-2030 ($ thousand)
Chart on Israel - Year-over-year growth 2025-2030 (%)
Data Table on Israel - Year-over-year growth 2025-2030 (%)

12.6.6 Argentina - Market size and forecast 2025-2030

Chart on Argentina - Market size and forecast 2025-2030 ($ thousand)
Data Table on Argentina - Market size and forecast 2025-2030 ($ thousand)
Chart on Argentina - Year-over-year growth 2025-2030 (%)
Data Table on Argentina - Year-over-year growth 2025-2030 (%)

12.6.7 Colombia - Market size and forecast 2025-2030

Chart on Colombia - Market size and forecast 2025-2030 ($ thousand)
Data Table on Colombia - Market size and forecast 2025-2030 ($ thousand)
Chart on Colombia - Year-over-year growth 2025-2030 (%)
Data Table on Colombia - Year-over-year growth 2025-2030 (%)

12.6.8 Turkey - Market size and forecast 2025-2030

Chart on Turkey - Market size and forecast 2025-2030 ($ thousand)
Data Table on Turkey - Market size and forecast 2025-2030 ($ thousand)
Chart on Turkey - Year-over-year growth 2025-2030 (%)
Data Table on Turkey - Year-over-year growth 2025-2030 (%)

12.7 Market opportunity by geography

Market opportunity by geography ($ thousand)
Data Tables on Market opportunity by geography ($ thousand)

13. Drivers, Challenges, and Opportunity

13.1 Market drivers

Increasingly sophisticated and scalable manufacturing technologies
Expanding clinical pipeline and broadening therapeutic applications
Growing investment and evolving regulatory framework

13.2 Market challenges

Standardization of manufacturing and quality control
Navigating complex and evolving regulatory landscapes
Demonstrating clinical efficacy and ensuring targeted delivery

13.3 Impact of drivers and challenges

Impact of drivers and challenges in 2025 and 2030

13.4 Market opportunities

Expansion of exosomes as drug delivery systems
Rising partnerships and collaborations between companies and healthcare organisations
Artificial exosomes for translational nanomedicine

14. Competitive Landscape

14.1 Overview

14.2

Overview on criticality of inputs and factors of differentiation

14.3 Landscape disruption

Overview on factors of disruption

14.4 Industry risks

Impact of key risks on business

15. Competitive Analysis

15.1 Companies profiled

Companies covered

15.2 Company ranking index

15.3 Market positioning of companies

Matrix on companies position and classification

15.4 Aegle Therapeutics

Aegle Therapeutics - Overview
Aegle Therapeutics - Product / Service
Aegle Therapeutics - Key offerings
SWOT

15.5 Aruna Bio Inc.

Aruna Bio Inc. - Overview
Aruna Bio Inc. - Product / Service
Aruna Bio Inc. - Key offerings
SWOT

15.6 Capricor Therapeutics Inc.

Capricor Therapeutics Inc. - Overview
Capricor Therapeutics Inc. - Product / Service
Capricor Therapeutics Inc. - Key offerings
SWOT

15.7 CIloa SAS

CIloa SAS - Overview
CIloa SAS - Product / Service
CIloa SAS - Key offerings
SWOT

15.8 Creative Biolabs

Creative Biolabs - Overview
Creative Biolabs - Product / Service
Creative Biolabs - Key offerings
SWOT

15.9 Cytiva

Cytiva - Overview
Cytiva - Product / Service
Cytiva - Key offerings
SWOT

15.10 Direct Biologics LLC

Direct Biologics LLC - Overview
Direct Biologics LLC - Product / Service
Direct Biologics LLC - Key offerings
SWOT

15.11 Evox Therapeutics Ltd.

Evox Therapeutics Ltd. - Overview
Evox Therapeutics Ltd. - Product / Service
Evox Therapeutics Ltd. - Key offerings
SWOT

15.12 ExoCoBio Inc.

ExoCoBio Inc. - Overview
ExoCoBio Inc. - Product / Service
ExoCoBio Inc. - Key offerings
SWOT

15.13 ILIAS Biologics Inc.

ILIAS Biologics Inc. - Overview
ILIAS Biologics Inc. - Product / Service
ILIAS Biologics Inc. - Key offerings
SWOT

15.14 Lonza Group Ltd.

Lonza Group Ltd. - Overview
Lonza Group Ltd. - Business segments
Lonza Group Ltd. - Key news
Lonza Group Ltd. - Key offerings
Lonza Group Ltd. - Segment focus
SWOT

15.15 NanoFCM Co. Ltd

NanoFCM Co. Ltd - Overview
NanoFCM Co. Ltd - Product / Service
NanoFCM Co. Ltd - Key offerings
SWOT

15.16 ReNeuron Group plc

ReNeuron Group plc - Overview
ReNeuron Group plc - Product / Service
ReNeuron Group plc - Key offerings
SWOT

15.17 Rion Inc.

Rion Inc. - Overview
Rion Inc. - Product / Service
Rion Inc. - Key offerings
SWOT

15.18 Thermo Fisher Scientific Inc.

Thermo Fisher Scientific Inc. - Overview
Thermo Fisher Scientific Inc. - Business segments
Thermo Fisher Scientific Inc. - Key news
Thermo Fisher Scientific Inc. - Key offerings
Thermo Fisher Scientific Inc. - Segment focus
SWOT

16. Appendix

16.1 Scope of the report

Market definition
Objectives
Notes and caveats

16.2 Inclusions and exclusions checklist

Inclusions checklist
Exclusions checklist

16.3 Currency conversion rates for US$

16.4 Research methodology

16.5 Data procurement

Information sources

16.6 Data validation

16.7 Validation techniques employed for market sizing

16.8 Data synthesis

16.9 360 degree market analysis

16.10 List of abbreviations

Research Methodology

Technavio presents a detailed picture of the market by way of study, synthesis, and summation of data from multiple sources. The analysts have presented the various facets of the market with a particular focus on identifying the key industry influencers. The data thus presented is comprehensive, reliable, and the result of extensive research, both primary and secondary.

INFORMATION SOURCES

Primary sources

  • Manufacturers and suppliers
  • Channel partners
  • Industry experts
  • Strategic decision makers

Secondary sources

  • Industry journals and periodicals
  • Government data
  • Financial reports of key industry players
  • Historical data
  • Press releases

DATA ANALYSIS

Data Synthesis

  • Collation of data
  • Estimation of key figures
  • Analysis of derived insights

Data Validation

  • Triangulation with data models
  • Reference against proprietary databases
  • Corroboration with industry experts

REPORT WRITING

Qualitative

  • Market drivers
  • Market challenges
  • Market trends
  • Five forces analysis

Quantitative

  • Market size and forecast
  • Market segmentation
  • Geographical insights
  • Competitive landscape

Interested in this report?

Get your sample now to see our research methodology and insights!

Download Now

Frequently Asked Questions

Exosome Therapeutics market growth will increase by USD 408620.8 thousand thousand during 2026-2030.

The Exosome Therapeutics market is expected to grow at a CAGR of 19.6% during 2026-2030.

Exosome Therapeutics market is segmented by Application (Cancer therapies, Autoimmune diseases, Infectious diseases, Others) Distribution channel (Hospital pharmacy, Retail pharmacy, Online pharmacy) Type (Allogeneic, Autologous)

Aegle Therapeutics, AMS Biotechnology Europe Ltd., Aruna Bio Inc., Capricor Therapeutics Inc., CIloa SAS, Creative Biolabs, Cytiva, Direct Biologics LLC, Evotec SE, Evox Therapeutics Ltd., ExoCoBio Inc., ILIAS Biologics Inc., Lonza Group Ltd., NanoFCM Co. Ltd, ReNeuron Group plc, Rion Inc., Thermo Fisher Scientific Inc. are a few of the key vendors in the Exosome Therapeutics market.

North America will register the highest growth rate of 29.7% among the other regions. Therefore, the Exosome Therapeutics market in North America is expected to garner significant business opportunities for the vendors during the forecast period.

US, Canada, Mexico, Germany, UK, France, Italy, Spain, The Netherlands, China, Japan, India, South Korea, Thailand, Indonesia, Brazil, Saudi Arabia, South Africa, UAE, Israel, Argentina, Colombia, Turkey

  • Increasingly sophisticated and scalable manufacturing technologies is the driving factor this market.

The Exosome Therapeutics market vendors should focus on grabbing business opportunities from the Application segment as it accounted for the largest market share in the base year.