US Extended Warranty Market Size 2026-2030
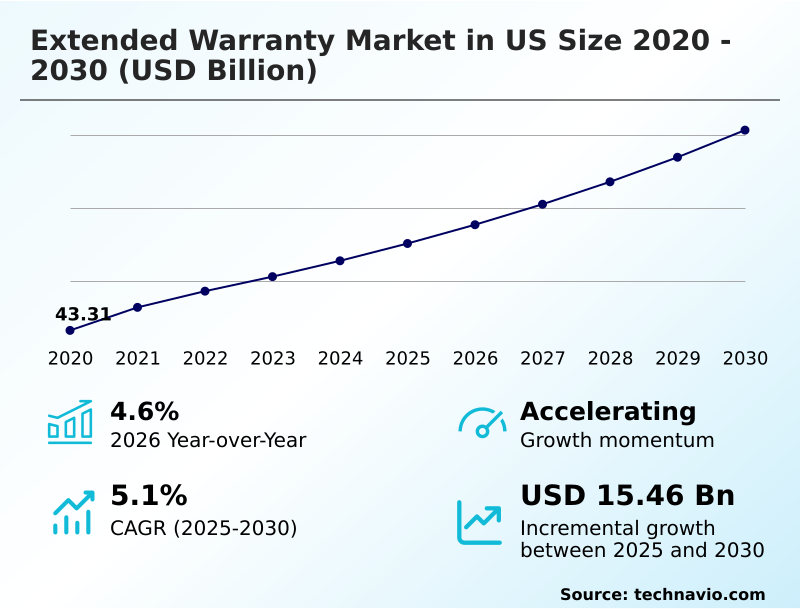
The us extended warranty market size is valued to increase by USD 15.46 billion, at a CAGR of 5.1% from 2025 to 2030. High demand for household appliances will drive the us extended warranty market.
Major Market Trends & Insights
- By Device - Automobile segment was valued at USD 17.07 billion in 2024
- By End-user - Businesses segment accounted for the largest market revenue share in 2024
Market Size & Forecast
- Market Opportunities: USD 27.31 billion
- Market Future Opportunities: USD 15.46 billion
- CAGR from 2025 to 2030 : 5.1%
Market Summary
- The extended warranty market in US is undergoing a significant transformation, driven by the increasing complexity of consumer products and a strategic shift toward service-oriented business models. As automobiles and electronics become more technologically advanced, the associated repair costs escalate, compelling consumers to seek financial protection through service contracts.
- This demand is met by an industry that is rapidly innovating, moving beyond traditional mechanical failure coverage to offer more comprehensive solutions. Key trends include the integration of IT and analytics to streamline claims processing and the rise of embedded insurance models that simplify the purchasing experience.
- For instance, a provider might leverage an IoT-enabled warranty to offer predictive maintenance alerts for a commercial fleet, optimizing operational efficiency and minimizing downtime. However, the market faces challenges from stringent consumer protection regulations and inflationary pressures on parts and labor, which compress margins for third-party administrators.
- Success in this evolving landscape depends on balancing risk, managing operational costs, and delivering a seamless customer experience through digital-first service models and personalized warranty solutions that serve as effective customer retention tools.
What will be the Size of the US Extended Warranty Market during the forecast period?
Get Key Insights on Market Forecast (PDF) Get Free Sample
How is the US Extended Warranty Market Segmented?
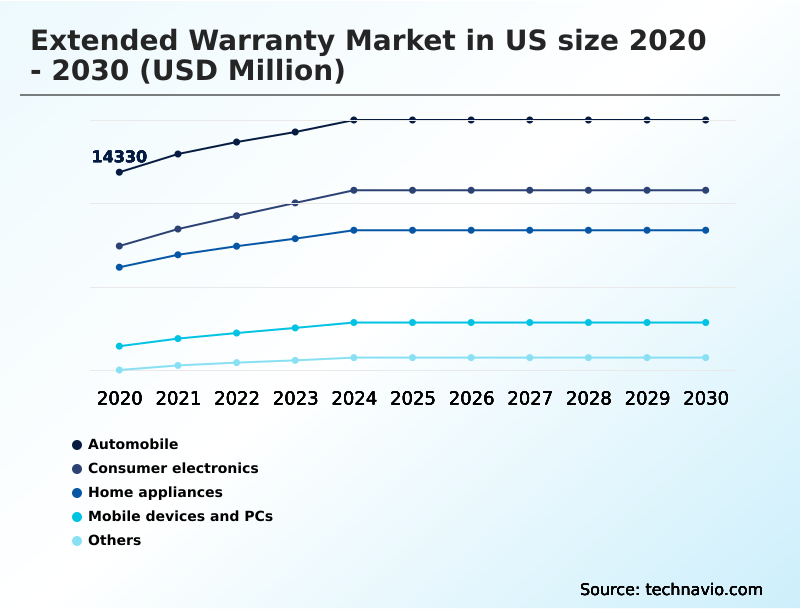
The us extended warranty industry research report provides comprehensive data (region-wise segment analysis), with forecasts and estimates in "USD million" for the period 2026-2030, as well as historical data from 2020-2024 for the following segments.
- Device
- Automobile
- Consumer electronics
- Home appliances
- Mobile devices and PCs
- Others
- End-user
- Businesses
- Individuals
- Type
- Standard extended warranty
- Comprehensive extended warranty
- Accidental damage protection
- Geography
- North America
- US
- North America
By Device Insights
The automobile segment is estimated to witness significant growth during the forecast period.
The automobile segment in the US extended warranty market is shaped by the escalating technological sophistication of modern vehicles, driving consumer demand for comprehensive protection.
As vehicles integrate advanced electronics, standard powertrain protection is often insufficient, making an electrical breakdown coverage plan a critical financial tool. This demand is amplified by consumers retaining vehicles for longer periods.
The sector faces significant cost pressures, with prices for essential parts surging and impacting the cost of a service contract.
Firms now require a certified repair technician for complex jobs, and some providers are leveraging subscription-based protection models, which have shown a 15% higher attachment rate than traditional one-time sales.
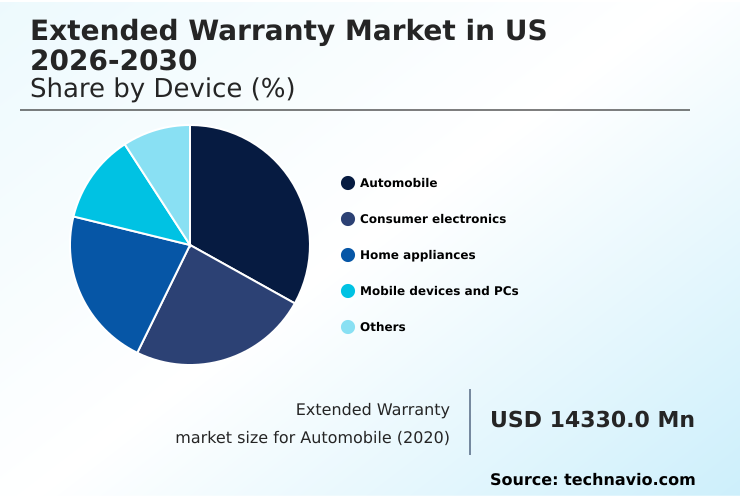
The Automobile segment was valued at USD 17.07 billion in 2024 and showed a gradual increase during the forecast period.
Market Dynamics
Our researchers analyzed the data with 2025 as the base year, along with the key drivers, trends, and challenges. A holistic analysis of drivers will help companies refine their marketing strategies to gain a competitive advantage.
- Consumers in the extended warranty market in US are increasingly sophisticated, carefully weighing standard vs comprehensive warranty coverage based on their specific needs. For high-value items, the decision between an extended warranty vs self-insurance often hinges on the potential automotive extended service contract costs or the price of accidental damage protection for electronics.
- Providers are responding by clarifying coverage details, such as what does a powertrain warranty cover, and simplifying how to file an extended warranty claim. The market for an extended warranty for mobile devices and the cost of extended warranty for laptops remain highly competitive, prompting firms to innovate.
- One key area is improving claims processing with AI, where some administrators have reduced adjudication times by over 40% compared to manual methods. This efficiency is critical for managing high operational warranty costs. The choice between a third-party vs manufacturer warranty is another key consideration, as are the legal requirements for warranty providers.
- As consumers seek the best home appliance warranty plans and the benefits of vehicle service contracts, providers must address the impact of tariffs on repair parts. The rise of usage-based insurance for vehicles and parametric insurance for power surges shows a move toward personalized, trigger-based coverage, especially for those seeking an extended auto warranty for used cars.
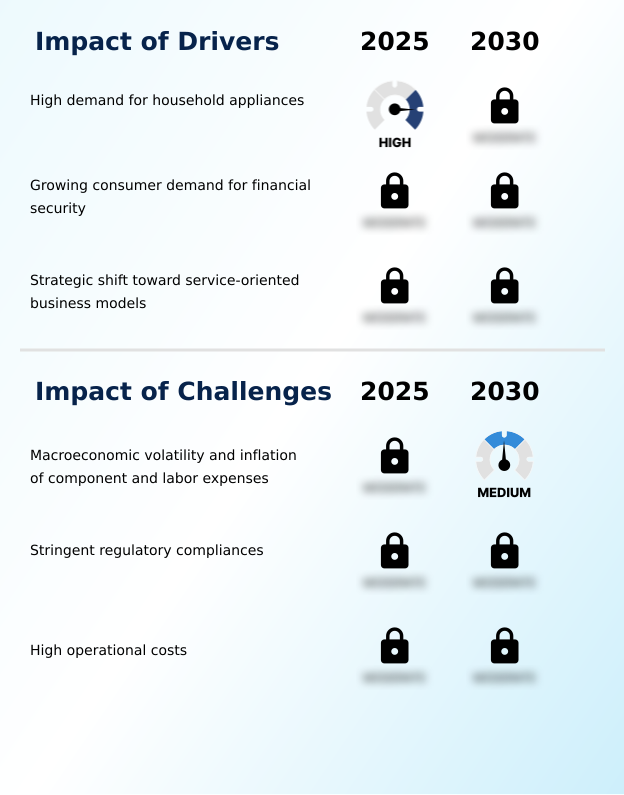
What are the key market drivers leading to the rise in the adoption of US Extended Warranty Industry?
- High demand for technologically advanced household appliances, which have higher repair costs and complexity, is a key driver for the extended warranty market.
- Heightened consumer demand for financial predictability is a primary market driver for the extended warranty market in US. A service contract acts as a crucial financial security instrument and budget stability tool.
- This is amplified by the strategic pivot of manufacturers toward service-oriented business models, which create a long-term customer engagement period. These models view warranties as a key customer retention tool, fostering brand loyalty enhancement through positive service interactions.
- Adopting this approach has shown to increase post-purchase revenue streams by up to 20% while strengthening recurring revenue stream opportunities for businesses.
What are the market trends shaping the US Extended Warranty Industry?
- The proliferation of embedded and usage-based warranties represents a significant upcoming market trend, shifting protection plans from aftermarket add-ons to integrated, data-driven components of product ownership.
- A definitive shift toward deeply integrated protection plans is reshaping the extended warranty market in US. The proliferation of an IoT-enabled warranty allows for the introduction of a usage-based warranty, moving away from static premiums. This trend is complemented by the emergence of parametric insurance, where a predefined event automatically triggers a claim, enhancing the claims experience.
- This model reduces administrative overhead for providers by over 25%. Concurrently, the integration of analytics for predictive maintenance is enabling proactive service and better data-driven risk management, with some platforms improving risk modeling accuracy by 15% and streamlining claims processing.
What challenges does the US Extended Warranty Industry face during its growth?
- Macroeconomic volatility, coupled with the inflation of component and labor expenses, presents a key challenge affecting industry growth and profitability.
- Significant headwinds in the US extended warranty market are present due to macroeconomic volatility and severe repair cost inflation. The implementation of a 25% tariff on many imported motor vehicle components has directly increased the cost of aftermarket parts, leading to acute margin compression.
- This is compounded by a chronic skilled technician shortage, which has driven labor rates up by an estimated 10% in competitive areas. These factors create immense pressure on operational cost management. The supply chain disruption impact further complicates the ability of third-party administrators to secure OEM parts, challenging financial stability compliance.
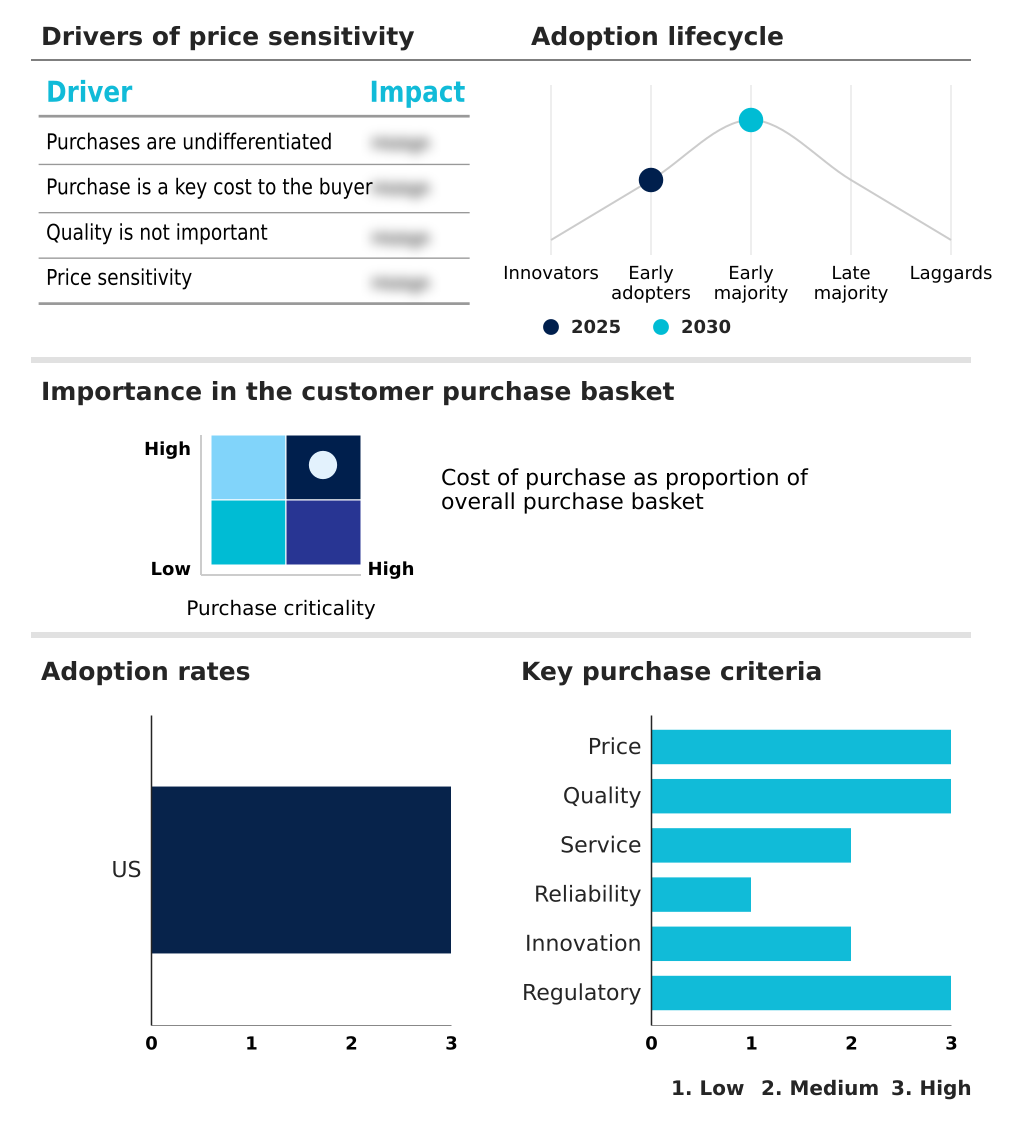
Exclusive Technavio Analysis on Customer Landscape
The us extended warranty market forecasting report includes the adoption lifecycle of the market, covering from the innovator’s stage to the laggard’s stage. It focuses on adoption rates in different regions based on penetration. Furthermore, the us extended warranty market report also includes key purchase criteria and drivers of price sensitivity to help companies evaluate and develop their market growth analysis strategies.
Customer Landscape of US Extended Warranty Industry
Competitive Landscape
Companies are implementing various strategies, such as strategic alliances, us extended warranty market forecast, partnerships, mergers and acquisitions, geographical expansion, and product/service launches, to enhance their presence in the industry.
AFC Home Club - Analysis indicates a focus on providing comprehensive, standard, and essential extended warranty solutions for automotive assets, addressing diverse consumer risk management needs.
The industry research and growth report includes detailed analyses of the competitive landscape of the market and information about key companies, including:
- AFC Home Club
- Allianz SE
- American Home Shield Corp.
- American International Group
- AmTrust Financial Services
- Assurant Inc.
- Asurion LLC
- AXA Group
- Carchex LLC
- CarShield
- Chubb Ltd.
- Cinch Home Services Inc.
- Endurance Warranty Services
- Fidelity Warranty Services
- JM and A Group
- Liberty Home Guard
- Safe Guard Products LLC
- The Allstate Corp.
- Upsie
Qualitative and quantitative analysis of companies has been conducted to help clients understand the wider business environment as well as the strengths and weaknesses of key industry players. Data is qualitatively analyzed to categorize companies as pure play, category-focused, industry-focused, and diversified; it is quantitatively analyzed to categorize companies as dominant, leading, strong, tentative, and weak.
Recent Development and News in Us extended warranty market
- In February 2025, Asurion partnered with Brightspeed to launch Total Home Tech Support, a service providing comprehensive technical assistance for a wide array of electronic devices within a customer's home.
- In September 2025, SureBright introduced an industry-first whole-system extended warranty program specifically designed for custom installers, consolidating protection for diverse equipment like audio-visual gear under a single contract.
- In November 2025, Samsung expanded its Samsung Care+ extended warranty program to include a broader range of smart home appliances, adding new coverage for software updates and screen malfunctions.
- In November 2025, Circuitry.ai and Service Xcelerator announced a strategic partnership to deploy AI-driven solutions to revolutionize warranty claims operations, offering predictive repair insights and expedited processing.
Dive into Technavio’s robust research methodology, blending expert interviews, extensive data synthesis, and validated models for unparalleled US Extended Warranty Market insights. See full methodology.
| Market Scope | |
|---|---|
| Page number | 187 |
| Base year | 2025 |
| Historic period | 2020-2024 |
| Forecast period | 2026-2030 |
| Growth momentum & CAGR | Accelerate at a CAGR of 5.1% |
| Market growth 2026-2030 | USD 15458.8 million |
| Market structure | Fragmented |
| YoY growth 2025-2026(%) | 4.6% |
| Key countries | US |
| Competitive landscape | Leading Companies, Market Positioning of Companies, Competitive Strategies, and Industry Risks |
Research Analyst Overview
- The extended warranty market in US is maturing beyond a simple post-sale add-on into a strategic component of the product lifecycle, driven by technological integration and consumer demand for financial predictability. A key boardroom-level focus is the adoption of a service-oriented business model, where a protection plan functions as a powerful customer retention tool.
- This requires significant investment in a digital claims platform and sophisticated claims management to handle everything from powertrain protection to accidental damage protection. The industry is leveraging embedded insurance and IoT-enabled warranty systems for predictive maintenance, fundamentally changing risk assessment.
- For underwriters, managing the impact of right to repair legislation and the rising cost of both OEM parts and aftermarket parts is critical for maintaining profitability. The shift toward parametric insurance, which can reduce claims processing times by up to 40%, exemplifies the market's move toward efficiency.
- Success now depends on offering a superior maintenance agreement or service contract managed by skilled third-party administrators and backed by solid underwriting reserves and efficient repair logistics with certified repair technicians.
What are the Key Data Covered in this US Extended Warranty Market Research and Growth Report?
-
What is the expected growth of the US Extended Warranty Market between 2026 and 2030?
-
USD 15.46 billion, at a CAGR of 5.1%
-
-
What segmentation does the market report cover?
-
The report is segmented by Device (Automobile, Consumer electronics, Home appliances, Mobile devices and PCs, and Others), End-user (Businesses, and Individuals), Type (Standard extended warranty, Comprehensive extended warranty, and Accidental damage protection) and Geography (North America)
-
-
Which regions are analyzed in the report?
-
North America
-
-
What are the key growth drivers and market challenges?
-
High demand for household appliances, Macroeconomic volatility and inflation of component and labor expenses
-
-
Who are the major players in the US Extended Warranty Market?
-
AFC Home Club, Allianz SE, American Home Shield Corp., American International Group, AmTrust Financial Services, Assurant Inc., Asurion LLC, AXA Group, Carchex LLC, CarShield, Chubb Ltd., Cinch Home Services Inc., Endurance Warranty Services, Fidelity Warranty Services, JM and A Group, Liberty Home Guard, Safe Guard Products LLC, The Allstate Corp. and Upsie
-
Market Research Insights
- The market is shaped by a dynamic interplay between consumer demand for financial security and intense operational pressures. An extended service contract is increasingly viewed as a critical budget stability tool, yet providers face significant margin compression.
- This is driven by external factors such as repair cost inflation, where key component prices have risen by over 15%, and new tariffs adding up to 25% on other parts. In response, leading firms are leveraging service delivery automation and data-driven risk management as part of a digital-first service model.
- This strategy aims to enhance the claims experience and offer personalized warranty solutions, turning a simple post-purchase revenue opportunity into a long-term customer engagement period. This pivot is essential for managing operational costs while addressing complex consumer protection regulations.
We can help! Our analysts can customize this us extended warranty market research report to meet your requirements.
 RIA -
RIA - 
