Face Oils Market Analysis Europe, North America, APAC, South America, Middle East and Africa - US, China, Japan, Germany, UK - Size and Forecast 2024-2028

Face Oils Market Analysis Europe, North America, APAC, South America, Middle East and Africa - US, China, Japan, Germany, UK - Size and Forecast 2024-2028

Published: Feb 2024 162 Pages SKU: IRTNTR77626

Market Overview at a Glance

$355.2 Mn
Market Opportunity
5.77%
CAGR
5.23
YoY growth 2023-2024(%)

Face Oils Market Size 2024-2028 

The face oils market size is forecast to increase by USD 355.2 million at a CAGR of 5.77% between 2023 and 2028.

  • The market is experiencing significant growth due to several key drivers. First, there is an increasing awareness and concern among consumers, particularly female customers, regarding the use of natural and organic ingredients in their skincare products. This trend is driven in part by the desire to avoid synthetic ingredients linked to reproductive disorders and asthma. Additionally, the popularity of aromatherapy continues to rise, making face moisturizing oils an attractive option for those seeking the therapeutic benefits of essential oils. However, the market also faces challenges. The proliferation of counterfeit products for face oils, available both online and offline, poses a significant threat to market players. In response, many companies are focusing on offering paraben-free and cruelty-free options to meet the growing demand for natural and ethically-sourced products. Luxury face oils, in particular, are expected to see strong growth as consumers are willing to pay a premium for high-quality, natural ingredients and effective skincare solutions.

What will be the Size of the Face Oils Market During the Forecast Period?

Face Oils Market Size

 Request Free Sample

  • The market is witnessing significant growth due to the increasing preference for natural and organic skincare products. Consumers are increasingly seeking out face oils infused with natural ingredients, such as jojoba oil, rosehip oil, argan oil, olive oil, almond oil, and coconut oil, for their anti-aging, hydration, blemish removal, and skin restoration properties. Hydration is a key concern for consumers, leading to the popularity of face oils as an alternative to traditional moisturizers. These oils provide long-lasting hydration and help to lock in moisture, making them an essential component of many skincare routines.
  • Advanced extraction techniques are being used to create unique formulations that cater to various skin sensitivities and concerns. For instance, retinol and vitamin C are popular active ingredients in face oils, known for their anti-aging properties. Hyaluronic acid is another sought-after ingredient for its ability to retain water and keep the skin hydrated. The e-commerce sector is driving the growth of the market in the US, with consumers increasingly turning to online platforms to purchase their skincare products. This trend is expected to continue, as the convenience and accessibility offered by e-commerce platforms appeal to busy consumers. Labeling and allergen awareness are crucial factors influencing consumer purchasing decisions in the market.

How is this Face Oils Industry segmented and which is the largest segment?

The face oils industry research report provides comprehensive data (region-wise segment analysis), with forecasts and estimates in "USD million" for the period 2024-2028, as well as historical data from 2018-2022 for the following segments.

  • Product
    • Anti-aging beauty oils
    • Facial cleansing oils
    • Face moisturizing oils
    • Pre-shave oils
  • Distribution Channel
    • Offline
    • Online
  • Geography
    • Europe
      • Germany
      • UK
    • North America
      • US
    • APAC
      • China
      • Japan
    • South America
    • Middle East and Africa

By Product Insights

  • The anti-aging beauty oils segment is estimated to witness significant growth during the forecast period.

Anti-aging face oils are integral components of skincare routines, catering to consumers seeking to combat the signs of aging. These oils offer unique formulations, often incorporating natural and organic ingredients, such as antioxidants, vitamins, and essential fatty acids. The skincare industry provides a diverse range of anti-aging face oils, each with distinct benefits. Advanced extraction techniques ensure the preservation of these beneficial ingredients. Skin sensitivities and allergen awareness are considered during the production process, with clear labeling to ensure consumer transparency.

Synthetic chemicals are minimally used, allowing consumers to trust the authenticity and purity of these skincare products. Incorporating anti-aging face oils into your skincare routine can lead to a more youthful and radiant complexion, protecting the skin from environmental damage.

Face Oils Market Size

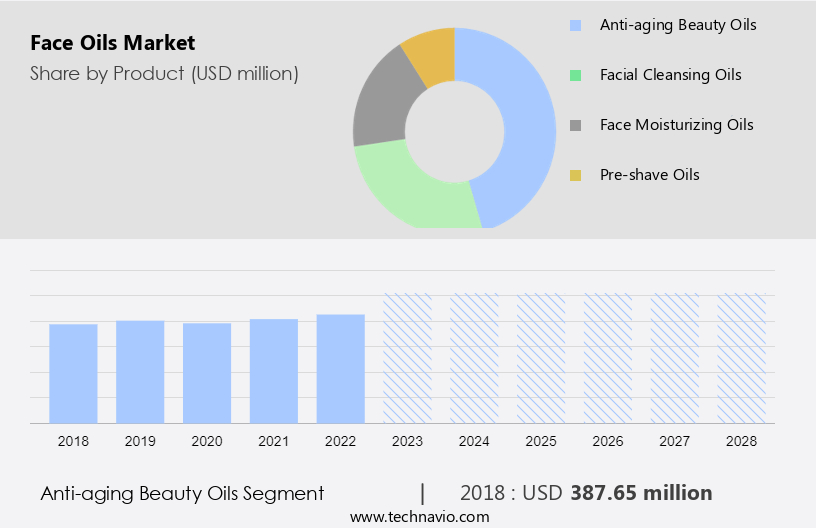
Get a glance at the  Face Oils Industry report of share of various segments Request Free Sample

The anti-aging beauty oils segment was valued at USD 387.65 million in 2018 and showed a gradual increase during the forecast period.
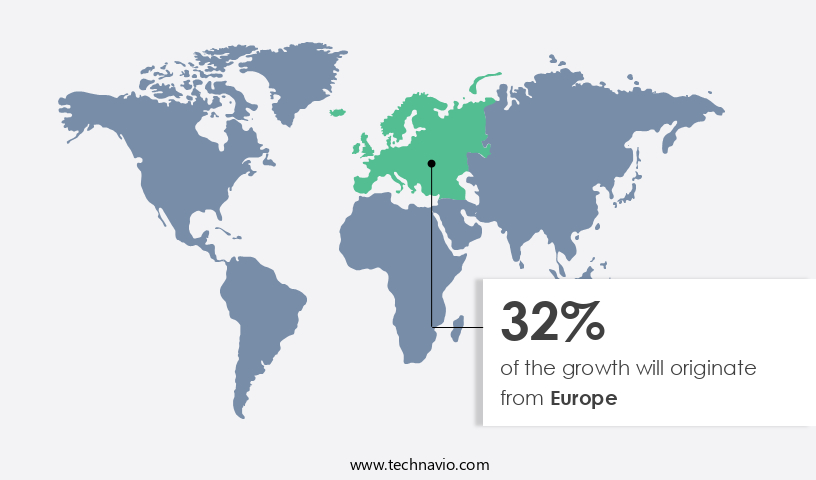
Regional Analysis

  • Europe is estimated to contribute 32% to the growth of the global market during the forecast period.

Technavio's analysts have elaborately explained the regional trends and drivers that shape the market during the forecast period.

Face Oils Market Share by Geography

For more insights on the market share of various regions, Request Free Sample

Face oils have gained significant popularity in Europe due to their numerous benefits for skin health and their applications in various industries, particularly in cosmetics. Some of the major European markets for face oils include Germany, the UK, France, and Spain. The increasing trend of aromatherapy in Europe is also contributing to the growth of the market. Aromatherapy, which is widely practiced as an alternative medicine in countries such as France, Germany, the UK, Austria, and Switzerland, is driving the demand for face oils. As European consumers become more health-conscious and seek natural alternatives to traditional skincare products, the importation of face oils has increased.

Jojoba oil, rosehip oil, and argan oil are among the most popular types of face oils in Europe, prized for their anti-aging, hydrating, and blemish-removal properties. These oils are essential for skin restoration and moisturizing, making them a staple in many European skincare routines.

Market Dynamics

Our face oils market researchers analyzed the data with 2023 as the base year, along with the key drivers, trends, and challenges. A holistic analysis of drivers will help companies refine their marketing strategies to gain a competitive advantage.

What are the key market drivers leading to the rise in the adoption of Face Oils Industry?

Increasing demand for natural and organic cosmetics is the key driver of the market.

  • The market is experiencing significant growth due to the increasing preference for natural and organic skincare products among consumers. With a greater focus on clean beauty, individuals are seeking formulations free of synthetic chemicals and potentially harmful substances. In response, leading beauty brands are providing face oils in natural and organic formulations, such as "Josie Maran Argan Oil" by Josie Maran Cosmetics.
  • This popular product is renowned for its use of 100% pure argan oil, a natural and organic ingredient rich in antioxidants and essential fatty acids. These properties provide intense hydration and anti-aging benefits. Other popular natural ingredients in face oils include retinol, vitamin C, and hyaluronic acid. Additionally, face masks, face mists, serums, and moisturizers infused with these ingredients are also gaining popularity. Consumers can also opt for natural oils like olive oil and almond oil for their skincare needs. 

What are the market trends shaping the Face oil industry?

Rising demand for aromatherapy is the upcoming trend in the market.

  • The market is witnessing significant growth due to the increasing trend of aromatherapy. Aromatherapy, which involves the use of natural extracts like essential oils, is gaining popularity for its ability to improve both physical and emotional well-being. Face oils infused with these aromatic essential oils offer numerous skincare benefits and a pleasing fragrance, making them a preferred choice among female customers.
  • Leading brands are responding to this trend by incorporating aromatherapy ingredients into their face oil formulations.  This trend is driving innovation in the market, with many companies introducing paraben-free and cruelty-free face oils to cater to the demands of health-conscious consumers. These products are widely available through both online stores and offline channels. 

What challenges does Face Oils Industry face during the growth?

The increasing availability of counterfeit products for face oils is a key challenge affecting the industry's growth.

  • The market is experiencing a rise in popularity due to the increasing demand for plant-based skincare products. Coconut oil and ginger extract are among the preferred natural ingredients in these oils, offering benefits such as antioxidant properties and protection against UV radiation. However, the market faces challenges, including the proliferation of counterfeit products. These counterfeit oils, which may contain undisclosed or harmful ingredients, can lead to allergic reactions and skin infections.
  • Consumers often purchase these products through e-commerce platforms and social media, increasing the risk of encountering counterfeits. The credibility and safety of genuine face oil brands may be negatively impacted by these counterfeits, leading to a loss of consumer trust. To mitigate this issue, consumers need to verify the authenticity of the products and purchase from reputable sources. 

Exclusive Customer Landscape

The face oils market forecasting report includes the adoption lifecycle of the market, covering from the innovator's stage to the laggard's stage. It focuses on adoption rates in different regions based on penetration. Furthermore, the market report also includes key purchase criteria and drivers of price sensitivity to help companies evaluate and develop their market growth analysis strategies.

Face Oils Market Share by Geography

 Customer Landscape

Key Companies & Market Insights

Companies are implementing various strategies, such as strategic alliances, market forecast, partnerships, mergers and acquisitions, geographical expansion, and product/service launches, to enhance their presence in the industry. The face oils industry research and growth report includes detailed analyses of the competitive landscape of the market and information about key companies, including:

  • Amway Corp.
  • Beiersdorf AG
  • Burberry Group Plc
  • Chanel Ltd.
  • Chatters GP Inc.
  • DeBelle Cosmetix Online Store
  • Herbivore Botanicals
  • Himalaya Global Holdings Ltd.
  • Johnson and Johnson
  • Josie Maran Cosmetics LLC
  • Kao Corp.
  • Khadi Natural
  • LOreal SA
  • Mary Kay Inc.
  • Natura and Co Holding SA
  • PEP Technologies Pvt. Ltd.
  • PUIG S.L.
  • Shiseido Co. Ltd.
  • Sunday Riley
  • The Body Shop International Ltd.
  • The Estee Lauder Companies Inc.
  • The Procter and Gamble Co.
  • Unilever PLC
  • AMOREPACIFIC Group Inc.

Qualitative and quantitative analysis of companies has been conducted to help clients understand the wider business environment as well as the strengths and weaknesses of key industry players. Data is qualitatively analyzed to categorize companies as pure play, category-focused, industry-focused, and diversified; it is quantitatively analyzed to categorize companies as dominant, leading, strong, tentative, and weak.

Research Analyst Overview

Face oils have gained immense popularity in the skincare market due to their numerous benefits for various skin concerns. These oils offer anti-aging properties, hydration, blemish removal, and skin restoration. Jojoba oil, rosehip oil, argan oil, retinol, vitamin C, hyaluronic acid, and essential oils like ginger extract and vitamin E are some of the commonly used face oils. Face masks, mists, serums, and moisturizers are the popular forms of face oils. The market for face oils is driven by the increasing demand for plant-based skincare products and the rising awareness of the harmful effects of synthetic chemicals. Consumers prefer natural and organic ingredients, and unique formulations using advanced extraction techniques.

Moreover, skin sensitivities, allergic reactions, and skin infections are concerns for some consumers, leading to labeling and allergen awareness and product safety becoming important factors. The market caters to both male and female customers, with men's skincare market growing due to the increasing focus on grooming and self-care. Personalized skincare solutions and customization options are popular trends, with influencers and beauty bloggers playing a significant role in promoting these products. Face oils offer various functions, including hydration, moisturizing, and antioxidant properties. They help protect the skin from UV radiation and environmental impact. Fatty acids like lauric acid and antioxidants are essential components of face oils. The market for face oils is expanding, with e-commerce and social media playing a significant role in its growth. Paraben-free and cruelty-free are preferred choices for many consumers.

Face Oils Market Scope

Report Coverage

Details

Page number

162

Base year

2023

Historic period

2018-2022

Forecast period

2024-2028

Growth momentum & CAGR

Accelerate at a CAGR of 5.77%

Market Growth 2024-2028

USD 355.2 million

Market structure

Fragmented

YoY growth 2023-2024(%)

5.23

Key countries

US, China, Japan, Germany, and UK

Competitive landscape

Leading Companies, Market Positioning of Companies, Competitive Strategies, and Industry Risks

Request Free Sample

What are the Key Data Covered in this Market Research and Growth Report?

  • CAGR of the Face Oils industry during the forecast period
  • Detailed information on factors that will drive the market growth and forecasting between 2024 and 2028
  • Precise estimation of the size of the market  and its contribution of the industry in focus to the parent market
  • Accurate predictions about upcoming market growth and trends and changes in consumer behaviour
  • Growth of the market across Europe, North America, APAC, South America, and Middle East and Africa
  • Thorough analysis of the market's competitive landscape and detailed information about companies
  • Comprehensive analysis of factors that will challenge the growth of industry companies

We can help! Our analysts can customize this market research report to meet your requirements. Get in touch

1 Executive Summary

  • 1.1 Market overview
    • Exhibit 01: Executive Summary – Chart on Market Overview
    • Exhibit 02: Executive Summary – Data Table on Market Overview
    • Exhibit 03: Executive Summary – Chart on Global Market Characteristics
    • Exhibit 04: Executive Summary – Chart on Market by Geography
    • Exhibit 05: Executive Summary – Chart on Market Segmentation by Product
    • Exhibit 06: Executive Summary – Chart on Market Segmentation by Distribution Channel
    • Exhibit 07: Executive Summary – Chart on Incremental Growth
    • Exhibit 08: Executive Summary – Data Table on Incremental Growth
    • Exhibit 09: Executive Summary – Chart on Vendor Market Positioning

2 Market Landscape

  • 2.1 Market ecosystem
    • Exhibit 10: Parent market
    • Exhibit 11: Market Characteristics

3 Market Sizing

  • 3.1 Market definition
    • Exhibit 12: Offerings of vendors included in the market definition
  • 3.2 Market segment analysis
    • Exhibit 13: Market segments
  • 3.3 Market size 2023
    • 3.4 Market outlook: Forecast for 2023-2028
      • Exhibit 14: Chart on Global - Market size and forecast 2023-2028 ($ million)
      • Exhibit 15: Data Table on Global - Market size and forecast 2023-2028 ($ million)
      • Exhibit 16: Chart on Global Market: Year-over-year growth 2023-2028 (%)
      • Exhibit 17: Data Table on Global Market: Year-over-year growth 2023-2028 (%)

    4 Historic Market Size

    • 4.1 Global face oils market 2018 - 2022
      • Exhibit 18: Historic Market Size – Data Table on global face oils market 2018 - 2022 ($ million)
    • 4.2 Product Segment Analysis 2018 - 2022
      • Exhibit 19: Historic Market Size – Product Segment 2018 - 2022 ($ million)
    • 4.3 Distribution Channel Segment Analysis 2018 - 2022
      • Exhibit 20: Historic Market Size – Distribution Channel Segment 2018 - 2022 ($ million)
    • 4.4 Geography Segment Analysis 2018 - 2022
      • Exhibit 21: Historic Market Size – Geography Segment 2018 - 2022 ($ million)
    • 4.5 Country Segment Analysis 2018 - 2022
      • Exhibit 22: Historic Market Size – Country Segment 2018 - 2022 ($ million)

    5 Five Forces Analysis

    • 5.1 Five forces summary
      • Exhibit 23: Five forces analysis - Comparison between 2023 and 2028
    • 5.2 Bargaining power of buyers
      • Exhibit 24: Chart on Bargaining power of buyers – Impact of key factors 2023 and 2028
    • 5.3 Bargaining power of suppliers
      • Exhibit 25: Bargaining power of suppliers – Impact of key factors in 2023 and 2028
    • 5.4 Threat of new entrants
      • Exhibit 26: Threat of new entrants – Impact of key factors in 2023 and 2028
    • 5.5 Threat of substitutes
      • Exhibit 27: Threat of substitutes – Impact of key factors in 2023 and 2028
    • 5.6 Threat of rivalry
      • Exhibit 28: Threat of rivalry – Impact of key factors in 2023 and 2028
    • 5.7 Market condition
      • Exhibit 29: Chart on Market condition - Five forces 2023 and 2028

    6 Market Segmentation by Product

    • 6.1 Market segments
      • Exhibit 30: Chart on Product - Market share 2023-2028 (%)
      • Exhibit 31: Data Table on Product - Market share 2023-2028 (%)
    • 6.2 Comparison by Product
      • Exhibit 32: Chart on Comparison by Product
      • Exhibit 33: Data Table on Comparison by Product
    • 6.3 Anti-aging beauty oils - Market size and forecast 2023-2028
      • Exhibit 34: Chart on Anti-aging beauty oils - Market size and forecast 2023-2028 ($ million)
      • Exhibit 35: Data Table on Anti-aging beauty oils - Market size and forecast 2023-2028 ($ million)
      • Exhibit 36: Chart on Anti-aging beauty oils - Year-over-year growth 2023-2028 (%)
      • Exhibit 37: Data Table on Anti-aging beauty oils - Year-over-year growth 2023-2028 (%)
    • 6.4 Facial cleansing oils - Market size and forecast 2023-2028
      • Exhibit 38: Chart on Facial cleansing oils - Market size and forecast 2023-2028 ($ million)
      • Exhibit 39: Data Table on Facial cleansing oils - Market size and forecast 2023-2028 ($ million)
      • Exhibit 40: Chart on Facial cleansing oils - Year-over-year growth 2023-2028 (%)
      • Exhibit 41: Data Table on Facial cleansing oils - Year-over-year growth 2023-2028 (%)
    • 6.5 Face moisturizing oils - Market size and forecast 2023-2028
      • Exhibit 42: Chart on Face moisturizing oils - Market size and forecast 2023-2028 ($ million)
      • Exhibit 43: Data Table on Face moisturizing oils - Market size and forecast 2023-2028 ($ million)
      • Exhibit 44: Chart on Face moisturizing oils - Year-over-year growth 2023-2028 (%)
      • Exhibit 45: Data Table on Face moisturizing oils - Year-over-year growth 2023-2028 (%)
    • 6.6 Pre-shave oils - Market size and forecast 2023-2028
      • Exhibit 46: Chart on Pre-shave oils - Market size and forecast 2023-2028 ($ million)
      • Exhibit 47: Data Table on Pre-shave oils - Market size and forecast 2023-2028 ($ million)
      • Exhibit 48: Chart on Pre-shave oils - Year-over-year growth 2023-2028 (%)
      • Exhibit 49: Data Table on Pre-shave oils - Year-over-year growth 2023-2028 (%)
    • 6.7 Market opportunity by Product
      • Exhibit 50: Market opportunity by Product ($ million)
      • Exhibit 51: Data Table on Market opportunity by Product ($ million)

    7 Market Segmentation by Distribution Channel

    • 7.1 Market segments
      • Exhibit 52: Chart on Distribution Channel - Market share 2023-2028 (%)
      • Exhibit 53: Data Table on Distribution Channel - Market share 2023-2028 (%)
    • 7.2 Comparison by Distribution Channel
      • Exhibit 54: Chart on Comparison by Distribution Channel
      • Exhibit 55: Data Table on Comparison by Distribution Channel
    • 7.3 Offline - Market size and forecast 2023-2028
      • Exhibit 56: Chart on Offline - Market size and forecast 2023-2028 ($ million)
      • Exhibit 57: Data Table on Offline - Market size and forecast 2023-2028 ($ million)
      • Exhibit 58: Chart on Offline - Year-over-year growth 2023-2028 (%)
      • Exhibit 59: Data Table on Offline - Year-over-year growth 2023-2028 (%)
    • 7.4 Online - Market size and forecast 2023-2028
      • Exhibit 60: Chart on Online - Market size and forecast 2023-2028 ($ million)
      • Exhibit 61: Data Table on Online - Market size and forecast 2023-2028 ($ million)
      • Exhibit 62: Chart on Online - Year-over-year growth 2023-2028 (%)
      • Exhibit 63: Data Table on Online - Year-over-year growth 2023-2028 (%)
    • 7.5 Market opportunity by Distribution Channel
      • Exhibit 64: Market opportunity by Distribution Channel ($ million)
      • Exhibit 65: Data Table on Market opportunity by Distribution Channel ($ million)

    8 Customer Landscape

    • 8.1 Customer landscape overview
      • Exhibit 66: Analysis of price sensitivity, lifecycle, customer purchase basket, adoption rates, and purchase criteria

    9 Geographic Landscape

    • 9.1 Geographic segmentation
      • Exhibit 67: Chart on Market share by geography 2023-2028 (%)
      • Exhibit 68: Data Table on Market share by geography 2023-2028 (%)
    • 9.2 Geographic comparison
      • Exhibit 69: Chart on Geographic comparison
      • Exhibit 70: Data Table on Geographic comparison
    • 9.3 Europe - Market size and forecast 2023-2028
      • Exhibit 71: Chart on Europe - Market size and forecast 2023-2028 ($ million)
      • Exhibit 72: Data Table on Europe - Market size and forecast 2023-2028 ($ million)
      • Exhibit 73: Chart on Europe - Year-over-year growth 2023-2028 (%)
      • Exhibit 74: Data Table on Europe - Year-over-year growth 2023-2028 (%)
    • 9.4 North America - Market size and forecast 2023-2028
      • Exhibit 75: Chart on North America - Market size and forecast 2023-2028 ($ million)
      • Exhibit 76: Data Table on North America - Market size and forecast 2023-2028 ($ million)
      • Exhibit 77: Chart on North America - Year-over-year growth 2023-2028 (%)
      • Exhibit 78: Data Table on North America - Year-over-year growth 2023-2028 (%)
    • 9.5 APAC - Market size and forecast 2023-2028
      • Exhibit 79: Chart on APAC - Market size and forecast 2023-2028 ($ million)
      • Exhibit 80: Data Table on APAC - Market size and forecast 2023-2028 ($ million)
      • Exhibit 81: Chart on APAC - Year-over-year growth 2023-2028 (%)
      • Exhibit 82: Data Table on APAC - Year-over-year growth 2023-2028 (%)
    • 9.6 South America - Market size and forecast 2023-2028
      • Exhibit 83: Chart on South America - Market size and forecast 2023-2028 ($ million)
      • Exhibit 84: Data Table on South America - Market size and forecast 2023-2028 ($ million)
      • Exhibit 85: Chart on South America - Year-over-year growth 2023-2028 (%)
      • Exhibit 86: Data Table on South America - Year-over-year growth 2023-2028 (%)
    • 9.7 Middle East and Africa - Market size and forecast 2023-2028
      • Exhibit 87: Chart on Middle East and Africa - Market size and forecast 2023-2028 ($ million)
      • Exhibit 88: Data Table on Middle East and Africa - Market size and forecast 2023-2028 ($ million)
      • Exhibit 89: Chart on Middle East and Africa - Year-over-year growth 2023-2028 (%)
      • Exhibit 90: Data Table on Middle East and Africa - Year-over-year growth 2023-2028 (%)
    • 9.8 US - Market size and forecast 2023-2028
      • Exhibit 91: Chart on US - Market size and forecast 2023-2028 ($ million)
      • Exhibit 92: Data Table on US - Market size and forecast 2023-2028 ($ million)
      • Exhibit 93: Chart on US - Year-over-year growth 2023-2028 (%)
      • Exhibit 94: Data Table on US - Year-over-year growth 2023-2028 (%)
    • 9.9 Germany - Market size and forecast 2023-2028
      • Exhibit 95: Chart on Germany - Market size and forecast 2023-2028 ($ million)
      • Exhibit 96: Data Table on Germany - Market size and forecast 2023-2028 ($ million)
      • Exhibit 97: Chart on Germany - Year-over-year growth 2023-2028 (%)
      • Exhibit 98: Data Table on Germany - Year-over-year growth 2023-2028 (%)
    • 9.10 China - Market size and forecast 2023-2028
      • Exhibit 99: Chart on China - Market size and forecast 2023-2028 ($ million)
      • Exhibit 100: Data Table on China - Market size and forecast 2023-2028 ($ million)
      • Exhibit 101: Chart on China - Year-over-year growth 2023-2028 (%)
      • Exhibit 102: Data Table on China - Year-over-year growth 2023-2028 (%)
    • 9.11 UK - Market size and forecast 2023-2028
      • Exhibit 103: Chart on UK - Market size and forecast 2023-2028 ($ million)
      • Exhibit 104: Data Table on UK - Market size and forecast 2023-2028 ($ million)
      • Exhibit 105: Chart on UK - Year-over-year growth 2023-2028 (%)
      • Exhibit 106: Data Table on UK - Year-over-year growth 2023-2028 (%)
    • 9.12 Japan - Market size and forecast 2023-2028
      • Exhibit 107: Chart on Japan - Market size and forecast 2023-2028 ($ million)
      • Exhibit 108: Data Table on Japan - Market size and forecast 2023-2028 ($ million)
      • Exhibit 109: Chart on Japan - Year-over-year growth 2023-2028 (%)
      • Exhibit 110: Data Table on Japan - Year-over-year growth 2023-2028 (%)
    • 9.13 Market opportunity by geography
      • Exhibit 111: Market opportunity by geography ($ million)
      • Exhibit 112: Data Tables on Market opportunity by geography ($ million)

    10 Drivers, Challenges, and Trends

    • 10.1 Market drivers
      • 10.2 Market challenges
        • 10.3 Impact of drivers and challenges
          • Exhibit 113: Impact of drivers and challenges in 2023 and 2028
        • 10.4 Market trends

          11 Vendor Landscape

          • 11.1 Overview
            • 11.2 Vendor landscape
              • Exhibit 114: Overview on Criticality of inputs and Factors of differentiation
            • 11.3 Landscape disruption
              • Exhibit 115: Overview on factors of disruption
            • 11.4 Industry risks
              • Exhibit 116: Impact of key risks on business

            12 Vendor Analysis

            • 12.1 Vendors covered
              • Exhibit 117: Vendors covered
            • 12.2 Market positioning of vendors
              • Exhibit 118: Matrix on vendor position and classification
            • 12.3 Amway Corp.
              • Exhibit 119: Amway Corp. - Overview
              • Exhibit 120: Amway Corp. - Product / Service
              • Exhibit 121: Amway Corp. - Key news
              • Exhibit 122: Amway Corp. - Key offerings
            • 12.4 Beiersdorf AG
              • Exhibit 123: Beiersdorf AG - Overview
              • Exhibit 124: Beiersdorf AG - Business segments
              • Exhibit 125: Beiersdorf AG - Key news
              • Exhibit 126: Beiersdorf AG - Key offerings
              • Exhibit 127: Beiersdorf AG - Segment focus
            • 12.5 Burberry Group Plc
              • Exhibit 128: Burberry Group Plc - Overview
              • Exhibit 129: Burberry Group Plc - Business segments
              • Exhibit 130: Burberry Group Plc - Key offerings
              • Exhibit 131: Burberry Group Plc - Segment focus
            • 12.6 Chanel Ltd.
              • Exhibit 132: Chanel Ltd. - Overview
              • Exhibit 133: Chanel Ltd. - Product / Service
              • Exhibit 134: Chanel Ltd. - Key offerings
            • 12.7 Chatters GP Inc.
              • Exhibit 135: Chatters GP Inc. - Overview
              • Exhibit 136: Chatters GP Inc. - Product / Service
              • Exhibit 137: Chatters GP Inc. - Key offerings
            • 12.8 Himalaya Global Holdings Ltd.
              • Exhibit 138: Himalaya Global Holdings Ltd. - Overview
              • Exhibit 139: Himalaya Global Holdings Ltd. - Product / Service
              • Exhibit 140: Himalaya Global Holdings Ltd. - Key offerings
            • 12.9 Johnson and Johnson
              • Exhibit 141: Johnson and Johnson - Overview
              • Exhibit 142: Johnson and Johnson - Business segments
              • Exhibit 143: Johnson and Johnson - Key news
              • Exhibit 144: Johnson and Johnson - Key offerings
              • Exhibit 145: Johnson and Johnson - Segment focus
            • 12.10 Kao Corp.
              • Exhibit 146: Kao Corp. - Overview
              • Exhibit 147: Kao Corp. - Business segments
              • Exhibit 148: Kao Corp. - Key offerings
              • Exhibit 149: Kao Corp. - Segment focus
            • 12.11 LOreal SA
              • Exhibit 150: LOreal SA - Overview
              • Exhibit 151: LOreal SA - Business segments
              • Exhibit 152: LOreal SA - Key news
              • Exhibit 153: LOreal SA - Key offerings
              • Exhibit 154: LOreal SA - Segment focus
            • 12.12 Natura and Co Holding SA
              • Exhibit 155: Natura and Co Holding SA - Overview
              • Exhibit 156: Natura and Co Holding SA - Business segments
              • Exhibit 157: Natura and Co Holding SA - Key offerings
              • Exhibit 158: Natura and Co Holding SA - Segment focus
            • 12.13 PEP Technologies Pvt. Ltd.
              • Exhibit 159: PEP Technologies Pvt. Ltd. - Overview
              • Exhibit 160: PEP Technologies Pvt. Ltd. - Product / Service
              • Exhibit 161: PEP Technologies Pvt. Ltd. - Key offerings
            • 12.14 Shiseido Co. Ltd.
              • Exhibit 162: Shiseido Co. Ltd. - Overview
              • Exhibit 163: Shiseido Co. Ltd. - Business segments
              • Exhibit 164: Shiseido Co. Ltd. - Key offerings
              • Exhibit 165: Shiseido Co. Ltd. - Segment focus
            • 12.15 The Estee Lauder Companies Inc.
              • Exhibit 166: The Estee Lauder Companies Inc. - Overview
              • Exhibit 167: The Estee Lauder Companies Inc. - Product / Service
              • Exhibit 168: The Estee Lauder Companies Inc. - Key offerings
            • 12.16 The Procter and Gamble Co.
              • Exhibit 169: The Procter and Gamble Co. - Overview
              • Exhibit 170: The Procter and Gamble Co. - Business segments
              • Exhibit 171: The Procter and Gamble Co. - Key news
              • Exhibit 172: The Procter and Gamble Co. - Key offerings
              • Exhibit 173: The Procter and Gamble Co. - Segment focus
            • 12.17 Unilever PLC
              • Exhibit 174: Unilever PLC - Overview
              • Exhibit 175: Unilever PLC - Business segments
              • Exhibit 176: Unilever PLC - Key news
              • Exhibit 177: Unilever PLC - Key offerings
              • Exhibit 178: Unilever PLC - Segment focus

            13 Appendix

            • 13.1 Scope of the report
              • 13.2 Inclusions and exclusions checklist
                • Exhibit 179: Inclusions checklist
                • Exhibit 180: Exclusions checklist
              • 13.3 Currency conversion rates for US$
                • Exhibit 181: Currency conversion rates for US$
              • 13.4 Research methodology
                • Exhibit 182: Research methodology
                • Exhibit 183: Validation techniques employed for market sizing
                • Exhibit 184: Information sources
              • 13.5 List of abbreviations
                • Exhibit 185: List of abbreviations

              Research Methodology

              Technavio presents a detailed picture of the market by way of study, synthesis, and summation of data from multiple sources. The analysts have presented the various facets of the market with a particular focus on identifying the key industry influencers. The data thus presented is comprehensive, reliable, and the result of extensive research, both primary and secondary.

              INFORMATION SOURCES

              Primary sources

              • Manufacturers and suppliers
              • Channel partners
              • Industry experts
              • Strategic decision makers

              Secondary sources

              • Industry journals and periodicals
              • Government data
              • Financial reports of key industry players
              • Historical data
              • Press releases

              DATA ANALYSIS

              Data Synthesis

              • Collation of data
              • Estimation of key figures
              • Analysis of derived insights

              Data Validation

              • Triangulation with data models
              • Reference against proprietary databases
              • Corroboration with industry experts

              REPORT WRITING

              Qualitative

              • Market drivers
              • Market challenges
              • Market trends
              • Five forces analysis

              Quantitative

              • Market size and forecast
              • Market segmentation
              • Geographical insights
              • Competitive landscape

              Interested in this report?

              Get your sample now to see our research methodology and insights!

              Download Now

              Frequently Asked Questions

              Face Oils market growth will increase by $ 355.2 mn during 2024-2028 .

              The Face Oils market is expected to grow at a CAGR of 5.77% during 2024-2028 .

              Face Oils market is segmented by Product( Anti-aging beauty oils, Facial cleansing oils, Face moisturizing oils, Pre-shave oils) Distribution Channel( Offline, Online)

              Amway Corp., Beiersdorf AG, Burberry Group Plc, Chanel Ltd., Chatters GP Inc., DeBelle Cosmetix Online Store, Herbivore Botanicals, Himalaya Global Holdings Ltd., Johnson and Johnson, Josie Maran Cosmetics LLC, Kao Corp., Khadi Natural, LOreal SA, Mary Kay Inc., Natura and Co Holding SA, PEP Technologies Pvt. Ltd., PUIG S.L., Shiseido Co. Ltd., Sunday Riley, The Body Shop International Ltd., The Estee Lauder Companies Inc., The Procter and Gamble Co., Unilever PLC, AMOREPACIFIC Group Inc. are a few of the key vendors in the Face Oils market.

              Europe will register the highest growth rate of 32% among the other regions. Therefore, the Face Oils market in Europe is expected to garner significant business opportunities for the vendors during the forecast period.

              US, China, Japan, Germany, UK

              • Increasing demand for natural and organic cosmeticsThe growing demand for natural and organic cosmetics is a major driver of the global face oils market. Consumers are becoming more aware of the ingredients in their skincare products is the driving factor this market.
              • looking for formulations free of synthetic chemicals and potentially harmful substances. This trend toward natural and organic products extends to face oils is the driving factor this market.
              • as people prioritize skincare options that reflect their desire for clean beauty. Leading beauty vendors have responded to this demand by providing face oils in natural and organic formulations. One notable example is "Josie Maran Argan Oil" by Josie Maran Cosmetics. This product is well-known for its use of 100% pure argan oil is the driving factor this market.
              • a natural and organic ingredient high in antioxidants and essential fatty acids that provide intense hydration and anti-aging properties. "Virgin Marula Luxury Facial Oil" is another notable product from the vendor DRUNK ELEPHANT. DRUNK ELEPHANT focuses on clean and natural formulations is the driving factor this market.
              • and its facial oils are made with pure marula oil is the driving factor this market.
              • which is known for its moisturizing and skin-nourishing properties. Consumers prefer these products not only for their effectiveness but also for their ingredient transparency and environmentally friendly practices. The global face oils market is undergoing a paradigm shift as more vendors recognize that the demand for natural and organic cosmetics is a significant influencer of consumer preferences. As a result is the driving factor this market.
              • the market is expected to grow further as consumers prioritize clean is the driving factor this market.
              • sustainable is the driving factor this market.
              • and naturally derived options in their skincare routines. The rising awareness about hair- is the driving factor this market.
              • skin- is the driving factor this market.
              • and health-related problems caused by synthetic beauty and personal care (BPC) products has increased the demand for natural and organic face oils. The regular use of synthetic face oils can cause various hair- is the driving factor this market.
              • skin- is the driving factor this market.
              • and health-related issues is the driving factor this market.
              • such as skin irritation is the driving factor this market.
              • skin allergies is the driving factor this market.
              • nerve damage is the driving factor this market.
              • chemical burns is the driving factor this market.
              • and various hormonal disorders. Organic face oils are made from natural and organic ingredients is the driving factor this market.
              • such as plant extracts and natural oils. Other natural ingredients used in organic face oils include aloe vera is the driving factor this market.
              • sea salt is the driving factor this market.
              • charcoal is the driving factor this market.
              • coconut oil is the driving factor this market.
              • shea butter is the driving factor this market.
              • mango seed butter is the driving factor this market.
              • cocoa seed butter is the driving factor this market.
              • lanolin is the driving factor this market.
              • argan oil is the driving factor this market.
              • jojoba seed oil is the driving factor this market.
              • apricot kernel oil is the driving factor this market.
              • beeswax is the driving factor this market.
              • almond oil is the driving factor this market.
              • coconut oil is the driving factor this market.
              • and avocado oil. This expansion of product lines also helps vendors differentiate their offerings. Organic face oils are free from harmful ingredients is the driving factor this market.
              • such as sulfates and formaldehyde. These organic face oils adhere to the high standards of purity set by various regulatory bodies in different countries. To address the growing demand for organic BPC products is the driving factor this market.
              • vendors such as KHADI NATURAL are introducing new lines of face oils. Therefore is the driving factor this market.
              • such factors will propel the growth of the global face oils market during the forecast period. is the driving factor this market.

              The Face Oils market vendors should focus on grabbing business opportunities from the Anti-aging beauty oils segment as it accounted for the largest market share in the base year.