Fast Food Market Analysis, Size, and Forecast 2026-2030: North America (US, Canada, and Mexico), APAC (China, India, and Japan), Europe (Germany, UK, and France), South America (Brazil and Argentina), Middle East and Africa (Saudi Arabia, UAE, and South Africa), and Rest of World (ROW)

Fast Food Market Analysis, Size, and Forecast 2026-2030:
North America (US, Canada, and Mexico), APAC (China, India, and Japan), Europe (Germany, UK, and France), South America (Brazil and Argentina), Middle East and Africa (Saudi Arabia, UAE, and South Africa), and Rest of World (ROW)

Published: Mar 2026 301 Pages SKU: IRTNTR45866

Market Overview at a Glance

$125.9 B
Market Opportunity
3.1%
CAGR 2025 - 2030
38.2%
APAC Growth
$468.3 B
Non-vegetarian fast food segment 2024

Fast Food Market Size 2026-2030

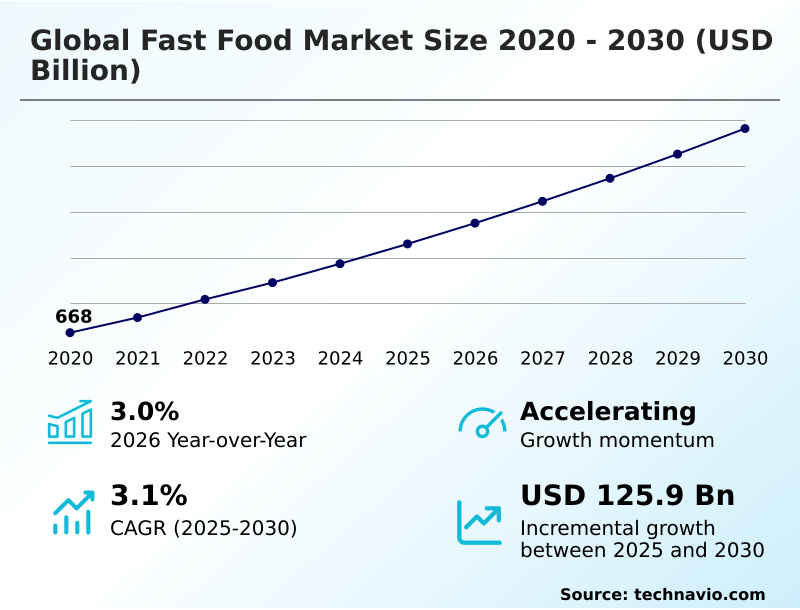
The fast food market size is valued to increase by USD 125.9 billion, at a CAGR of 3.1% from 2025 to 2030. Acceleration of digital transformation and AI integration will drive the fast food market.

Major Market Trends & Insights

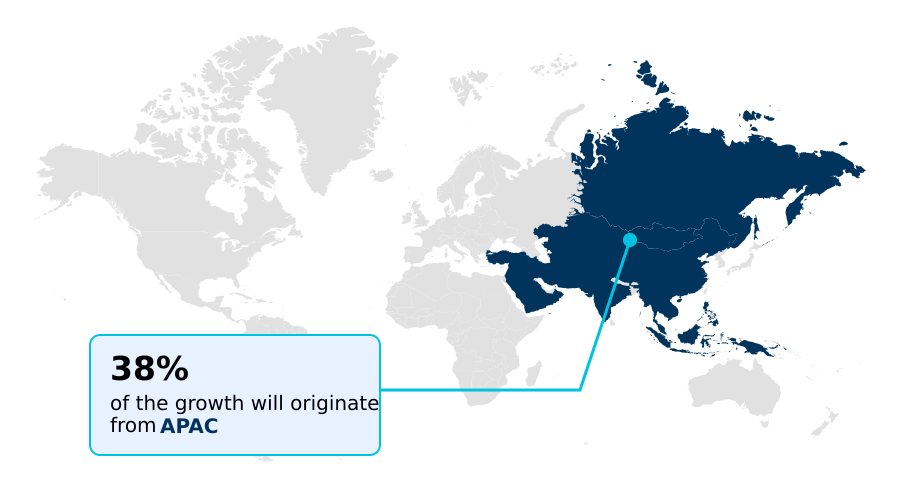
  • APAC dominated the market and accounted for a 38.2% growth during the forecast period.
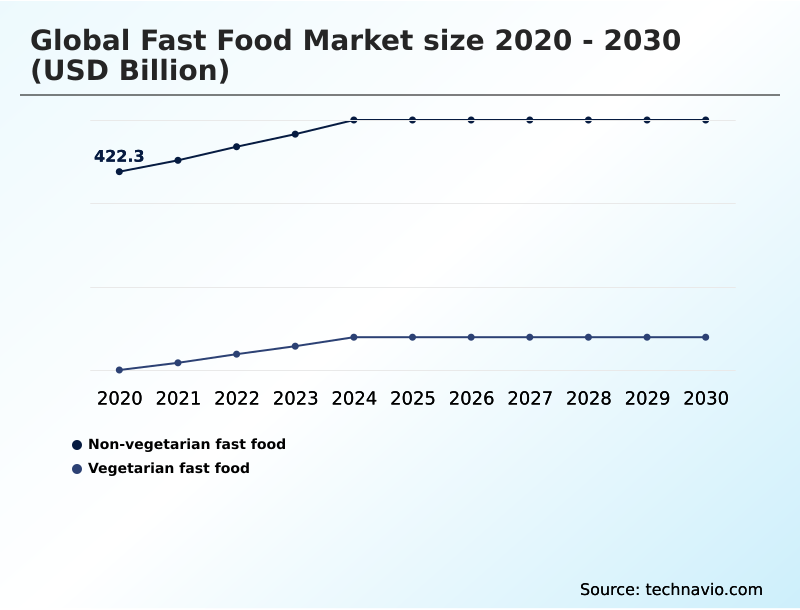
  • By Product - Non-vegetarian fast food segment was valued at USD 468.3 billion in 2024
  • By Service Type - Eat-in segment accounted for the largest market revenue share in 2024

Market Size & Forecast

  • Market Opportunities: USD 222.7 billion
  • Market Future Opportunities: USD 125.9 billion
  • CAGR from 2025 to 2030 : 3.1%

Market Summary

  • The fast food market is undergoing a significant transformation, driven by technological adoption and evolving consumer preferences. Key industry players are moving beyond simple mobile applications to integrate deep learning algorithms and predictive order analytics for real-time optimization of kitchen workflows and customer engagement.
  • This focus on food-tech integration is a response to the need for higher throughput during peak hours while minimizing manual errors. A central theme is the expansion of plant-based menu innovation, shifting vegetarian options from niche offerings to permanent menu fixtures to cater to health-conscious diners.
  • Simultaneously, an aggressive push into high-growth territories, supported by localized menu strategies, allows brands to capitalize on rising disposable incomes in emerging economies. For instance, a chain entering a new region might leverage local supply chains for 40% of its ingredients to ensure authentic flavors and community support.
  • These strategic pillars—digitalization, menu diversification, and geographic expansion—are reshaping the competitive landscape, compelling operators to balance global brand identity with local relevance to sustain growth.

What will be the Size of the Fast Food Market during the forecast period?

Get Key Insights on Market Forecast (PDF) Request Free Sample

How is the Fast Food Market Segmented?

The fast food industry research report provides comprehensive data (region-wise segment analysis), with forecasts and estimates in "USD billion" for the period 2026-2030, as well as historical data from 2020-2024 for the following segments.

  • Product
    • Non-vegetarian fast food
    • Vegetarian fast food
  • Service type
    • Eat-in
    • Take away
    • Home delivery
    • Others
  • Type
    • Burgers and sandwiches
    • Pizza and pasta
    • Asian and Latin American food
    • Chicken and seafood meals
    • Others
  • Geography
    • North America
      • US
      • Canada
      • Mexico
    • APAC
      • China
      • India
      • Japan
    • Europe
      • Germany
      • UK
      • France
    • South America
      • Brazil
      • Argentina
    • Middle East and Africa
      • Saudi Arabia
      • UAE
      • South Africa
    • Rest of World (ROW)

By Product Insights

The non-vegetarian fast food segment is estimated to witness significant growth during the forecast period.

The non-vegetarian fast food market segment remains the cornerstone of the industry, driven by protein platform innovation and the premiumization of core offerings. Major operators are leveraging a franchise ownership model and sustainable sourcing practices to enhance brand loyalty.

This category is characterized by the strategic use of limited-time offerings to create consumer urgency and drive high-volume sales. To differentiate, companies are refining recipes to improve taste and texture, with some achieving a 15% improvement in consumer flavor ratings.

The focus on menu engineering and optimization and smart restaurant design is critical for maintaining market leadership, alongside a robust strategy for new restaurant concept development.

Food service automation trends, coupled with predictive maintenance for kitchen equipment, ensure operational continuity and consistent quality in this highly competitive space.

Request Free Sample

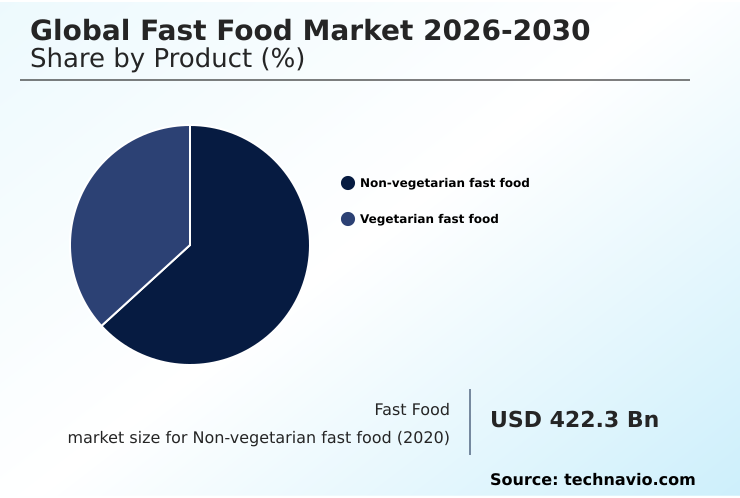
The Non-vegetarian fast food segment was valued at USD 468.3 billion in 2024 and showed a gradual increase during the forecast period.

Request Free Sample

Regional Analysis

APAC is estimated to contribute 38.2% to the growth of the global market during the forecast period.Technavio’s analysts have elaborately explained the regional trends and drivers that shape the market during the forecast period.

See How Fast Food Market Demand is Rising in APAC Request Free Sample

The fast food market's geographic landscape is defined by aggressive expansion in APAC, which is the fastest-growing region globally.

Rapid urbanization and a rising middle class are fueling demand, with some operators planning to open nearly 1,000 new stores in China in a single year.

This growth is supported by a tech-savvy demographic that embraces digital loyalty programs and mobile order and pay systems. Localization is critical, with successful brands adapting menus to include regional flavors.

The implementation of a smart queue system and workforce retention strategies is essential for managing high volumes. In this context, restaurant real estate management and franchise performance management become crucial for scaling operations.

The region’s advanced adoption of digital platforms has accelerated growth, allowing brands to penetrate new areas without requiring a traditional storefront, showcasing the power of a well-executed digital-first strategy.

Market Dynamics

Our researchers analyzed the data with 2025 as the base year, along with the key drivers, trends, and challenges. A holistic analysis of drivers will help companies refine their marketing strategies to gain a competitive advantage.

  • The global fast food market is navigating a complex transformation where strategic decisions around technology and operations are paramount. The impact of AI on fast food operational efficiency is a central theme, as companies seek to automate processes and reduce costs. The benefits of automated kitchen systems in QSR are becoming clear, directly addressing labor shortages and improving consistency.
  • This connects to broader strategies for drive-thru service speed improvement, where every second saved enhances customer satisfaction. The role of deep learning in customer personalization allows brands to move beyond generic offers to create highly targeted campaigns. Simultaneously, operators are weighing the ROI of asset-light vs. traditional franchise models to optimize financial structures.
  • The future of contactless assembly in food preparation promises a more hygienic and efficient kitchen environment. Success also hinges on adapting menus for localized consumer tastes while modernizing restaurant portfolios for digital sales. The ability to balance value menus with rising ingredient costs is a constant challenge, forcing innovation in supply chain management.
  • For instance, firms that use predictive analytics for inventory management report up to 20% less food waste compared to those using manual methods. Ultimately, creating experiential dining in a fast-food setting while addressing these operational realities will define market leaders.

What are the key market drivers leading to the rise in the adoption of Fast Food Industry?

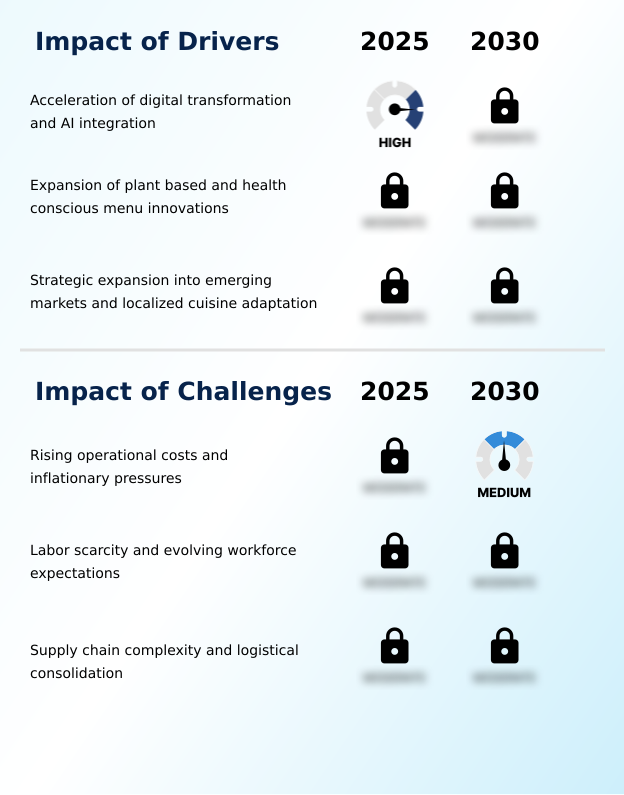
  • The acceleration of digital transformation and the integration of artificial intelligence are key drivers enhancing operational speed and customer engagement in the market.

  • A primary driver is the rapid adoption of sophisticated technology, including voice-based artificial intelligence and customer engagement platforms, to streamline operations. This digital transformation in QSR is critical for enhancing restaurant operational efficiency and managing supply chain consolidation.
  • By leveraging deep learning algorithms, companies can offer personalized value platforms that have resulted in a 15% year-over-year growth in digital sales for some operators.
  • Menu innovation, particularly plant-based menu innovation, is another significant driver, catering to health-conscious consumers and expanding the customer base.
  • The strategic implementation of QSR inventory control systems and energy-efficient kitchen equipment further supports profitability by minimizing waste and reducing overhead, ensuring brands remain competitive and relevant in a fast-evolving market.

What are the market trends shaping the Fast Food Industry?

  • A key market trend is the integration of automated kitchen robotics and contactless assembly systems to address labor shortages and enhance food quality consistency.

  • Key market trends revolve around the deployment of specialized modular robotic units and automated food preparation to address labor shortages and enhance consistency. The integration of kitchen automation robotics, including contactless payment solutions, is reshaping the operational landscape, enabling some concepts to prepare meals in under 30 seconds.
  • This focus on quick service restaurant technology is creating a seamless link between digital ordering and food production. This trend is further supported by the rise of staff training and development platforms to manage these new systems.
  • The trend toward experiential dining concepts and restaurant data analytics is also significant, with companies redesigning interiors to foster community while leveraging data to improve service. For example, renovated locations often see double-digit sales uplifts by balancing high-tech convenience with a welcoming atmosphere, proving that a strong physical presence remains vital.

What challenges does the Fast Food Industry face during its growth?

  • Rising operational costs and persistent inflationary pressures on raw ingredients and utilities present a key challenge to profitability and market growth.

  • The market faces significant challenges from rising operational costs and inflationary pressures, which have kept restaurant-level margins flat for many operators despite revenue growth. This financial volatility is compounded by intense supply chain risk management pressures and the complexity of global logistics.
  • Attracting and retaining a skilled workforce is another structural challenge, forcing companies to implement better workforce retention strategies and explore automated customer service for restaurants. High turnover rates and competition for labor from other sectors are driving investment in automated inventory management and food-tech integration.
  • Furthermore, the push for sustainable restaurant operations adds another layer of complexity, requiring investments in eco-friendly practices that must be balanced against immediate profitability concerns in a price-sensitive market. These headwinds require a dual focus on cost control and strategic technology deployment.

Exclusive Technavio Analysis on Customer Landscape

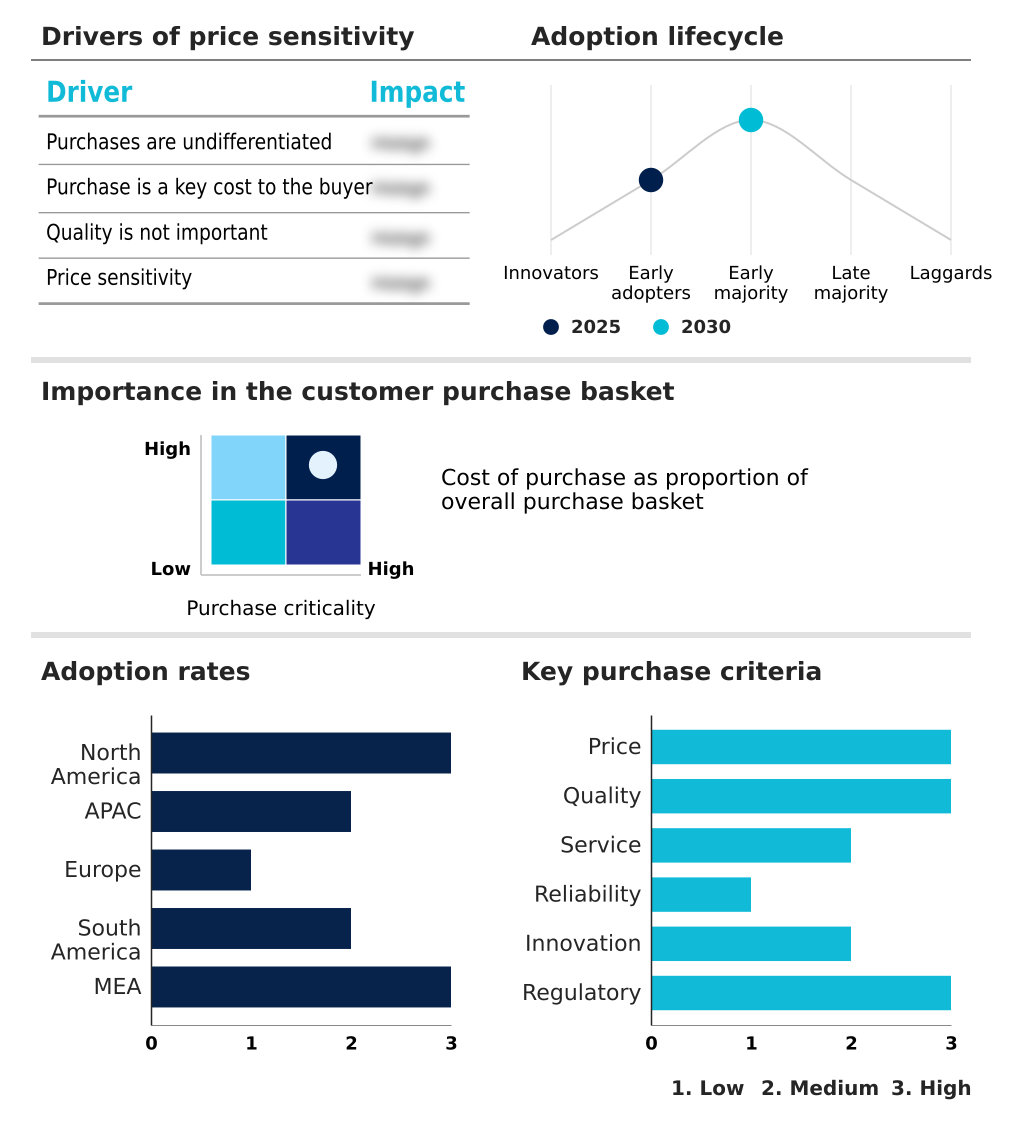
The fast food market forecasting report includes the adoption lifecycle of the market, covering from the innovator’s stage to the laggard’s stage. It focuses on adoption rates in different regions based on penetration. Furthermore, the fast food market report also includes key purchase criteria and drivers of price sensitivity to help companies evaluate and develop their market growth analysis strategies.

Customer Landscape of Fast Food Industry

Competitive Landscape

Companies are implementing various strategies, such as strategic alliances, fast food market forecast, partnerships, mergers and acquisitions, geographical expansion, and product/service launches, to enhance their presence in the industry.

American Dairy Queen Corp. - Core offerings include a range of ready-to-eat products delivered through a global network of quick-service restaurants, focusing on operational speed and convenience.

The industry research and growth report includes detailed analyses of the competitive landscape of the market and information about key companies, including:

  • American Dairy Queen Corp.
  • Chipotle Mexican Grill Inc.
  • Corporativo Bimbo SA de CV
  • Dominos Pizza Inc.
  • Doughnut Time Ltd.
  • Focus Brands LLC
  • Glory Hole Doughnuts
  • Inspire Brands Inc.
  • JAB Holding Co.
  • Jack in the Box Inc.
  • Jimmy Johns Franchisor SPV LLC
  • McDonald Corp.
  • Papa Johns International Inc.
  • Penn Station Inc.
  • Pita Pit Ltd.
  • Restaurant Brands Inc.
  • Starbucks Corp.
  • The Subway Group
  • The Wendys Co.
  • YUM Brands Inc.

Qualitative and quantitative analysis of companies has been conducted to help clients understand the wider business environment as well as the strengths and weaknesses of key industry players. Data is qualitatively analyzed to categorize companies as pure play, category-focused, industry-focused, and diversified; it is quantitatively analyzed to categorize companies as dominant, leading, strong, tentative, and weak.

Recent Development and News in Fast food market

  • In February 2025, Burger King reported that more than 51% of its United States system had reached a modern image following the completion of 370 remodels in a single year as part of its 'Reclaim the Flame' program.
  • In April 2025, Chipotle Mexican Grill signed a major development agreement with Alsea to open its first restaurants in Mexico, marking a significant milestone in its international expansion strategy.
  • In September 2025, Starbucks Corporation announced that its coffeehouse uplift renovation program had reached a milestone of nearly 70 completed projects, with plans to renovate over 1,000 locations by the end of 2026.
  • In December 2025, Chick-fil-A announced a strategic shift to transition its licensed stores in high-traffic venues, such as universities and hospitals, to full franchise ownership to improve brand consistency and employee management.

Dive into Technavio’s robust research methodology, blending expert interviews, extensive data synthesis, and validated models for unparalleled Fast Food Market insights. See full methodology.

Market Scope
Page number 301
Base year 2025
Historic period 2020-2024
Forecast period 2026-2030
Growth momentum & CAGR Accelerate at a CAGR of 3.1%
Market growth 2026-2030 USD 125.9 billion
Market structure Fragmented
YoY growth 2025-2026(%) 3.0%
Key countries US, Canada, Mexico, China, India, Japan, South Korea, Australia, Indonesia, Germany, UK, France, Italy, Spain, The Netherlands, Brazil, Argentina, Chile, Saudi Arabia, UAE, South Africa, Israel and Turkey
Competitive landscape Leading Companies, Market Positioning of Companies, Competitive Strategies, and Industry Risks

Request Free Sample

Research Analyst Overview

  • The fast food market's evolution is centered on the integration of advanced technology to enhance both operational efficiency and customer engagement. The deployment of a sophisticated AI platform is becoming standard for data-driven personalization, enabling hyper-personalized marketing campaigns that resonate with consumers.
  • In parallel, the adoption of kitchen robotics and contactless assembly systems is addressing labor challenges and improving service speed, with some modernized locations achieving a 51% update rate across their system. Key technologies such as automated voice ordering, self-service kiosks, and kitchen display systems are creating a digital-first layout.
  • This is complemented by a smart queue system that optimizes order flow. Behind the scenes, operators are implementing automated scheduling tools and mobile micro-learning to support smaller, more efficient teams. Boardroom decisions are increasingly focused on the franchise ownership model, favoring an asset-light business model and aggressive asset refranchising.
  • This strategy, combined with restaurant portfolio modernization and drive-thru efficiency initiatives, is crucial for maintaining a competitive edge in a market driven by digital transformation and convenience.

What are the Key Data Covered in this Fast Food Market Research and Growth Report?

  • What is the expected growth of the Fast Food Market between 2026 and 2030?

    • USD 125.9 billion, at a CAGR of 3.1%

  • What segmentation does the market report cover?

    • The report is segmented by Product (Non-vegetarian fast food, and Vegetarian fast food), Service Type (Eat-in, Take away, Home delivery, and Others), Type (Burgers and sandwiches, Pizza and pasta, Asian and Latin American food, Chicken and seafood meals, and Others) and Geography (North America, APAC, Europe, South America, Middle East and Africa)

  • Which regions are analyzed in the report?

    • North America, APAC, Europe, South America and Middle East and Africa

  • What are the key growth drivers and market challenges?

    • Acceleration of digital transformation and AI integration, Rising operational costs and inflationary pressures

  • Who are the major players in the Fast Food Market?

    • American Dairy Queen Corp., Chipotle Mexican Grill Inc., Corporativo Bimbo SA de CV, Dominos Pizza Inc., Doughnut Time Ltd., Focus Brands LLC, Glory Hole Doughnuts, Inspire Brands Inc., JAB Holding Co., Jack in the Box Inc., Jimmy Johns Franchisor SPV LLC, McDonald Corp., Papa Johns International Inc., Penn Station Inc., Pita Pit Ltd., Restaurant Brands Inc., Starbucks Corp., The Subway Group, The Wendys Co. and YUM Brands Inc.

Market Research Insights

  • Market dynamics are increasingly shaped by asset-light business models and a strategic focus on restaurant portfolio modernization. This involves acquiring, renovating, and refranchising properties to ensure brand consistency and reduce operational risk, leading to significant mid-teens sales uplifts at renovated locations.
  • The adoption of AI in the food service industry is pivotal, with some operators seeing a 15% year-over-year increase in digital sales by leveraging data for customer experience personalization. Key restaurant franchising strategies now include advanced food delivery optimization software and contactless service models to meet modern consumer demands.
  • Furthermore, food safety and compliance tech is being integrated to navigate complex regulatory environments. The emphasis on sustainable restaurant operations and waste reduction in food service reflects a long-term commitment to evolving consumer values and operational efficiency. These interconnected shifts define the industry's current trajectory, prioritizing agility and technological integration.

We can help! Our analysts can customize this fast food market research report to meet your requirements.

Get in touch

1. Executive Summary

1.1 Market overview

Executive Summary - Chart on Market Overview
Executive Summary - Data Table on Market Overview
Executive Summary - Chart on Global Market Characteristics
Executive Summary - Chart on Market by Geography
Executive Summary - Chart on Market Segmentation by Product
Executive Summary - Chart on Market Segmentation by Service Type
Executive Summary - Chart on Market Segmentation by Type
Executive Summary - Chart on Incremental Growth
Executive Summary - Data Table on Incremental Growth
Executive Summary - Chart on Company Market Positioning

2. Technavio Analysis

2.1 Analysis of price sensitivity, lifecycle, customer purchase basket, adoption rates, and purchase criteria

2.2 Criticality of inputs and Factors of differentiation

Chart on Overview on criticality of inputs and factors of differentiation

2.3 Factors of disruption

Chart on Overview on factors of disruption

2.4 Impact of drivers and challenges

Chart on Impact of drivers and challenges in 2025 and 2030

3. Market Landscape

3.1 Market ecosystem

Chart on Parent Market
Data Table on - Parent Market

3.2 Market characteristics

Chart on Market characteristics analysis

3.3 Value chain analysis

Chart on Value chain analysis

4. Market Sizing

4.1 Market definition

Data Table on Offerings of companies included in the market definition

4.2 Market segment analysis

Market segments

4.3 Market size 2025

4.4 Market outlook: Forecast for 2025-2030

Chart on Global - Market size and forecast 2025-2030 ($ billion)
Data Table on Global - Market size and forecast 2025-2030 ($ billion)
Chart on Global Market: Year-over-year growth 2025-2030 (%)
Data Table on Global Market: Year-over-year growth 2025-2030 (%)

5. Historic Market Size

5.1 Global Fast Food Market 2020 - 2024

Historic Market Size - Data Table on Global Fast Food Market 2020 - 2024 ($ billion)

5.2 Product segment analysis 2020 - 2024

Historic Market Size - Product Segment 2020 - 2024 ($ billion)

5.3 Service Type segment analysis 2020 - 2024

Historic Market Size - Service Type Segment 2020 - 2024 ($ billion)

5.4 Type segment analysis 2020 - 2024

Historic Market Size - Type Segment 2020 - 2024 ($ billion)

5.5 Geography segment analysis 2020 - 2024

Historic Market Size - Geography Segment 2020 - 2024 ($ billion)

5.6 Country segment analysis 2020 - 2024

Historic Market Size - Country Segment 2020 - 2024 ($ billion)

6. Qualitative Analysis

6.1 Impact of AI on Global Fast Food Market

7. Five Forces Analysis

7.1 Five forces summary

Five forces analysis - Comparison between 2025 and 2030

7.2 Bargaining power of buyers

Bargaining power of buyers - Impact of key factors 2025 and 2030

7.3 Bargaining power of suppliers

Bargaining power of suppliers - Impact of key factors in 2025 and 2030

7.4 Threat of new entrants

Threat of new entrants - Impact of key factors in 2025 and 2030

7.5 Threat of substitutes

Threat of substitutes - Impact of key factors in 2025 and 2030

7.6 Threat of rivalry

Threat of rivalry - Impact of key factors in 2025 and 2030

7.7 Market condition

Chart on Market condition - Five forces 2025 and 2030

8. Market Segmentation by Product

8.1 Market segments

Chart on Product - Market share 2025-2030 (%)
Data Table on Product - Market share 2025-2030 (%)

8.2 Comparison by Product

Chart on Comparison by Product
Data Table on Comparison by Product

8.3 Non-vegetarian fast food - Market size and forecast 2025-2030

Chart on Non-vegetarian fast food - Market size and forecast 2025-2030 ($ billion)
Data Table on Non-vegetarian fast food - Market size and forecast 2025-2030 ($ billion)
Chart on Non-vegetarian fast food - Year-over-year growth 2025-2030 (%)
Data Table on Non-vegetarian fast food - Year-over-year growth 2025-2030 (%)

8.4 Vegetarian fast food - Market size and forecast 2025-2030

Chart on Vegetarian fast food - Market size and forecast 2025-2030 ($ billion)
Data Table on Vegetarian fast food - Market size and forecast 2025-2030 ($ billion)
Chart on Vegetarian fast food - Year-over-year growth 2025-2030 (%)
Data Table on Vegetarian fast food - Year-over-year growth 2025-2030 (%)

8.5 Market opportunity by Product

Market opportunity by Product ($ billion)
Data Table on Market opportunity by Product ($ billion)

9. Market Segmentation by Service Type

9.1 Market segments

Chart on Service Type - Market share 2025-2030 (%)
Data Table on Service Type - Market share 2025-2030 (%)

9.2 Comparison by Service Type

Chart on Comparison by Service Type
Data Table on Comparison by Service Type

9.3 Eat-in - Market size and forecast 2025-2030

Chart on Eat-in - Market size and forecast 2025-2030 ($ billion)
Data Table on Eat-in - Market size and forecast 2025-2030 ($ billion)
Chart on Eat-in - Year-over-year growth 2025-2030 (%)
Data Table on Eat-in - Year-over-year growth 2025-2030 (%)

9.4 Take away - Market size and forecast 2025-2030

Chart on Take away - Market size and forecast 2025-2030 ($ billion)
Data Table on Take away - Market size and forecast 2025-2030 ($ billion)
Chart on Take away - Year-over-year growth 2025-2030 (%)
Data Table on Take away - Year-over-year growth 2025-2030 (%)

9.5 Home delivery - Market size and forecast 2025-2030

Chart on Home delivery - Market size and forecast 2025-2030 ($ billion)
Data Table on Home delivery - Market size and forecast 2025-2030 ($ billion)
Chart on Home delivery - Year-over-year growth 2025-2030 (%)
Data Table on Home delivery - Year-over-year growth 2025-2030 (%)

9.6 Others - Market size and forecast 2025-2030

Chart on Others - Market size and forecast 2025-2030 ($ billion)
Data Table on Others - Market size and forecast 2025-2030 ($ billion)
Chart on Others - Year-over-year growth 2025-2030 (%)
Data Table on Others - Year-over-year growth 2025-2030 (%)

9.7 Market opportunity by Service Type

Market opportunity by Service Type ($ billion)
Data Table on Market opportunity by Service Type ($ billion)

10. Market Segmentation by Type

10.1 Market segments

Chart on Type - Market share 2025-2030 (%)
Data Table on Type - Market share 2025-2030 (%)

10.2 Comparison by Type

Chart on Comparison by Type
Data Table on Comparison by Type

10.3 Burgers and sandwiches - Market size and forecast 2025-2030

Chart on Burgers and sandwiches - Market size and forecast 2025-2030 ($ billion)
Data Table on Burgers and sandwiches - Market size and forecast 2025-2030 ($ billion)
Chart on Burgers and sandwiches - Year-over-year growth 2025-2030 (%)
Data Table on Burgers and sandwiches - Year-over-year growth 2025-2030 (%)

10.4 Pizza and pasta - Market size and forecast 2025-2030

Chart on Pizza and pasta - Market size and forecast 2025-2030 ($ billion)
Data Table on Pizza and pasta - Market size and forecast 2025-2030 ($ billion)
Chart on Pizza and pasta - Year-over-year growth 2025-2030 (%)
Data Table on Pizza and pasta - Year-over-year growth 2025-2030 (%)

10.5 Asian and Latin American food - Market size and forecast 2025-2030

Chart on Asian and Latin American food - Market size and forecast 2025-2030 ($ billion)
Data Table on Asian and Latin American food - Market size and forecast 2025-2030 ($ billion)
Chart on Asian and Latin American food - Year-over-year growth 2025-2030 (%)
Data Table on Asian and Latin American food - Year-over-year growth 2025-2030 (%)

10.6 Chicken and seafood meals - Market size and forecast 2025-2030

Chart on Chicken and seafood meals - Market size and forecast 2025-2030 ($ billion)
Data Table on Chicken and seafood meals - Market size and forecast 2025-2030 ($ billion)
Chart on Chicken and seafood meals - Year-over-year growth 2025-2030 (%)
Data Table on Chicken and seafood meals - Year-over-year growth 2025-2030 (%)

10.7 Others - Market size and forecast 2025-2030

Chart on Others - Market size and forecast 2025-2030 ($ billion)
Data Table on Others - Market size and forecast 2025-2030 ($ billion)
Chart on Others - Year-over-year growth 2025-2030 (%)
Data Table on Others - Year-over-year growth 2025-2030 (%)

10.8 Market opportunity by Type

Market opportunity by Type ($ billion)
Data Table on Market opportunity by Type ($ billion)

11. Customer Landscape

11.1 Customer landscape overview

Analysis of price sensitivity, lifecycle, customer purchase basket, adoption rates, and purchase criteria

12. Geographic Landscape

12.1 Geographic segmentation

Chart on Market share by geography 2025-2030 (%)
Data Table on Market share by geography 2025-2030 (%)

12.2 Geographic comparison

Chart on Geographic comparison
Data Table on Geographic comparison

12.3 North America - Market size and forecast 2025-2030

Chart on North America - Market size and forecast 2025-2030 ($ billion)
Data Table on North America - Market size and forecast 2025-2030 ($ billion)
Chart on North America - Year-over-year growth 2025-2030 (%)
Data Table on North America - Year-over-year growth 2025-2030 (%)
Chart on Regional Comparison - North America
Data Table on Regional Comparison - North America

12.3.1 US - Market size and forecast 2025-2030

Chart on US - Market size and forecast 2025-2030 ($ billion)
Data Table on US - Market size and forecast 2025-2030 ($ billion)
Chart on US - Year-over-year growth 2025-2030 (%)
Data Table on US - Year-over-year growth 2025-2030 (%)

12.3.2 Canada - Market size and forecast 2025-2030

Chart on Canada - Market size and forecast 2025-2030 ($ billion)
Data Table on Canada - Market size and forecast 2025-2030 ($ billion)
Chart on Canada - Year-over-year growth 2025-2030 (%)
Data Table on Canada - Year-over-year growth 2025-2030 (%)

12.3.3 Mexico - Market size and forecast 2025-2030

Chart on Mexico - Market size and forecast 2025-2030 ($ billion)
Data Table on Mexico - Market size and forecast 2025-2030 ($ billion)
Chart on Mexico - Year-over-year growth 2025-2030 (%)
Data Table on Mexico - Year-over-year growth 2025-2030 (%)

12.4 APAC - Market size and forecast 2025-2030

Chart on APAC - Market size and forecast 2025-2030 ($ billion)
Data Table on APAC - Market size and forecast 2025-2030 ($ billion)
Chart on APAC - Year-over-year growth 2025-2030 (%)
Data Table on APAC - Year-over-year growth 2025-2030 (%)
Chart on Regional Comparison - APAC
Data Table on Regional Comparison - APAC

12.4.1 China - Market size and forecast 2025-2030

Chart on China - Market size and forecast 2025-2030 ($ billion)
Data Table on China - Market size and forecast 2025-2030 ($ billion)
Chart on China - Year-over-year growth 2025-2030 (%)
Data Table on China - Year-over-year growth 2025-2030 (%)

12.4.2 India - Market size and forecast 2025-2030

Chart on India - Market size and forecast 2025-2030 ($ billion)
Data Table on India - Market size and forecast 2025-2030 ($ billion)
Chart on India - Year-over-year growth 2025-2030 (%)
Data Table on India - Year-over-year growth 2025-2030 (%)

12.4.3 Japan - Market size and forecast 2025-2030

Chart on Japan - Market size and forecast 2025-2030 ($ billion)
Data Table on Japan - Market size and forecast 2025-2030 ($ billion)
Chart on Japan - Year-over-year growth 2025-2030 (%)
Data Table on Japan - Year-over-year growth 2025-2030 (%)

12.4.4 South Korea - Market size and forecast 2025-2030

Chart on South Korea - Market size and forecast 2025-2030 ($ billion)
Data Table on South Korea - Market size and forecast 2025-2030 ($ billion)
Chart on South Korea - Year-over-year growth 2025-2030 (%)
Data Table on South Korea - Year-over-year growth 2025-2030 (%)

12.4.5 Australia - Market size and forecast 2025-2030

Chart on Australia - Market size and forecast 2025-2030 ($ billion)
Data Table on Australia - Market size and forecast 2025-2030 ($ billion)
Chart on Australia - Year-over-year growth 2025-2030 (%)
Data Table on Australia - Year-over-year growth 2025-2030 (%)

12.4.6 Indonesia - Market size and forecast 2025-2030

Chart on Indonesia - Market size and forecast 2025-2030 ($ billion)
Data Table on Indonesia - Market size and forecast 2025-2030 ($ billion)
Chart on Indonesia - Year-over-year growth 2025-2030 (%)
Data Table on Indonesia - Year-over-year growth 2025-2030 (%)

12.5 Europe - Market size and forecast 2025-2030

Chart on Europe - Market size and forecast 2025-2030 ($ billion)
Data Table on Europe - Market size and forecast 2025-2030 ($ billion)
Chart on Europe - Year-over-year growth 2025-2030 (%)
Data Table on Europe - Year-over-year growth 2025-2030 (%)
Chart on Regional Comparison - Europe
Data Table on Regional Comparison - Europe

12.5.1 Germany - Market size and forecast 2025-2030

Chart on Germany - Market size and forecast 2025-2030 ($ billion)
Data Table on Germany - Market size and forecast 2025-2030 ($ billion)
Chart on Germany - Year-over-year growth 2025-2030 (%)
Data Table on Germany - Year-over-year growth 2025-2030 (%)

12.5.2 UK - Market size and forecast 2025-2030

Chart on UK - Market size and forecast 2025-2030 ($ billion)
Data Table on UK - Market size and forecast 2025-2030 ($ billion)
Chart on UK - Year-over-year growth 2025-2030 (%)
Data Table on UK - Year-over-year growth 2025-2030 (%)

12.5.3 France - Market size and forecast 2025-2030

Chart on France - Market size and forecast 2025-2030 ($ billion)
Data Table on France - Market size and forecast 2025-2030 ($ billion)
Chart on France - Year-over-year growth 2025-2030 (%)
Data Table on France - Year-over-year growth 2025-2030 (%)

12.5.4 Italy - Market size and forecast 2025-2030

Chart on Italy - Market size and forecast 2025-2030 ($ billion)
Data Table on Italy - Market size and forecast 2025-2030 ($ billion)
Chart on Italy - Year-over-year growth 2025-2030 (%)
Data Table on Italy - Year-over-year growth 2025-2030 (%)

12.5.5 Spain - Market size and forecast 2025-2030

Chart on Spain - Market size and forecast 2025-2030 ($ billion)
Data Table on Spain - Market size and forecast 2025-2030 ($ billion)
Chart on Spain - Year-over-year growth 2025-2030 (%)
Data Table on Spain - Year-over-year growth 2025-2030 (%)

12.5.6 The Netherlands - Market size and forecast 2025-2030

Chart on The Netherlands - Market size and forecast 2025-2030 ($ billion)
Data Table on The Netherlands - Market size and forecast 2025-2030 ($ billion)
Chart on The Netherlands - Year-over-year growth 2025-2030 (%)
Data Table on The Netherlands - Year-over-year growth 2025-2030 (%)

12.6 South America - Market size and forecast 2025-2030

Chart on South America - Market size and forecast 2025-2030 ($ billion)
Data Table on South America - Market size and forecast 2025-2030 ($ billion)
Chart on South America - Year-over-year growth 2025-2030 (%)
Data Table on South America - Year-over-year growth 2025-2030 (%)
Chart on Regional Comparison - South America
Data Table on Regional Comparison - South America

12.6.1 Brazil - Market size and forecast 2025-2030

Chart on Brazil - Market size and forecast 2025-2030 ($ billion)
Data Table on Brazil - Market size and forecast 2025-2030 ($ billion)
Chart on Brazil - Year-over-year growth 2025-2030 (%)
Data Table on Brazil - Year-over-year growth 2025-2030 (%)

12.6.2 Argentina - Market size and forecast 2025-2030

Chart on Argentina - Market size and forecast 2025-2030 ($ billion)
Data Table on Argentina - Market size and forecast 2025-2030 ($ billion)
Chart on Argentina - Year-over-year growth 2025-2030 (%)
Data Table on Argentina - Year-over-year growth 2025-2030 (%)

12.6.3 Chile - Market size and forecast 2025-2030

Chart on Chile - Market size and forecast 2025-2030 ($ billion)
Data Table on Chile - Market size and forecast 2025-2030 ($ billion)
Chart on Chile - Year-over-year growth 2025-2030 (%)
Data Table on Chile - Year-over-year growth 2025-2030 (%)

12.7 Middle East and Africa - Market size and forecast 2025-2030

Chart on Middle East and Africa - Market size and forecast 2025-2030 ($ billion)
Data Table on Middle East and Africa - Market size and forecast 2025-2030 ($ billion)
Chart on Middle East and Africa - Year-over-year growth 2025-2030 (%)
Data Table on Middle East and Africa - Year-over-year growth 2025-2030 (%)
Chart on Regional Comparison - Middle East and Africa
Data Table on Regional Comparison - Middle East and Africa

12.7.1 Saudi Arabia - Market size and forecast 2025-2030

Chart on Saudi Arabia - Market size and forecast 2025-2030 ($ billion)
Data Table on Saudi Arabia - Market size and forecast 2025-2030 ($ billion)
Chart on Saudi Arabia - Year-over-year growth 2025-2030 (%)
Data Table on Saudi Arabia - Year-over-year growth 2025-2030 (%)

12.7.2 UAE - Market size and forecast 2025-2030

Chart on UAE - Market size and forecast 2025-2030 ($ billion)
Data Table on UAE - Market size and forecast 2025-2030 ($ billion)
Chart on UAE - Year-over-year growth 2025-2030 (%)
Data Table on UAE - Year-over-year growth 2025-2030 (%)

12.7.3 South Africa - Market size and forecast 2025-2030

Chart on South Africa - Market size and forecast 2025-2030 ($ billion)
Data Table on South Africa - Market size and forecast 2025-2030 ($ billion)
Chart on South Africa - Year-over-year growth 2025-2030 (%)
Data Table on South Africa - Year-over-year growth 2025-2030 (%)

12.7.4 Israel - Market size and forecast 2025-2030

Chart on Israel - Market size and forecast 2025-2030 ($ billion)
Data Table on Israel - Market size and forecast 2025-2030 ($ billion)
Chart on Israel - Year-over-year growth 2025-2030 (%)
Data Table on Israel - Year-over-year growth 2025-2030 (%)

12.7.5 Turkey - Market size and forecast 2025-2030

Chart on Turkey - Market size and forecast 2025-2030 ($ billion)
Data Table on Turkey - Market size and forecast 2025-2030 ($ billion)
Chart on Turkey - Year-over-year growth 2025-2030 (%)
Data Table on Turkey - Year-over-year growth 2025-2030 (%)

12.8 Market opportunity by geography

Market opportunity by geography ($ billion)
Data Tables on Market opportunity by geography ($ billion)

13. Drivers, Challenges, and Opportunity

13.1 Market drivers

Acceleration of digital transformation and AI integration
Expansion of plant based and health conscious menu innovations
Strategic expansion into emerging markets and localized cuisine adaptation

13.2 Market challenges

Rising operational costs and inflationary pressures
Labor scarcity and evolving workforce expectations
Supply chain complexity and logistical consolidation

13.3 Impact of drivers and challenges

Impact of drivers and challenges in 2025 and 2030

13.4 Market opportunities

Integration of automated kitchen robotics and contactless assembly systems
Rise of experiential dining and restoration of physical community spaces
Operational modernization and acceleration of asset refranchising

14. Competitive Landscape

14.1 Overview

14.2

Overview on criticality of inputs and factors of differentiation

14.3 Landscape disruption

Overview on factors of disruption

14.4 Industry risks

Impact of key risks on business

15. Competitive Analysis

15.1 Companies profiled

Companies covered

15.2 Company ranking index

15.3 Market positioning of companies

Matrix on companies position and classification

15.4 American Dairy Queen Corp.

American Dairy Queen Corp. - Overview
American Dairy Queen Corp. - Product / Service
American Dairy Queen Corp. - Key offerings
SWOT

15.5 Chipotle Mexican Grill Inc.

Chipotle Mexican Grill Inc. - Overview
Chipotle Mexican Grill Inc. - Product / Service
Chipotle Mexican Grill Inc. - Key offerings
SWOT

15.6 Corporativo Bimbo SA de CV

Corporativo Bimbo SA de CV - Overview
Corporativo Bimbo SA de CV - Business segments
Corporativo Bimbo SA de CV - Key news
Corporativo Bimbo SA de CV - Key offerings
Corporativo Bimbo SA de CV - Segment focus
SWOT

15.7 Dominos Pizza Inc.

Dominos Pizza Inc. - Overview
Dominos Pizza Inc. - Business segments
Dominos Pizza Inc. - Key news
Dominos Pizza Inc. - Key offerings
Dominos Pizza Inc. - Segment focus
SWOT

15.8 Focus Brands LLC

Focus Brands LLC - Overview
Focus Brands LLC - Product / Service
Focus Brands LLC - Key offerings
SWOT

15.9 Glory Hole Doughnuts

Glory Hole Doughnuts - Overview
Glory Hole Doughnuts - Product / Service
Glory Hole Doughnuts - Key offerings
SWOT

15.10 Inspire Brands Inc.

Inspire Brands Inc. - Overview
Inspire Brands Inc. - Product / Service
Inspire Brands Inc. - Key offerings
SWOT

15.11 JAB Holding Co.

JAB Holding Co. - Overview
JAB Holding Co. - Product / Service
JAB Holding Co. - Key offerings
SWOT

15.12 Jack in the Box Inc.

Jack in the Box Inc. - Overview
Jack in the Box Inc. - Business segments
Jack in the Box Inc. - Key offerings
Jack in the Box Inc. - Segment focus
SWOT

15.13 McDonald Corp.

McDonald Corp. - Overview
McDonald Corp. - Business segments
McDonald Corp. - Key offerings
McDonald Corp. - Segment focus
SWOT

15.14 Restaurant Brands Inc.

Restaurant Brands Inc. - Overview
Restaurant Brands Inc. - Business segments
Restaurant Brands Inc. - Key news
Restaurant Brands Inc. - Key offerings
Restaurant Brands Inc. - Segment focus
SWOT

15.15 Starbucks Corp.

Starbucks Corp. - Overview
Starbucks Corp. - Business segments
Starbucks Corp. - Key news
Starbucks Corp. - Key offerings
Starbucks Corp. - Segment focus
SWOT

15.16 The Subway Group

The Subway Group - Overview
The Subway Group - Product / Service
The Subway Group - Key news
The Subway Group - Key offerings
SWOT

15.17 The Wendys Co.

The Wendys Co. - Overview
The Wendys Co. - Business segments
The Wendys Co. - Key news
The Wendys Co. - Key offerings
The Wendys Co. - Segment focus
SWOT

15.18 YUM Brands Inc.

YUM Brands Inc. - Overview
YUM Brands Inc. - Business segments
YUM Brands Inc. - Key offerings
YUM Brands Inc. - Segment focus
SWOT

16. Appendix

16.1 Scope of the report

Market definition
Objectives
Notes and caveats

16.2 Inclusions and exclusions checklist

Inclusions checklist
Exclusions checklist

16.3 Currency conversion rates for US$

16.4 Research methodology

16.5 Data procurement

Information sources

16.6 Data validation

16.7 Validation techniques employed for market sizing

16.8 Data synthesis

16.9 360 degree market analysis

16.10 List of abbreviations

Research Methodology

Technavio presents a detailed picture of the market by way of study, synthesis, and summation of data from multiple sources. The analysts have presented the various facets of the market with a particular focus on identifying the key industry influencers. The data thus presented is comprehensive, reliable, and the result of extensive research, both primary and secondary.

INFORMATION SOURCES

Primary sources

  • Manufacturers and suppliers
  • Channel partners
  • Industry experts
  • Strategic decision makers

Secondary sources

  • Industry journals and periodicals
  • Government data
  • Financial reports of key industry players
  • Historical data
  • Press releases

DATA ANALYSIS

Data Synthesis

  • Collation of data
  • Estimation of key figures
  • Analysis of derived insights

Data Validation

  • Triangulation with data models
  • Reference against proprietary databases
  • Corroboration with industry experts

REPORT WRITING

Qualitative

  • Market drivers
  • Market challenges
  • Market trends
  • Five forces analysis

Quantitative

  • Market size and forecast
  • Market segmentation
  • Geographical insights
  • Competitive landscape

Interested in this report?

Get your sample now to see our research methodology and insights!

Download Now

Frequently Asked Questions

Fast Food market growth will increase by USD 125.9 billion during 2026-2030.

The Fast Food market is expected to grow at a CAGR of 3.1% during 2026-2030.

Fast Food market is segmented by Product (Non-vegetarian fast food, Vegetarian fast food) Service type (Eat-in, Take away, Home delivery, Others) Type (Burgers and sandwiches, Pizza and pasta, Asian and Latin American food, Chicken and seafood meals, Others)

American Dairy Queen Corp., Chipotle Mexican Grill Inc., Corporativo Bimbo SA de CV, Dominos Pizza Inc., Doughnut Time Ltd., Focus Brands LLC, Glory Hole Doughnuts, Inspire Brands Inc., JAB Holding Co., Jack in the Box Inc., Jimmy Johns Franchisor SPV LLC, McDonald Corp., Papa Johns International Inc., Penn Station Inc., Pita Pit Ltd., Restaurant Brands Inc., Starbucks Corp., The Subway Group, The Wendys Co., YUM Brands Inc. are a few of the key vendors in the Fast Food market.

APAC will register the highest growth rate of 38.2% among the other regions. Therefore, the Fast Food market in APAC is expected to garner significant business opportunities for the vendors during the forecast period.

US, Canada, Mexico, China, India, Japan, South Korea, Australia, Indonesia, Germany, UK, France, Italy, Spain, The Netherlands, Brazil, Argentina, Chile, Saudi Arabia, UAE, South Africa, Israel, Turkey

  • Acceleration of digital transformation and AI integration is the driving factor this market.

The Fast Food market vendors should focus on grabbing business opportunities from the Product segment as it accounted for the largest market share in the base year.
RIA - Research AI Assistant
Ask RIA