
Fatty Acid Market Size 2024-2028
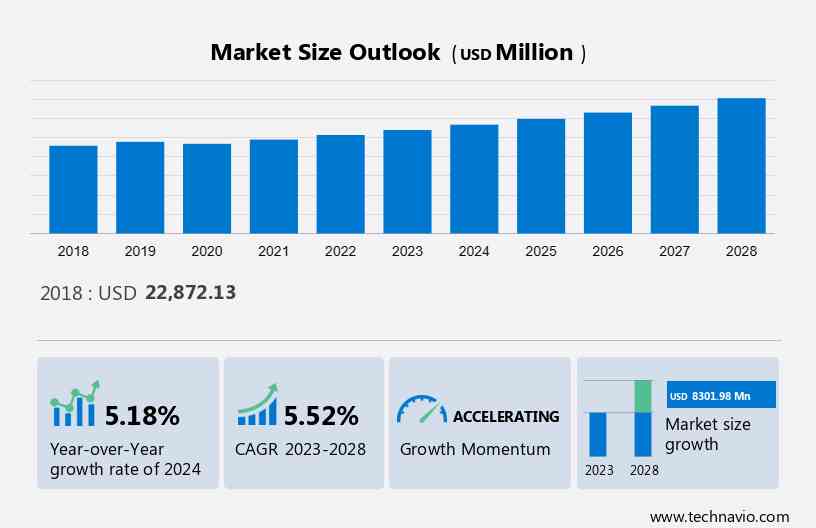
The fatty acid market size is forecast to increase by USD 8.30 billion at a CAGR of 5.52% between 2023 and 2028. The increasing focus on health and wellness, driven by rising health consciousness and lifestyle changes, is driving market growth by increasing the demand for health-promoting products and ingredients. The growing demand for industrial and institutional cleaners, driven by the need for effective cleaning and hygiene solutions in various industries and sectors, is also boosting market expansion by creating a demand for cleaning products and services. Additionally, the increasing use of omega-3 and omega-6 fatty acids, driven by their health benefits and nutritional value, is driving market growth by increasing the demand for products fortified with these fatty acids.
What will be the Size of the Market During the Forecast Period?
For More Highlights About this Report, Download Free Sample in a Minute
Market Segmentation
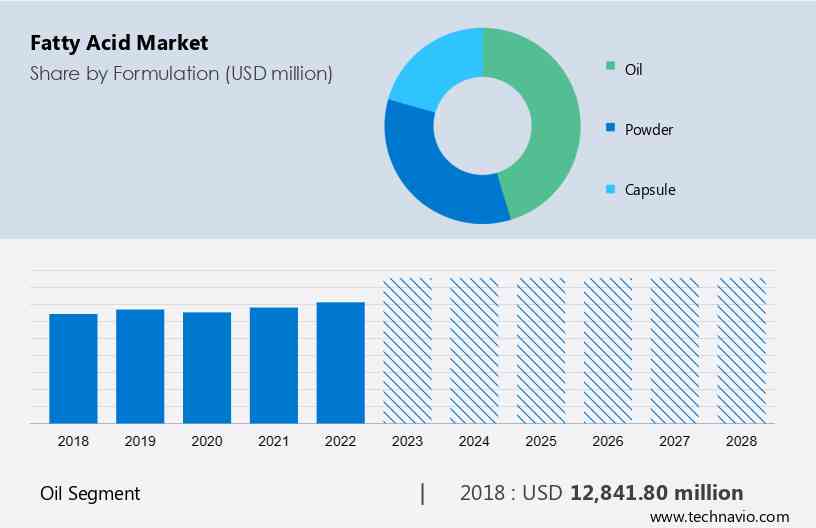
By Formulation
The oil segment is estimated to witness significant growth during the forecast period. Fatty acid oils are liquid formulations that encompass a wide spectrum of fatty acids, each with its own distinct properties and applications across industries. These oils can be derived from both plant and animal sources, offering versatility and utility in various contexts. One prime example is olive oil, renowned for its rich monounsaturated fats, primarily oleic acid.
Get a glance at the market contribution of various segments Download the PDF Sample
The oil segment was the largest segment and was valued at USD 12.84 billion in 2018. Fish oil, extracted from fatty fish such as salmon and mackerel, is celebrated for its omega-3 fatty acids, particularly eicosapentaenoic acid (EPA) and docosahexaenoic acid (DHA). Further, new palm oil fractions that are harder (more saturated) or softer (more unsaturated) than the parent oil can be created by crystallizing these constituents. Thus, a variety of melting points, from liquid oils to high melting point solids that resemble wax, can be obtained from palm oil. Cargill Inc., one of the companies in the market, offers Agri-Pure esters. These esters can be used in hydraulic fluids and metalworking lubrication applications such as drilling, cutting, and rolling. They are manufactured from a range of vegetable oils. These fluids' special composition gives them high flash and fire points, which are essential safety features for lubrication formulations. Thus, the growing use of fatty acid oils will drive the growth of this segment in the market during the forecast period.
By Region
For more insights on the market share of various regions Download PDF Sample now!
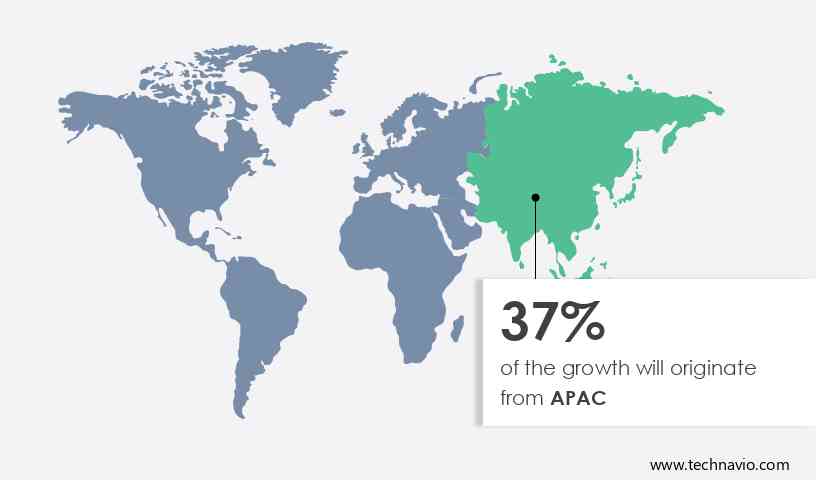
APAC is estimated to contribute 37% to the growth of the global market during the forecast period. Technavio’s analysts have elaborately explained the regional trends and drivers that shape the market during the forecast period. Another region offering significant growth opportunities to companies is North America. The market in North America is driven by the food, pharmaceutical, cosmetics, and personal care industries. The US and Canada are the major contributing countries in terms of revenue to the growth of the regional market in 2023. The personal care and cosmetic industry is growing at a significant rate in North America. Moreover, the anti-ageing pharmaceuticals and cosmetic products segment is witnessing strong demand from individuals aged between 30 and 50 years in the region, which is dominated by developed countries such as the US with high per capita income and strong spending power. The US is among the top five importers and exporters of beauty cosmetics and skincare products.
Similarly, according to the International Trade Administration (ITA) data, the cosmetics industry in Canada produces a wide range of goods, such as soaps and makeup, among others. Fatty acids are used in skincare, haircare, and cosmetics products due to their moisturizing and emollient properties. As consumer preferences lean towards natural and organic ingredients, the demand for fatty acid-based products in this industry continues to rise. Hence, the high penetration of cosmetics and personal care products is driving the market for fatty acids in North America during the forecast period.
Market Dynamics and Customer Landscape
The market is versatile, finding applications in various industries such as pharmaceutical and nutraceutical goods, household and industrial cleaning, and cosmetics. Fatty acids like lauric acid and myristic acid are key components in cleaning supplies such as soaps, detergents, bleaches, and cleaners. They are also utilized in the production of methyl ester and fatty alcohols. In the pharmaceutical and nutraceutical sectors, Fatty acids in food, fatty acids are used in products for dish care, floor care, fabric care, and surface care. These acids are sourced from natural oils and animal carbohydrates and play a crucial role in the body's digestion, energy storage, and the bloodstream. Our researchers analyzed the data with 2023 as the base year, along with the key drivers, trends, and challenges. A holistic analysis of drivers will help companies refine their marketing strategies to gain a competitive advantage.
Key Market Driver
Growing demand for industrial and institutional cleaners is notably driving the market growth. The increasing demand for industrial and institutional cleaners is a significant driver of the market. These cleaners use surfactants as raw materials, which in turn drives the market. Factors such as growing health awareness and rapid industrialization in developing nations are fueling the demand for cleanliness in workplaces and public areas, boosting the industrial and institutional cleaners industry.
Moreover, this trend is also reflected in the increased demand for natural oils, which are used in various industries such as cosmetics, nutraceuticals, pharmaceuticals, food and beverages, and animal feeds. Maintaining cleanliness in these spaces is crucial for people's health and well-being. Therefore, the rising demand for cleaners is expected to increase the need for fatty acids for cleaning applications, thereby stimulating market growth in the forecast period.
Major Market Trends
The introduction of enzymatic pre-splitting technology for fatty acid production is an emerging trend shaping the market growth. The introduction of enzymatic pre-splitting technology is one of the emerging trends making a significant impact on the market. This innovative approach to fatty acid production is revolutionizing the industry by offering more sustainable and efficient methods. Enzymatic pre-splitting technology involves the use of enzymes to break down triglycerides, which are the main constituents of fats and oils, into their fatty acid components. This process occurs before the traditional chemical extraction or refining steps. By employing enzymes, manufacturers can selectively hydrolyze triglycerides into specific fatty acids, allowing for more precise control over the composition of the end product.
However, the benefits of this technology are multifaceted. It reduces the need for harsh chemical processes, minimizing waste and environmental impact. It also enables the production of custom profiles tailored to specific applications, such as pharmaceuticals, cosmetics, and food products. Additionally, the process is often more energy-efficient and cost-effective, providing a competitive edge in the market. Thus, the introduction of enzymatic pre-splitting technology is one of the emerging trends, that is expected to drive the growth of the market during the forecast period.
Significant Market Challenge
Environmental concerns related to sourcing of fatty acids is a significant challenge hindering the market growth. Environmental concerns are a pivotal factor in the market as both sourcing and production methods raise substantial ecological apprehensions. Palm oil, a widely used ingredient in various industries, has come under intense scrutiny due to its association with deforestation, habitat destruction, and biodiversity loss, particularly in tropical regions such as Southeast Asia. The expansion of palm oil plantations often occurs at the expense of valuable ecosystems and endangered species. In response, sustainable sourcing practices and certification programs such as Roundtable on Sustainable Palm Oil (RSPO) have gained traction, promoting eco-friendly and responsible palm oil production methods that aim to mitigate environmental impact.
Additionally, the overexploitation of marine resources for omega-3 fatty acids, vital for heart and brain health, has raised sustainability concerns. Excessive fishing pressure poses threats to fish stocks and marine ecosystems, creating a need for alternative sources. Algae-based omega-3 supplements have emerged as a sustainable solution, alleviating pressure on marine environments. Thus, environmental concerns related to the sourcing of fatty acids will pose a major challenge to the growth of the market during the forecast period.
Key Market Customer Landscape
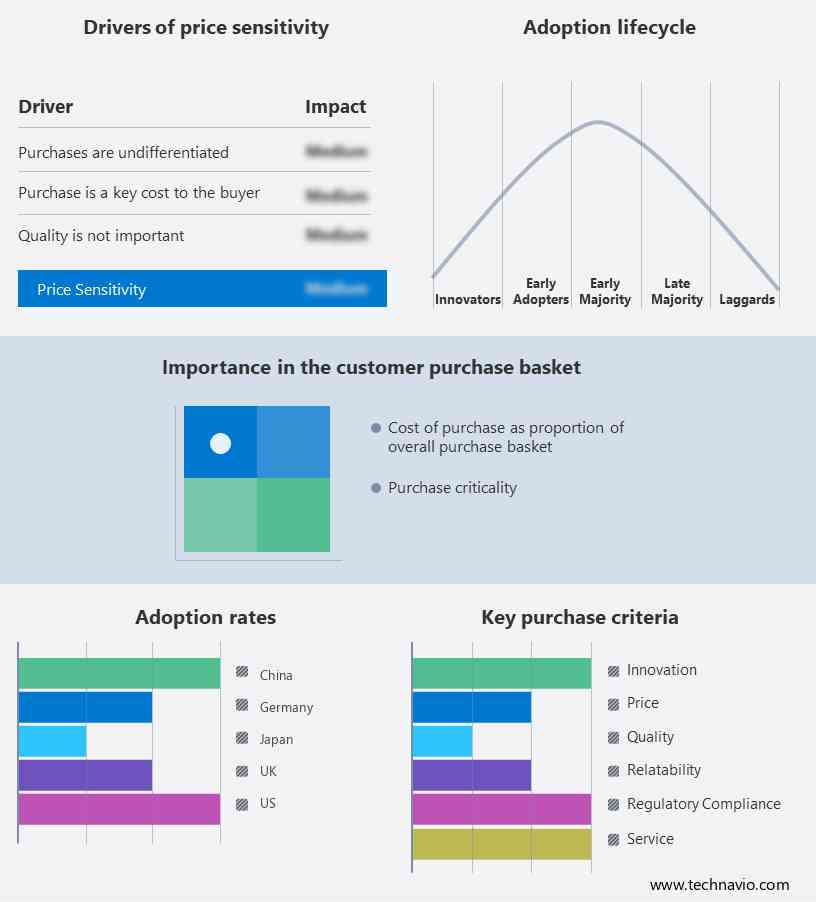
The market research report includes the adoption lifecycle of the market, covering from the innovator’s stage to the laggard’s stage. It focuses on adoption rates in different regions based on penetration. Furthermore, the report also includes key purchase criteria and drivers of price sensitivity to help companies evaluate and develop their growth strategies.
Market Customer Landscape
Who are the Major Market Companies?
Companies are implementing various strategies, such as strategic alliances, partnerships, mergers and acquisitions, geographical expansion, and product/service launches, to enhance their presence in the market.
AAK AB - The company offers fatty acids such as oleochemicals, formed through the splitting of vegetable oils into fatty acids and glycerin.
The research report also includes detailed analyses of the competitive landscape of the market and information about 20 market companies, including:
- Aker BioMarine ASA
- Arizona Algae Products LLC
- Ashland Inc.
- AVRIL SCA
- BASF SE
- Cargill Inc.
- Colgate Palmolive Co.
- Croda International Plc
- Dow Chemical Co.
- Eastman Chemical Co.
- Godrej Industries Ltd.
- Koninklijke DSM NV
- Nikunj Chemicals
- S.R. Chemical
- Shiv Shakti Group
- The Procter and Gamble Co.
- Tokyo Chemical Industry Co. Ltd.
- Vantage Specialty Chemicals
- Zhengzhou Meiya Chemical Products Co. Ltd.
Qualitative and quantitative analysis of companies has been conducted to help clients understand the wider business environment as well as the strengths and weaknesses of key market players. Data is qualitatively analyzed to categorize companies as pure play, category-focused, industry-focused, and diversified; it is quantitatively analyzed to categorize companies as dominant, leading, strong, tentative, and weak.
Segment Overview
The market research report provides comprehensive data (region wise segment analysis), with forecasts and estimates in "USD Billion" for the period 2024 to 2028, as well as historical data from 2018 to 2022 for the following segments
- Formulation Outlook
- Oil
- Powder
- Capsule
- Type Outlook
- Unsaturated
- Saturated
- Region Outlook
- North America
- The U.S.
- Canada
- South America
- Chile
- Brazil
- Argentina
- Europe
- U.K.
- Germany
- France
- Rest of Europe
- APAC
- China
- India
- Middle East & Africa
- Saudi Arabia
- South Africa
- Rest of the Middle East & Africa
- North America
You may also interested in below market reports:
- Fatty Alcohols Market: Fatty Alcohols Market Analysis APAC, Europe, North America, Middle East and Africa, South America - China, US, Germany, France, Canada - Size and Forecast
- Capric Acid Market: Capric Acid Market Analysis APAC, North America, Europe, South America, Middle East and Africa - US, China, Japan, Germany, UK - Size and Forecast
- Butyric Acid Market: Butyric Acid Market Analysis APAC, North America, Europe, South America, Middle East and Africa - US, China, India, Germany, Brazil - Size and Forecast
Market Analyst Overview
The market is witnessing significant growth driven by various factors. Consumers are increasingly focused on health preservation and are turning to functional food products and nutraceutical applications containing omega fatty acid supplements. There's a growing interest in natural and organic products with healthy metabolism and immunity-boosting supplements. They are essential for cardiovascular health and healthy metabolism, leading to their use in preventive interventions and therapeutic nutrition. The marekt alndscape depends on the Prescription medications, Prevention and treatment of diseases, Rheumatoid arthritis symptoms, Ricinoleic acid, Rubbers, Safflower, Saturated fatty acids, Soap, Sodium salts of fatty acids, Soybean, Sports supplements, Stearic acid, Sunflower, Supplement and functional foods, Tuna, Usage of fatty acids, Vegetables, Vitamins. Manufacturers are exploring innovative delivery methods like liposomes and drug carriers for the nutraceutical industry and pharmaceuticals. With a paradigm shift towards lifestyle modifications, fatty acids are increasingly utilized in preventive interventions and reactive therapies for various conditions including joint pain and inflammation, and cardiovascular disorders.
|
Market Scope |
|
|
Report Coverage |
Details |
|
Page number |
176 |
|
Base year |
2023 |
|
Historic period |
2018-2022 |
|
Forecast period |
2024-2028 |
|
Growth momentum & CAGR |
Accelerate at a CAGR of 5.52% |
|
Market Growth 2024-2028 |
USD 8.30 billion |
|
Market structure |
Fragmented |
|
YoY growth 2023-2024(%) |
5.18 |
|
Regional analysis |
North America, APAC, Europe, South America, and Middle East and Africa |
|
Performing market contribution |
APAC at 37% |
|
Key countries |
US, China, Japan, Germany, and UK |
|
Competitive landscape |
Leading Companies, Market Positioning of Companies, Competitive Strategies, and Industry Risks |
|
Key companies profiled |
AAK AB, Aker BioMarine ASA, Arizona Algae Products LLC, Ashland Inc., AVRIL SCA, BASF SE, Cargill Inc., Colgate Palmolive Co., Croda International Plc, Dow Chemical Co., Eastman Chemical Co., Godrej Industries Ltd., Koninklijke DSM NV, Nikunj Chemicals, S.R. Chemical, Shiv Shakti Group, The Procter and Gamble Co., Tokyo Chemical Industry Co. Ltd., Vantage Specialty Chemicals, and Zhengzhou Meiya Chemical Products Co. Ltd. |
|
Market dynamics |
Parent market analysis, market report, market forecast, Market Forecasting, Market growth inducers and obstacles, Fast-growing and slow-growing segment analysis, COVID-19 impact and recovery analysis and future consumer dynamics, and Market condition analysis for the forecast period. |
|
Customization purview |
If our report has not included the data that you are looking for, you can reach out to our analysts and get segments customized. |
What are the Key Data Covered in this Market Research Report?
- CAGR of the market during the forecast period
- Detailed information on factors that will drive the market growth and forecasting of the market between 2023 and 2028
- Precise estimation of the size of the market size and its contribution to the parent market
- Accurate predictions about upcoming market trends and analysis and changes in consumer behavior
- Growth of the market industry across Europe, North America, APAC, South America, and Middle East and Africa
- Thorough market growth analysis of the market’s competitive landscape and detailed information about companies
- Comprehensive market analysis and report on the factors that will challenge the market research and growth of market companies
We can help! Our analysts can customize this market research report to meet your requirements.
 RIA -
RIA - 
