Field Service Management (FSM) Software Market Analysis, Size, and Forecast 2026-2030: North America (US, Canada, and Mexico), APAC (China, India, and Japan), Europe (Germany, UK, and France), Middle East and Africa (Saudi Arabia, UAE, and South Africa), South America (Brazil and Argentina), and Rest of World (ROW)

Field Service Management (FSM) Software Market Analysis, Size, and Forecast 2026-2030:
North America (US, Canada, and Mexico), APAC (China, India, and Japan), Europe (Germany, UK, and France), Middle East and Africa (Saudi Arabia, UAE, and South Africa), South America (Brazil and Argentina), and Rest of World (ROW)

Published: Mar 2026 298 Pages SKU: IRTNTR45294

Market Overview at a Glance

$2.50 B
Market Opportunity
14.8%
CAGR 2025 - 2030
32.9%
North America Growth
$683.1 Mn
IT and telecom segment 2024

Field Service Management (FSM) Software Market Size 2026-2030

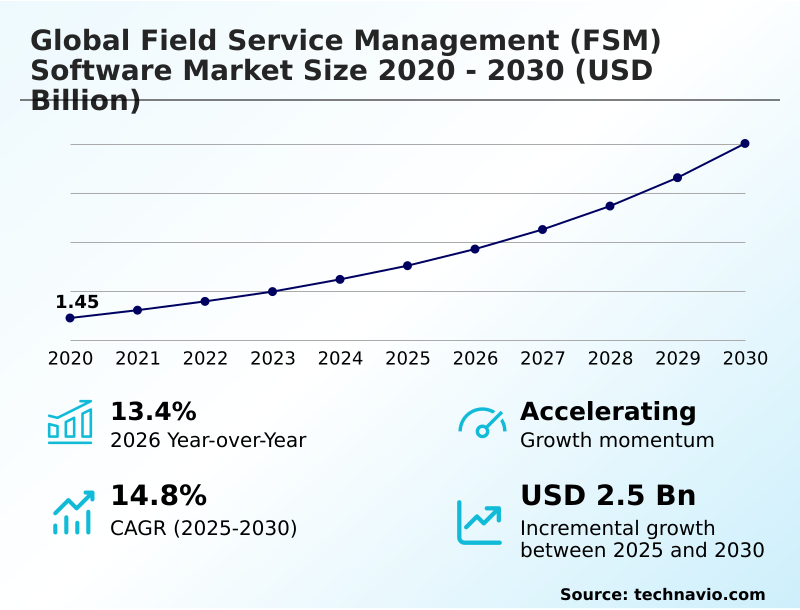
The field service management (fsm) software market size is valued to increase by USD 2.50 billion, at a CAGR of 14.8% from 2025 to 2030. Increasing demand for predictive maintenance will drive the field service management (fsm) software market.

Major Market Trends & Insights

  • North America dominated the market and accounted for a 32.9% growth during the forecast period.
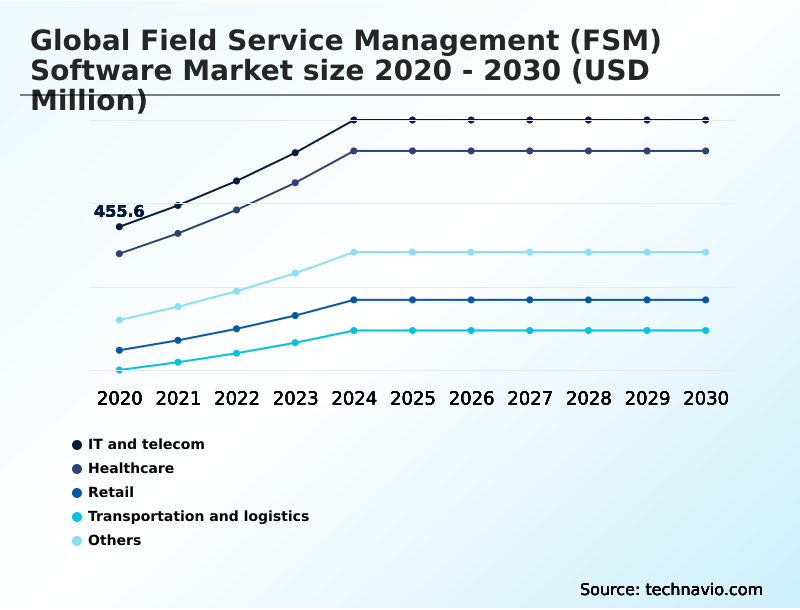
  • By End-user - IT and telecom segment was valued at USD 683.1 million in 2024
  • By Deployment - On-premises segment accounted for the largest market revenue share in 2024

Market Size & Forecast

  • Market Opportunities: USD 3.57 billion
  • Market Future Opportunities: USD 2.50 billion
  • CAGR from 2025 to 2030 : 14.8%

Market Summary

  • The Field Service Management (FSM) Software Market is defined by a continuous push toward operational excellence, driven by the need to manage a distributed and mobile workforce with greater efficiency. Core functionalities center on work order management, intelligent scheduling engine, and real-time communication platform to ensure seamless coordination.
  • A key trend is the integration of predictive maintenance solution, which utilizes AI-driven scheduling and real-time asset monitoring to shift from reactive repairs to proactive interventions. For instance, a logistics company can use telematics data integration to predict vehicle failures, scheduling maintenance to prevent unplanned downtime reduction and improve service level agreement compliance.
  • However, challenges such as legacy system integration and the high costs of digital process redesign temper adoption rates. The move toward cloud-native FSM architecture, augmented reality guidance, and no-code automation platform is further shaping the competitive landscape, enabling more agile service organization and enhanced customer experience orchestration.
  • These advancements help businesses improve first-time fix rate improvement and optimize total cost of ownership analysis for their service operations.

What will be the Size of the Field Service Management (FSM) Software Market during the forecast period?

Get Key Insights on Market Forecast (PDF) Request Free Sample

How is the Field Service Management (FSM) Software Market Segmented?

The field service management (fsm) software industry research report provides comprehensive data (region-wise segment analysis), with forecasts and estimates in "USD million" for the period 2026-2030, as well as historical data from 2020-2024 for the following segments.

  • End-user
    • IT and telecom
    • Healthcare
    • Retail
    • Transportation and logistics
    • Others
  • Deployment
    • On-premises
    • Cloud-based
  • Component
    • Solutions
    • Services
  • Geography
    • North America
      • US
      • Canada
      • Mexico
    • APAC
      • China
      • India
      • Japan
    • Europe
      • Germany
      • UK
      • France
    • Middle East and Africa
      • Saudi Arabia
      • UAE
      • South Africa
    • South America
      • Brazil
      • Argentina
    • Rest of World (ROW)

By End-user Insights

The it and telecom segment is estimated to witness significant growth during the forecast period.

The IT and telecom segment is advancing due to the expansion of digital infrastructure. The rollout of 5G networks, requiring extensive installation and maintenance, drives demand for sophisticated work order management and scheduling and dispatch automation.

Centralized platforms that enable end-to-end service management and mobile-first application design are crucial. These systems must coordinate internal and third-party technicians, ensure service execution and asset performance, and manage asset and inventory tracking.

Effective platforms also integrate automated billing and reporting and support a unified communication platform.

This digital coordination helps companies achieve service contract profitability, with some achieving a 20% improvement in first-time fix rates through preventative work order automation and the use of AI-assisted insights.

Request Free Sample

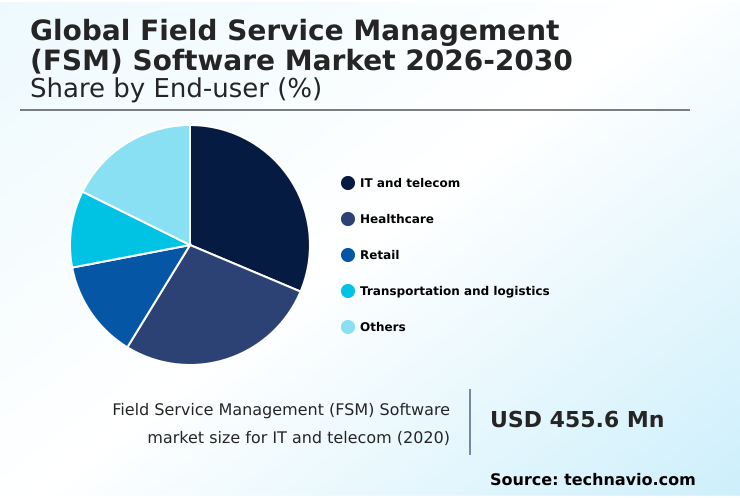
The IT and telecom segment was valued at USD 683.1 million in 2024 and showed a gradual increase during the forecast period.

Request Free Sample

Regional Analysis

North America is estimated to contribute 32.9% to the growth of the global market during the forecast period.Technavio’s analysts have elaborately explained the regional trends and drivers that shape the market during the forecast period.

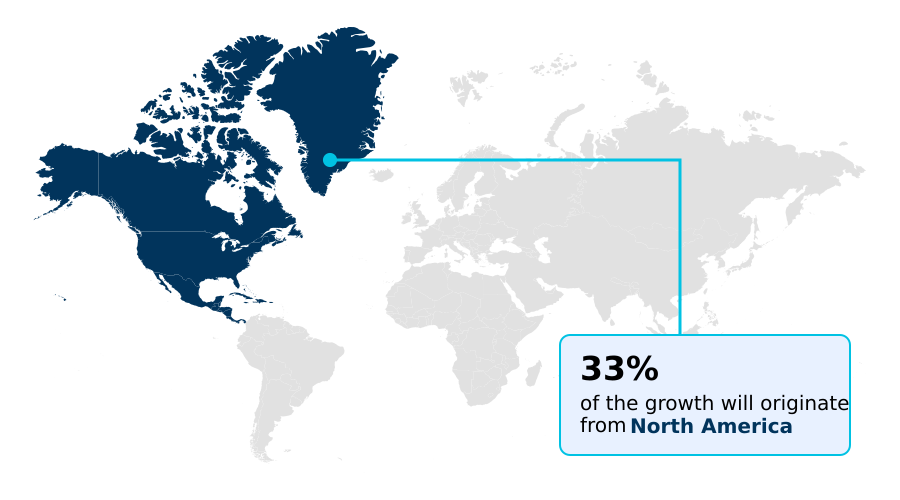
See How Field Service Management (FSM) Software Market Demand is Rising in North America Request Free Sample

Geographic dynamics in the market are shaped by regional needs for asset performance management and customer experience orchestration.

In developed regions, there is a strong focus on advanced field service automation, including preventive maintenance scheduling for critical infrastructure and contractor management module for complex projects.

The need to reduce carbon footprint by over 15% is driving the adoption of geographic information system integration for route optimization. In emerging markets, the focus is on scaling operations with third-party contractor management and ensuring digital compliance documentation.

Across all regions, industrial asset lifecycle management and hyper-personalized service delivery are becoming key differentiators.

The use of mixed-reality support for after-sales service support and emergency dispatch system for rapid response is also growing, supported by workforce skill-based assignment to optimize talent allocation.

Market Dynamics

Our researchers analyzed the data with 2025 as the base year, along with the key drivers, trends, and challenges. A holistic analysis of drivers will help companies refine their marketing strategies to gain a competitive advantage.

  • Achieving operational excellence in the Field Service Management (FSM) Software Market hinges on mastering specific, high-impact use cases. Optimizing field service scheduling software is fundamental, as it directly influences technician productivity and customer satisfaction. The next level of maturity involves integrating IoT with field service management, which enables real-time data streams for implementing predictive maintenance in FSM.
  • This proactive approach significantly helps in improving first-time fix rates with software, a key metric for service profitability. Businesses are also evaluating the benefits of AR in field service, where technicians receive guided instructions, and using digital twins for technician training to accelerate skill development.
  • Another critical area is managing third-party field service providers efficiently, which requires robust platforms that can handle compliance management in field service software seamlessly. For asset-intensive sectors, such as the field service software for telecom industry and managing FSM for renewable energy assets, accurate inventory tracking for field service technicians is non-negotiable.
  • Ultimately, decisions between cloud vs on-premise FSM solutions and the adoption of no-code platforms for field service workflows will define an organization's agility. The effectiveness of AI-powered dispatching for field service, mobile FSM apps for technicians, and route optimization software for service fleets is measured by data analytics in field service operations, which tracks FSM software and customer satisfaction metrics.
  • Overcoming the challenges of FSM legacy system integration is a prerequisite for a successful digital transformation with FSM software.

What are the key market drivers leading to the rise in the adoption of Field Service Management (FSM) Software Industry?

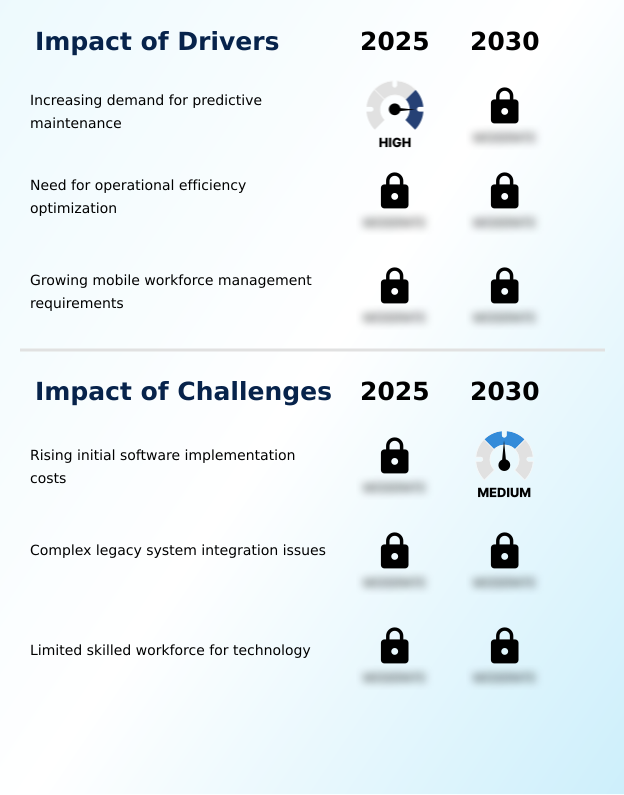
  • The increasing demand for predictive maintenance capabilities is a key driver propelling the growth of the Field Service Management (FSM) Software Market.

  • The market's growth is primarily fueled by the pursuit of operational efficiency optimization and significant service delivery cost reduction.
  • A key driver is the shift toward a predictive maintenance solution, which leverages a sophisticated intelligent scheduling engine and real-time asset monitoring to forecast equipment failures.
  • This approach facilitates unplanned downtime reduction by up to 40% and ensures service level agreement compliance. The expansion of the mobile workforce management necessitates a real-time communication platform and telematics data integration for effective coordination.
  • Furthermore, the focus on first-time fix rate improvement is addressed by AI-driven scheduling and dynamic scheduling capabilities, which optimize technician assignments and routes. This enhances workforce productivity maximization, directly impacting profitability and customer satisfaction in competitive service environments.

What are the market trends shaping the Field Service Management (FSM) Software Industry?

  • The integration of augmented reality tools is an emerging market trend. This technology enhances field operations by providing technicians with real-time, interactive digital information.

  • Key trends are reshaping the market, with a focus on empowering technicians and automating complex decisions. The adoption of augmented reality guidance and remote expert assistance is becoming standard, enabling a single expert to support multiple field workers and improving first-time fix rates by over 20%.
  • This is complemented by immersive training solutions built on a spatial computing interface and digital twin simulation, which reduces onboarding time. Concurrently, edge computing intelligence allows for remote diagnostics capability and the operation of autonomous service units in locations with poor connectivity.
  • The rise of no-code automation platform and low-code development tools is fostering a more agile service organization, where non-technical users can customize workflows. This democratization of technology enables proactive customer service and accelerates data-driven decision making across the enterprise.

What challenges does the Field Service Management (FSM) Software Industry face during its growth?

  • The rising initial costs associated with software implementation present a significant challenge to the growth of the Field Service Management (FSM) Software Market.

  • Significant challenges constrain market adoption, led by difficulties with legacy system integration. Connecting a modern, cloud-native FSM architecture with outdated on-premise systems often requires extensive digital process redesign and costly custom development, complicating enterprise resource planning integration.
  • The total cost of ownership analysis frequently reveals hidden expenses, particularly for data migration and employee training, with initial implementation costs sometimes exceeding software license fees by 50%. Ensuring technician safety and wellness necessitates investment in ruggedized mobile hardware with reliable offline data synchronization.
  • Furthermore, the lack of effective employee engagement tools can lead to poor adoption and inaccurate mobile data capture, undermining inventory loss prevention efforts and the overall return on investment. A multi-cloud strategy enablement can add another layer of complexity to data management.

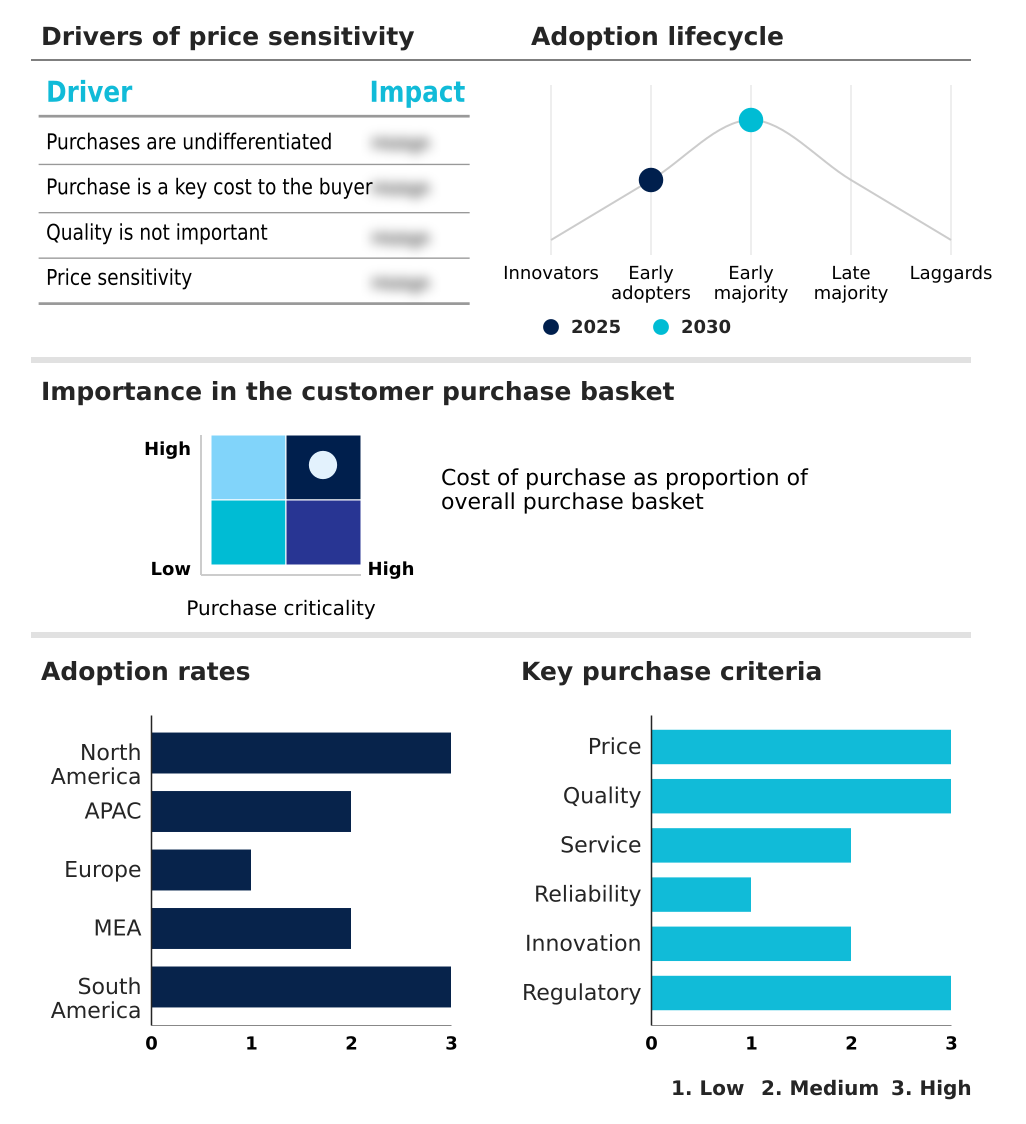
Exclusive Technavio Analysis on Customer Landscape

The field service management (fsm) software market forecasting report includes the adoption lifecycle of the market, covering from the innovator’s stage to the laggard’s stage. It focuses on adoption rates in different regions based on penetration. Furthermore, the field service management (fsm) software market report also includes key purchase criteria and drivers of price sensitivity to help companies evaluate and develop their market growth analysis strategies.

Customer Landscape of Field Service Management (FSM) Software Industry

Competitive Landscape

Companies are implementing various strategies, such as strategic alliances, field service management (fsm) software market forecast, partnerships, mergers and acquisitions, geographical expansion, and product/service launches, to enhance their presence in the industry.

Accruent - Key solutions focus on integrated workforce scheduling, mobile app deployment, and real-time tracking to optimize field operations across diverse industrial and utility sectors.

The industry research and growth report includes detailed analyses of the competitive landscape of the market and information about key companies, including:

  • Accruent
  • Comarch SA
  • FieldAware Group Ltd.
  • FieldEZ
  • Fortive Corp.
  • GeoConcept SAS
  • IFS World Operations AB
  • Infor Inc.
  • Microsoft Corp.
  • MSI Data LLC
  • Oracle Corp.
  • OverIT S.p.A
  • PTC Inc.
  • Salesforce Inc.
  • SAP SE
  • ServicePower Inc.
  • Simpro Group
  • Syncron Holding AB
  • Trimble Inc.
  • Zinier Inc.

Qualitative and quantitative analysis of companies has been conducted to help clients understand the wider business environment as well as the strengths and weaknesses of key industry players. Data is qualitatively analyzed to categorize companies as pure play, category-focused, industry-focused, and diversified; it is quantitatively analyzed to categorize companies as dominant, leading, strong, tentative, and weak.

Recent Development and News in Field service management (fsm) software market

  • In August 2024, Oracle Corp. highlighted the complexities utility companies encounter when integrating modern service tools with legacy grid management systems, which can lead to data fragmentation.
  • In September 2024, Microsoft Corp. released a report on the industrial skills gap, indicating that a significant majority of companies face challenges in recruiting workers proficient with data-driven management tools.
  • In January 2025, PTC Inc. announced its service platform will incorporate advanced digital twin simulations to enhance the training programs for new field service technicians.
  • In February 2025, Salesforce Inc. introduced updates to its data cloud, enabling more proactive customer service through capabilities driven by real-time asset monitoring and analytics.

Dive into Technavio’s robust research methodology, blending expert interviews, extensive data synthesis, and validated models for unparalleled Field Service Management (FSM) Software Market insights. See full methodology.

Market Scope
Page number 298
Base year 2025
Historic period 2020-2024
Forecast period 2026-2030
Growth momentum & CAGR Accelerate at a CAGR of 14.8%
Market growth 2026-2030 USD 2497.1 million
Market structure Fragmented
YoY growth 2025-2026(%) 13.4%
Key countries US, Canada, Mexico, China, India, Japan, South Korea, Australia, Indonesia, Germany, UK, France, Italy, Spain, The Netherlands, Saudi Arabia, UAE, South Africa, Israel, Turkey, Brazil, Argentina and Chile
Competitive landscape Leading Companies, Market Positioning of Companies, Competitive Strategies, and Industry Risks

Request Free Sample

Research Analyst Overview

  • The Field Service Management (FSM) Software Market continues to evolve, driven by the imperative to transform service operations into strategic, revenue-generating functions. Boardroom decisions now focus on deploying solutions that offer not just efficiency but also competitive differentiation through hyper-personalized service delivery and end-to-end service lifecycle management.
  • The adoption of AI-assisted insights and dynamic scheduling capabilities is central to this shift, enabling companies to automate complex processes and improve responsiveness. Key technologies such as AI-driven scheduling, mixed-reality support for technicians, and a unified communication platform are becoming standard.
  • For instance, organizations leveraging a robust scheduling and dispatch automation system have reported reductions in travel time by up to 25%. The integration of mobile-first application design, offline data synchronization, and ruggedized mobile hardware ensures that technicians remain productive in any environment.
  • This technological convergence enables superior asset and inventory tracking, automated billing and reporting, and ultimately, enhanced service contract profitability through better data-driven decision-making.

What are the Key Data Covered in this Field Service Management (FSM) Software Market Research and Growth Report?

  • What is the expected growth of the Field Service Management (FSM) Software Market between 2026 and 2030?

    • USD 2.50 billion, at a CAGR of 14.8%

  • What segmentation does the market report cover?

    • The report is segmented by End-user (IT and telecom, Healthcare, Retail, Transportation and logistics, and Others), Deployment (On-premises, and Cloud-based), Component (Solutions, and Services) and Geography (North America, APAC, Europe, Middle East and Africa, South America)

  • Which regions are analyzed in the report?

    • North America, APAC, Europe, Middle East and Africa and South America

  • What are the key growth drivers and market challenges?

    • Increasing demand for predictive maintenance, Rising initial software implementation costs

  • Who are the major players in the Field Service Management (FSM) Software Market?

    • Accruent, Comarch SA, FieldAware Group Ltd., FieldEZ, Fortive Corp., GeoConcept SAS, IFS World Operations AB, Infor Inc., Microsoft Corp., MSI Data LLC, Oracle Corp., OverIT S.p.A, PTC Inc., Salesforce Inc., SAP SE, ServicePower Inc., Simpro Group, Syncron Holding AB, Trimble Inc. and Zinier Inc.

Market Research Insights

  • The market is driven by a focus on operational efficiency optimization and service delivery cost reduction, with organizations achieving up to a 30% decrease in maintenance expenses through a predictive maintenance solution. Workforce productivity maximization is another key objective, addressed by tools that support mobile data capture and improve first-time fix rate improvement.
  • Platforms now offer advanced data-driven decision making and remote diagnostics capability to enhance after-sales service support. However, a significant skills gap persists, as nearly 60% of companies struggle to find workers with the necessary digital literacy.
  • This challenge is met with immersive training solutions and employee engagement tools designed to improve adoption and ensure technician safety and wellness, ultimately leading to better service contract profitability and proactive customer service.

We can help! Our analysts can customize this field service management (fsm) software market research report to meet your requirements.

Get in touch

1. Executive Summary

1.1 Market overview

Executive Summary - Chart on Market Overview
Executive Summary - Data Table on Market Overview
Executive Summary - Chart on Global Market Characteristics
Executive Summary - Chart on Market by Geography
Executive Summary - Chart on Market Segmentation by End-user
Executive Summary - Chart on Market Segmentation by Deployment
Executive Summary - Chart on Market Segmentation by Component
Executive Summary - Chart on Incremental Growth
Executive Summary - Data Table on Incremental Growth
Executive Summary - Chart on Company Market Positioning

2. Technavio Analysis

2.1 Analysis of price sensitivity, lifecycle, customer purchase basket, adoption rates, and purchase criteria

2.2 Criticality of inputs and Factors of differentiation

Chart on Overview on criticality of inputs and factors of differentiation

2.3 Factors of disruption

Chart on Overview on factors of disruption

2.4 Impact of drivers and challenges

Chart on Impact of drivers and challenges in 2025 and 2030

3. Market Landscape

3.1 Market ecosystem

Chart on Parent Market
Data Table on - Parent Market

3.2 Market characteristics

Chart on Market characteristics analysis

3.3 Value chain analysis

Chart on Value chain analysis

4. Market Sizing

4.1 Market definition

Data Table on Offerings of companies included in the market definition

4.2 Market segment analysis

Market segments

4.3 Market size 2025

4.4 Market outlook: Forecast for 2025-2030

Chart on Global - Market size and forecast 2025-2030 ($ million)
Data Table on Global - Market size and forecast 2025-2030 ($ million)
Chart on Global Market: Year-over-year growth 2025-2030 (%)
Data Table on Global Market: Year-over-year growth 2025-2030 (%)

5. Historic Market Size

5.1 Global Field Service Management (FSM) Software Market 2020 - 2024

Historic Market Size - Data Table on Global Field Service Management (FSM) Software Market 2020 - 2024 ($ million)

5.2 End-user segment analysis 2020 - 2024

Historic Market Size - End-user Segment 2020 - 2024 ($ million)

5.3 Deployment segment analysis 2020 - 2024

Historic Market Size - Deployment Segment 2020 - 2024 ($ million)

5.4 Component segment analysis 2020 - 2024

Historic Market Size - Component Segment 2020 - 2024 ($ million)

5.5 Geography segment analysis 2020 - 2024

Historic Market Size - Geography Segment 2020 - 2024 ($ million)

5.6 Country segment analysis 2020 - 2024

Historic Market Size - Country Segment 2020 - 2024 ($ million)

6. Qualitative Analysis

6.1 Impact of AI on Global Field Service Management (FSM) Software Market

7. Five Forces Analysis

7.1 Five forces summary

Five forces analysis - Comparison between 2025 and 2030

7.2 Bargaining power of buyers

Bargaining power of buyers - Impact of key factors 2025 and 2030

7.3 Bargaining power of suppliers

Bargaining power of suppliers - Impact of key factors in 2025 and 2030

7.4 Threat of new entrants

Threat of new entrants - Impact of key factors in 2025 and 2030

7.5 Threat of substitutes

Threat of substitutes - Impact of key factors in 2025 and 2030

7.6 Threat of rivalry

Threat of rivalry - Impact of key factors in 2025 and 2030

7.7 Market condition

Chart on Market condition - Five forces 2025 and 2030

8. Market Segmentation by End-user

8.1 Market segments

Chart on End-user - Market share 2025-2030 (%)
Data Table on End-user - Market share 2025-2030 (%)

8.2 Comparison by End-user

Chart on Comparison by End-user
Data Table on Comparison by End-user

8.3 IT and telecom - Market size and forecast 2025-2030

Chart on IT and telecom - Market size and forecast 2025-2030 ($ million)
Data Table on IT and telecom - Market size and forecast 2025-2030 ($ million)
Chart on IT and telecom - Year-over-year growth 2025-2030 (%)
Data Table on IT and telecom - Year-over-year growth 2025-2030 (%)

8.4 Healthcare - Market size and forecast 2025-2030

Chart on Healthcare - Market size and forecast 2025-2030 ($ million)
Data Table on Healthcare - Market size and forecast 2025-2030 ($ million)
Chart on Healthcare - Year-over-year growth 2025-2030 (%)
Data Table on Healthcare - Year-over-year growth 2025-2030 (%)

8.5 Retail - Market size and forecast 2025-2030

Chart on Retail - Market size and forecast 2025-2030 ($ million)
Data Table on Retail - Market size and forecast 2025-2030 ($ million)
Chart on Retail - Year-over-year growth 2025-2030 (%)
Data Table on Retail - Year-over-year growth 2025-2030 (%)

8.6 Transportation and logistics - Market size and forecast 2025-2030

Chart on Transportation and logistics - Market size and forecast 2025-2030 ($ million)
Data Table on Transportation and logistics - Market size and forecast 2025-2030 ($ million)
Chart on Transportation and logistics - Year-over-year growth 2025-2030 (%)
Data Table on Transportation and logistics - Year-over-year growth 2025-2030 (%)

8.7 Others - Market size and forecast 2025-2030

Chart on Others - Market size and forecast 2025-2030 ($ million)
Data Table on Others - Market size and forecast 2025-2030 ($ million)
Chart on Others - Year-over-year growth 2025-2030 (%)
Data Table on Others - Year-over-year growth 2025-2030 (%)

8.8 Market opportunity by End-user

Market opportunity by End-user ($ million)
Data Table on Market opportunity by End-user ($ million)

9. Market Segmentation by Deployment

9.1 Market segments

Chart on Deployment - Market share 2025-2030 (%)
Data Table on Deployment - Market share 2025-2030 (%)

9.2 Comparison by Deployment

Chart on Comparison by Deployment
Data Table on Comparison by Deployment

9.3 On-premises - Market size and forecast 2025-2030

Chart on On-premises - Market size and forecast 2025-2030 ($ million)
Data Table on On-premises - Market size and forecast 2025-2030 ($ million)
Chart on On-premises - Year-over-year growth 2025-2030 (%)
Data Table on On-premises - Year-over-year growth 2025-2030 (%)

9.4 Cloud-based - Market size and forecast 2025-2030

Chart on Cloud-based - Market size and forecast 2025-2030 ($ million)
Data Table on Cloud-based - Market size and forecast 2025-2030 ($ million)
Chart on Cloud-based - Year-over-year growth 2025-2030 (%)
Data Table on Cloud-based - Year-over-year growth 2025-2030 (%)

9.5 Market opportunity by Deployment

Market opportunity by Deployment ($ million)
Data Table on Market opportunity by Deployment ($ million)

10. Market Segmentation by Component

10.1 Market segments

Chart on Component - Market share 2025-2030 (%)
Data Table on Component - Market share 2025-2030 (%)

10.2 Comparison by Component

Chart on Comparison by Component
Data Table on Comparison by Component

10.3 Solutions - Market size and forecast 2025-2030

Chart on Solutions - Market size and forecast 2025-2030 ($ million)
Data Table on Solutions - Market size and forecast 2025-2030 ($ million)
Chart on Solutions - Year-over-year growth 2025-2030 (%)
Data Table on Solutions - Year-over-year growth 2025-2030 (%)

10.4 Services - Market size and forecast 2025-2030

Chart on Services - Market size and forecast 2025-2030 ($ million)
Data Table on Services - Market size and forecast 2025-2030 ($ million)
Chart on Services - Year-over-year growth 2025-2030 (%)
Data Table on Services - Year-over-year growth 2025-2030 (%)

10.5 Market opportunity by Component

Market opportunity by Component ($ million)
Data Table on Market opportunity by Component ($ million)

11. Customer Landscape

11.1 Customer landscape overview

Analysis of price sensitivity, lifecycle, customer purchase basket, adoption rates, and purchase criteria

12. Geographic Landscape

12.1 Geographic segmentation

Chart on Market share by geography 2025-2030 (%)
Data Table on Market share by geography 2025-2030 (%)

12.2 Geographic comparison

Chart on Geographic comparison
Data Table on Geographic comparison

12.3 North America - Market size and forecast 2025-2030

Chart on North America - Market size and forecast 2025-2030 ($ million)
Data Table on North America - Market size and forecast 2025-2030 ($ million)
Chart on North America - Year-over-year growth 2025-2030 (%)
Data Table on North America - Year-over-year growth 2025-2030 (%)
Chart on Regional Comparison - North America
Data Table on Regional Comparison - North America

12.3.1 US - Market size and forecast 2025-2030

Chart on US - Market size and forecast 2025-2030 ($ million)
Data Table on US - Market size and forecast 2025-2030 ($ million)
Chart on US - Year-over-year growth 2025-2030 (%)
Data Table on US - Year-over-year growth 2025-2030 (%)

12.3.2 Canada - Market size and forecast 2025-2030

Chart on Canada - Market size and forecast 2025-2030 ($ million)
Data Table on Canada - Market size and forecast 2025-2030 ($ million)
Chart on Canada - Year-over-year growth 2025-2030 (%)
Data Table on Canada - Year-over-year growth 2025-2030 (%)

12.3.3 Mexico - Market size and forecast 2025-2030

Chart on Mexico - Market size and forecast 2025-2030 ($ million)
Data Table on Mexico - Market size and forecast 2025-2030 ($ million)
Chart on Mexico - Year-over-year growth 2025-2030 (%)
Data Table on Mexico - Year-over-year growth 2025-2030 (%)

12.4 APAC - Market size and forecast 2025-2030

Chart on APAC - Market size and forecast 2025-2030 ($ million)
Data Table on APAC - Market size and forecast 2025-2030 ($ million)
Chart on APAC - Year-over-year growth 2025-2030 (%)
Data Table on APAC - Year-over-year growth 2025-2030 (%)
Chart on Regional Comparison - APAC
Data Table on Regional Comparison - APAC

12.4.1 China - Market size and forecast 2025-2030

Chart on China - Market size and forecast 2025-2030 ($ million)
Data Table on China - Market size and forecast 2025-2030 ($ million)
Chart on China - Year-over-year growth 2025-2030 (%)
Data Table on China - Year-over-year growth 2025-2030 (%)

12.4.2 India - Market size and forecast 2025-2030

Chart on India - Market size and forecast 2025-2030 ($ million)
Data Table on India - Market size and forecast 2025-2030 ($ million)
Chart on India - Year-over-year growth 2025-2030 (%)
Data Table on India - Year-over-year growth 2025-2030 (%)

12.4.3 Japan - Market size and forecast 2025-2030

Chart on Japan - Market size and forecast 2025-2030 ($ million)
Data Table on Japan - Market size and forecast 2025-2030 ($ million)
Chart on Japan - Year-over-year growth 2025-2030 (%)
Data Table on Japan - Year-over-year growth 2025-2030 (%)

12.4.4 South Korea - Market size and forecast 2025-2030

Chart on South Korea - Market size and forecast 2025-2030 ($ million)
Data Table on South Korea - Market size and forecast 2025-2030 ($ million)
Chart on South Korea - Year-over-year growth 2025-2030 (%)
Data Table on South Korea - Year-over-year growth 2025-2030 (%)

12.4.5 Australia - Market size and forecast 2025-2030

Chart on Australia - Market size and forecast 2025-2030 ($ million)
Data Table on Australia - Market size and forecast 2025-2030 ($ million)
Chart on Australia - Year-over-year growth 2025-2030 (%)
Data Table on Australia - Year-over-year growth 2025-2030 (%)

12.4.6 Indonesia - Market size and forecast 2025-2030

Chart on Indonesia - Market size and forecast 2025-2030 ($ million)
Data Table on Indonesia - Market size and forecast 2025-2030 ($ million)
Chart on Indonesia - Year-over-year growth 2025-2030 (%)
Data Table on Indonesia - Year-over-year growth 2025-2030 (%)

12.5 Europe - Market size and forecast 2025-2030

Chart on Europe - Market size and forecast 2025-2030 ($ million)
Data Table on Europe - Market size and forecast 2025-2030 ($ million)
Chart on Europe - Year-over-year growth 2025-2030 (%)
Data Table on Europe - Year-over-year growth 2025-2030 (%)
Chart on Regional Comparison - Europe
Data Table on Regional Comparison - Europe

12.5.1 Germany - Market size and forecast 2025-2030

Chart on Germany - Market size and forecast 2025-2030 ($ million)
Data Table on Germany - Market size and forecast 2025-2030 ($ million)
Chart on Germany - Year-over-year growth 2025-2030 (%)
Data Table on Germany - Year-over-year growth 2025-2030 (%)

12.5.2 UK - Market size and forecast 2025-2030

Chart on UK - Market size and forecast 2025-2030 ($ million)
Data Table on UK - Market size and forecast 2025-2030 ($ million)
Chart on UK - Year-over-year growth 2025-2030 (%)
Data Table on UK - Year-over-year growth 2025-2030 (%)

12.5.3 France - Market size and forecast 2025-2030

Chart on France - Market size and forecast 2025-2030 ($ million)
Data Table on France - Market size and forecast 2025-2030 ($ million)
Chart on France - Year-over-year growth 2025-2030 (%)
Data Table on France - Year-over-year growth 2025-2030 (%)

12.5.4 Italy - Market size and forecast 2025-2030

Chart on Italy - Market size and forecast 2025-2030 ($ million)
Data Table on Italy - Market size and forecast 2025-2030 ($ million)
Chart on Italy - Year-over-year growth 2025-2030 (%)
Data Table on Italy - Year-over-year growth 2025-2030 (%)

12.5.5 Spain - Market size and forecast 2025-2030

Chart on Spain - Market size and forecast 2025-2030 ($ million)
Data Table on Spain - Market size and forecast 2025-2030 ($ million)
Chart on Spain - Year-over-year growth 2025-2030 (%)
Data Table on Spain - Year-over-year growth 2025-2030 (%)

12.5.6 The Netherlands - Market size and forecast 2025-2030

Chart on The Netherlands - Market size and forecast 2025-2030 ($ million)
Data Table on The Netherlands - Market size and forecast 2025-2030 ($ million)
Chart on The Netherlands - Year-over-year growth 2025-2030 (%)
Data Table on The Netherlands - Year-over-year growth 2025-2030 (%)

12.6 Middle East and Africa - Market size and forecast 2025-2030

Chart on Middle East and Africa - Market size and forecast 2025-2030 ($ million)
Data Table on Middle East and Africa - Market size and forecast 2025-2030 ($ million)
Chart on Middle East and Africa - Year-over-year growth 2025-2030 (%)
Data Table on Middle East and Africa - Year-over-year growth 2025-2030 (%)
Chart on Regional Comparison - Middle East and Africa
Data Table on Regional Comparison - Middle East and Africa

12.6.1 Saudi Arabia - Market size and forecast 2025-2030

Chart on Saudi Arabia - Market size and forecast 2025-2030 ($ million)
Data Table on Saudi Arabia - Market size and forecast 2025-2030 ($ million)
Chart on Saudi Arabia - Year-over-year growth 2025-2030 (%)
Data Table on Saudi Arabia - Year-over-year growth 2025-2030 (%)

12.6.2 UAE - Market size and forecast 2025-2030

Chart on UAE - Market size and forecast 2025-2030 ($ million)
Data Table on UAE - Market size and forecast 2025-2030 ($ million)
Chart on UAE - Year-over-year growth 2025-2030 (%)
Data Table on UAE - Year-over-year growth 2025-2030 (%)

12.6.3 South Africa - Market size and forecast 2025-2030

Chart on South Africa - Market size and forecast 2025-2030 ($ million)
Data Table on South Africa - Market size and forecast 2025-2030 ($ million)
Chart on South Africa - Year-over-year growth 2025-2030 (%)
Data Table on South Africa - Year-over-year growth 2025-2030 (%)

12.6.4 Israel - Market size and forecast 2025-2030

Chart on Israel - Market size and forecast 2025-2030 ($ million)
Data Table on Israel - Market size and forecast 2025-2030 ($ million)
Chart on Israel - Year-over-year growth 2025-2030 (%)
Data Table on Israel - Year-over-year growth 2025-2030 (%)

12.6.5 Turkey - Market size and forecast 2025-2030

Chart on Turkey - Market size and forecast 2025-2030 ($ million)
Data Table on Turkey - Market size and forecast 2025-2030 ($ million)
Chart on Turkey - Year-over-year growth 2025-2030 (%)
Data Table on Turkey - Year-over-year growth 2025-2030 (%)

12.7 South America - Market size and forecast 2025-2030

Chart on South America - Market size and forecast 2025-2030 ($ million)
Data Table on South America - Market size and forecast 2025-2030 ($ million)
Chart on South America - Year-over-year growth 2025-2030 (%)
Data Table on South America - Year-over-year growth 2025-2030 (%)
Chart on Regional Comparison - South America
Data Table on Regional Comparison - South America

12.7.1 Brazil - Market size and forecast 2025-2030

Chart on Brazil - Market size and forecast 2025-2030 ($ million)
Data Table on Brazil - Market size and forecast 2025-2030 ($ million)
Chart on Brazil - Year-over-year growth 2025-2030 (%)
Data Table on Brazil - Year-over-year growth 2025-2030 (%)

12.7.2 Argentina - Market size and forecast 2025-2030

Chart on Argentina - Market size and forecast 2025-2030 ($ million)
Data Table on Argentina - Market size and forecast 2025-2030 ($ million)
Chart on Argentina - Year-over-year growth 2025-2030 (%)
Data Table on Argentina - Year-over-year growth 2025-2030 (%)

12.7.3 Chile - Market size and forecast 2025-2030

Chart on Chile - Market size and forecast 2025-2030 ($ million)
Data Table on Chile - Market size and forecast 2025-2030 ($ million)
Chart on Chile - Year-over-year growth 2025-2030 (%)
Data Table on Chile - Year-over-year growth 2025-2030 (%)

12.8 Market opportunity by geography

Market opportunity by geography ($ million)
Data Tables on Market opportunity by geography ($ million)

13. Drivers, Challenges, and Opportunity

13.1 Market drivers

Increasing demand for predictive maintenance
Need for operational efficiency optimization
Growing mobile workforce management requirements

13.2 Market challenges

Rising initial software implementation costs
Complex legacy system integration issues
Limited skilled workforce for technology

13.3 Impact of drivers and challenges

Impact of drivers and challenges in 2025 and 2030

13.4 Market opportunities

Integration of augmented reality tools
Expansion of edge computing intelligence
Rise of no-code automation

14. Competitive Landscape

14.1 Overview

14.2

Overview on criticality of inputs and factors of differentiation

14.3 Landscape disruption

Overview on factors of disruption

14.4 Industry risks

Impact of key risks on business

15. Competitive Analysis

15.1 Companies profiled

Companies covered

15.2 Company ranking index

15.3 Market positioning of companies

Matrix on companies position and classification

15.4 Comarch SA

Comarch SA - Overview
Comarch SA - Product / Service
Comarch SA - Key news
Comarch SA - Key offerings
SWOT

15.5 Fortive Corp.

Fortive Corp. - Overview
Fortive Corp. - Business segments
Fortive Corp. - Key news
Fortive Corp. - Key offerings
Fortive Corp. - Segment focus
SWOT

15.6 IFS World Operations AB

IFS World Operations AB - Overview
IFS World Operations AB - Product / Service
IFS World Operations AB - Key offerings
SWOT

15.7 Infor Inc.

Infor Inc. - Overview
Infor Inc. - Product / Service
Infor Inc. - Key news
Infor Inc. - Key offerings
SWOT

15.8 Microsoft Corp.

Microsoft Corp. - Overview
Microsoft Corp. - Business segments
Microsoft Corp. - Key news
Microsoft Corp. - Key offerings
Microsoft Corp. - Segment focus
SWOT

15.9 Oracle Corp.

Oracle Corp. - Overview
Oracle Corp. - Business segments
Oracle Corp. - Key news
Oracle Corp. - Key offerings
Oracle Corp. - Segment focus
SWOT

15.10 OverIT S.p.A

OverIT S.p.A - Overview
OverIT S.p.A - Product / Service
OverIT S.p.A - Key offerings
SWOT

15.11 PTC Inc.

PTC Inc. - Overview
PTC Inc. - Business segments
PTC Inc. - Key offerings
PTC Inc. - Segment focus
SWOT

15.12 Salesforce Inc.

Salesforce Inc. - Overview
Salesforce Inc. - Product / Service
Salesforce Inc. - Key news
Salesforce Inc. - Key offerings
SWOT

15.13 SAP SE

SAP SE - Overview
SAP SE - Business segments
SAP SE - Key news
SAP SE - Key offerings
SAP SE - Segment focus
SWOT

15.14 ServicePower Inc.

ServicePower Inc. - Overview
ServicePower Inc. - Product / Service
ServicePower Inc. - Key offerings
SWOT

15.15 Simpro Group

Simpro Group - Overview
Simpro Group - Product / Service
Simpro Group - Key offerings
SWOT

15.16 Syncron Holding AB

Syncron Holding AB - Overview
Syncron Holding AB - Product / Service
Syncron Holding AB - Key offerings
SWOT

15.17 Trimble Inc.

Trimble Inc. - Overview
Trimble Inc. - Business segments
Trimble Inc. - Key news
Trimble Inc. - Key offerings
Trimble Inc. - Segment focus
SWOT

15.18 Zinier Inc.

Zinier Inc. - Overview
Zinier Inc. - Product / Service
Zinier Inc. - Key offerings
SWOT

16. Appendix

16.1 Scope of the report

Market definition
Objectives
Notes and caveats

16.2 Inclusions and exclusions checklist

Inclusions checklist
Exclusions checklist

16.3 Currency conversion rates for US$

16.4 Research methodology

16.5 Data procurement

Information sources

16.6 Data validation

16.7 Validation techniques employed for market sizing

16.8 Data synthesis

16.9 360 degree market analysis

16.10 List of abbreviations

Research Methodology

Technavio presents a detailed picture of the market by way of study, synthesis, and summation of data from multiple sources. The analysts have presented the various facets of the market with a particular focus on identifying the key industry influencers. The data thus presented is comprehensive, reliable, and the result of extensive research, both primary and secondary.

INFORMATION SOURCES

Primary sources

  • Manufacturers and suppliers
  • Channel partners
  • Industry experts
  • Strategic decision makers

Secondary sources

  • Industry journals and periodicals
  • Government data
  • Financial reports of key industry players
  • Historical data
  • Press releases

DATA ANALYSIS

Data Synthesis

  • Collation of data
  • Estimation of key figures
  • Analysis of derived insights

Data Validation

  • Triangulation with data models
  • Reference against proprietary databases
  • Corroboration with industry experts

REPORT WRITING

Qualitative

  • Market drivers
  • Market challenges
  • Market trends
  • Five forces analysis

Quantitative

  • Market size and forecast
  • Market segmentation
  • Geographical insights
  • Competitive landscape

Interested in this report?

Get your sample now to see our research methodology and insights!

Download Now

Frequently Asked Questions

Field Service Management (FSM) Software market growth will increase by USD 2497.1 million during 2026-2030.

The Field Service Management (FSM) Software market is expected to grow at a CAGR of 14.8% during 2026-2030.

Field Service Management (FSM) Software market is segmented by End-user (IT and telecom, Healthcare, Retail, Transportation and logistics, Others) Deployment (On-premises, Cloud-based) Component (Solutions, Services)

Accruent, Comarch SA, FieldAware Group Ltd., FieldEZ, Fortive Corp., GeoConcept SAS, IFS World Operations AB, Infor Inc., Microsoft Corp., MSI Data LLC, Oracle Corp., OverIT S.p.A, PTC Inc., Salesforce Inc., SAP SE, ServicePower Inc., Simpro Group, Syncron Holding AB, Trimble Inc., Zinier Inc. are a few of the key vendors in the Field Service Management (FSM) Software market.

North America will register the highest growth rate of 32.9% among the other regions. Therefore, the Field Service Management (FSM) Software market in North America is expected to garner significant business opportunities for the vendors during the forecast period.

US, Canada, Mexico, China, India, Japan, South Korea, Australia, Indonesia, Germany, UK, France, Italy, Spain, The Netherlands, Saudi Arabia, UAE, South Africa, Israel, Turkey, Brazil, Argentina, Chile

  • Increasing demand for predictive maintenance is the driving factor this market.

The Field Service Management (FSM) Software market vendors should focus on grabbing business opportunities from the End-user segment as it accounted for the largest market share in the base year.