Fintech Market Analysis, Size, and Forecast 2026-2030: APAC (China, India, and Japan), North America (US, Canada, and Mexico), Europe (UK, Germany, and France), South America (Brazil and Argentina), Middle East and Africa (UAE, Saudi Arabia, and Israel), and Rest of World (ROW)

Fintech Market Analysis, Size, and Forecast 2026-2030:
APAC (China, India, and Japan), North America (US, Canada, and Mexico), Europe (UK, Germany, and France), South America (Brazil and Argentina), Middle East and Africa (UAE, Saudi Arabia, and Israel), and Rest of World (ROW)

Published: Mar 2026 289 Pages SKU: IRTNTR74783

Market Overview at a Glance

$1,029.16 B
Market Opportunity
32.8%
CAGR 2025 - 2030
39.1%
APAC Growth
$146.52 B
On-premises segment 2024

Fintech Market Size 2026-2030

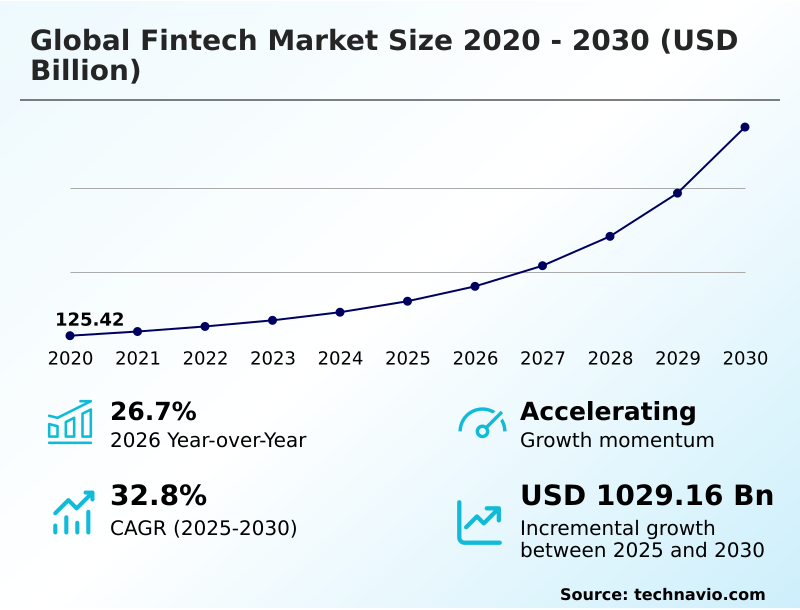
The fintech market size is valued to increase by USD 1,029.16 billion, at a CAGR of 32.8% from 2025 to 2030. Adoption of artificial intelligence to automate financial processes will drive the fintech market.

Major Market Trends & Insights

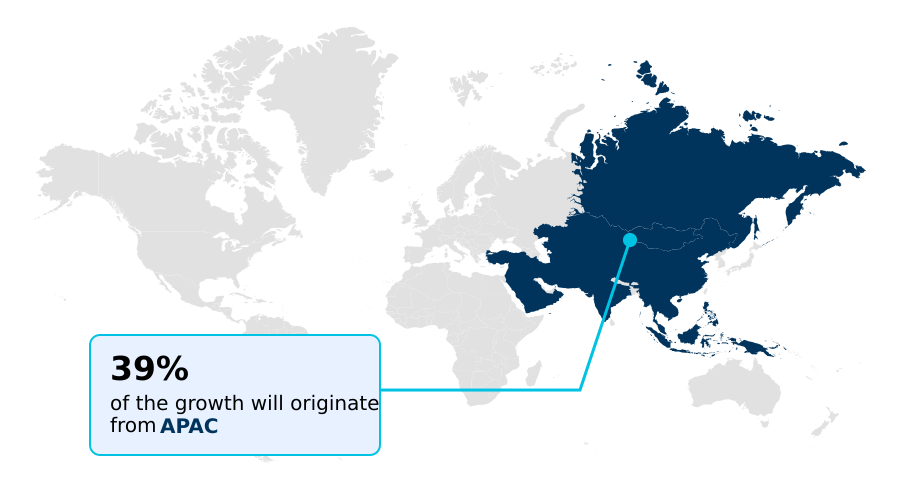
  • APAC dominated the market and accounted for a 39.1% growth during the forecast period.
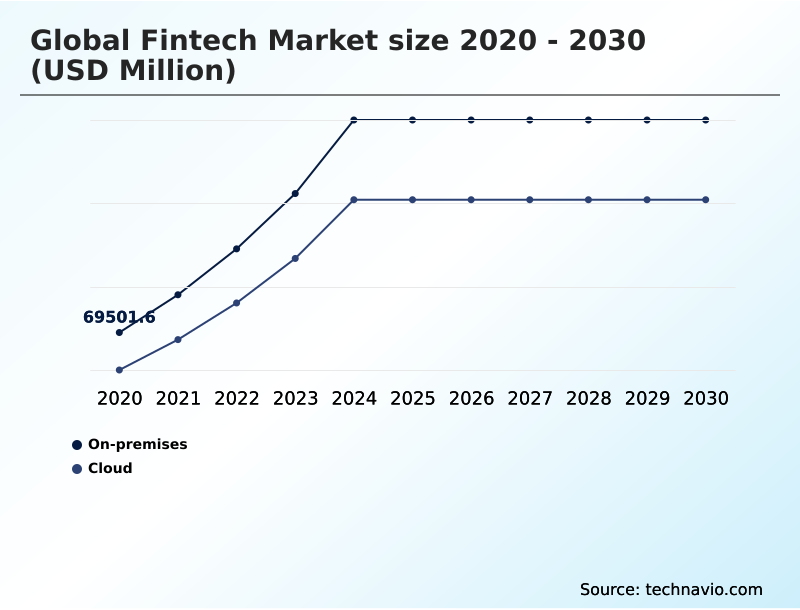
  • By Deployment - On-premises segment was valued at USD 146.52 billion in 2024
  • By End-user - Banking segment accounted for the largest market revenue share in 2024

Market Size & Forecast

  • Market Opportunities: USD 1,232.86 billion
  • Market Future Opportunities: USD 1,029.16 billion
  • CAGR from 2025 to 2030 : 32.8%

Market Summary

  • The fintech market is fundamentally reshaping the delivery of financial products through software-driven and data-centric solutions. This transformation is powered by the integration of advanced technologies like artificial intelligence and blockchain technology, which enhance transparency and efficiency in financial activities.
  • Core functions such as digital payments, digital lending, and wealth management platforms are being redefined by fintech innovation, moving away from traditional models toward more accessible and automated systems. A key aspect is the use of cloud computing to support real-time transactions and data analytics, enabling services like robo advisors and algorithmic trading.
  • For instance, in a business context, a logistics company can leverage an embedded finance platform to offer its drivers instant access to working capital based on real-time delivery data, bypassing lengthy bank approval processes. This seamless integration of financial services into non-financial platforms highlights the market's direction.
  • The focus on open banking and secure APIs is further accelerating this trend, fostering a connected ecosystem where data-driven insights improve everything from micro-investing for individuals to complex payment processing for global enterprises. The ongoing evolution in the fintech market is not just about new technology but about creating more inclusive and efficient financial systems.

What will be the Size of the Fintech Market during the forecast period?

Get Key Insights on Market Forecast (PDF) Request Free Sample

How is the Fintech Market Segmented?

The fintech industry research report provides comprehensive data (region-wise segment analysis), with forecasts and estimates in "USD million" for the period 2026-2030, as well as historical data from 2020-2024 for the following segments.

  • Deployment
    • On-premises
    • Cloud
  • End-user
    • Banking
    • Insurance
    • Securities
    • Others
  • Application
    • Fraud monitoring
    • KYC verification
    • Compliance and regulatory support
  • Geography
    • APAC
      • China
      • India
      • Japan
    • North America
      • US
      • Canada
      • Mexico
    • Europe
      • UK
      • Germany
      • France
    • South America
      • Brazil
      • Argentina
    • Middle East and Africa
      • UAE
      • Saudi Arabia
      • Israel
    • Rest of World (ROW)

By Deployment Insights

The on-premises segment is estimated to witness significant growth during the forecast period.

The on-premises segment remains critical for institutions prioritizing control over their financial data connectivity and payment infrastructure. This deployment model is preferred for core systems handling sensitive payment processing and lending platforms, where direct oversight of regulatory compliance is non-negotiable.

Organizations invest heavily in private server architecture to manage digital banking operations and proprietary trading algorithms, ensuring intellectual property is protected.

The use of on-premises systems for data-driven credit scoring and customer onboarding processes provides a level of customization and security that mitigates external threats.

While appearing traditional, these fintech automation solutions are evolving, with firms reporting a 15% improvement in processing speeds for high-frequency workloads after hardware upgrades, demonstrating a continued focus on performance within secure, self-managed environments.

Request Free Sample

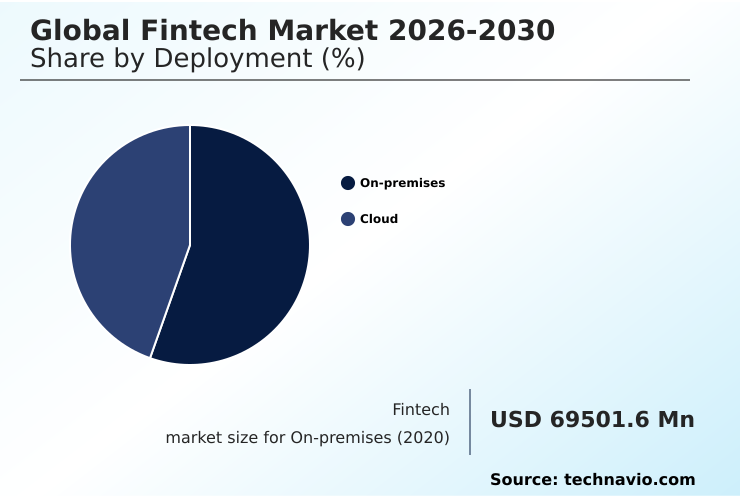
The On-premises segment was valued at USD 146.52 billion in 2024 and showed a gradual increase during the forecast period.

Request Free Sample

Regional Analysis

APAC is estimated to contribute 39.1% to the growth of the global market during the forecast period.Technavio’s analysts have elaborately explained the regional trends and drivers that shape the market during the forecast period.

See How Fintech Market Demand is Rising in APAC Request Free Sample

The geographic landscape of the fintech market is characterized by distinct regional dynamics and high rates of digital adoption.

In some regions, mobile commerce now captures 57% of all online transactions, driven by the proliferation of digital wallets and super-apps offering embedded finance.

This mobile-first approach is crucial for financial inclusion, leveraging AI-driven fraud detection to secure a high volume of micro-transactions. Meanwhile, mature markets are advancing through open banking APIs and the tokenization of real estate, unlocking new liquidity.

North America leads in institutional adoption of blockchain for financial assets, while APAC excels in real-time cross-border payments.

The expansion of fintech innovation hubs globally supports this growth, fostering development in areas like sharia-compliant fintech products and advanced peer-to-peer lending platforms, creating a diverse and interconnected ecosystem.

Market Dynamics

Our researchers analyzed the data with 2025 as the base year, along with the key drivers, trends, and challenges. A holistic analysis of drivers will help companies refine their marketing strategies to gain a competitive advantage.

  • Strategic analysis of the global fintech market 2026-2030 reveals several interconnected themes shaping its future. The impact of artificial intelligence on fintech is profound, driving AI for financial process automation across the board. This is most visible in the future of digital payment systems, where the role of cloud computing in fintech enables unprecedented scale and speed.
  • However, this rapid digitization also elevates the challenges in fintech cybersecurity, making it a primary concern for all operators. A key opportunity lies in the benefits of asset tokenization, which is unlocking new liquidity pools. Simultaneously, the growth of embedded finance solutions is blurring the lines between financial and non-financial services.
  • The trend of stablecoin adoption in cross-border payments is addressing long-standing inefficiencies, making global commerce more accessible. The regulatory landscape for fintech companies remains complex, but frameworks are adapting to new models like neobank vs traditional bank services and the rise of digital wallet technology advancements.
  • The open banking impact on traditional banks is forcing incumbents to innovate or partner with more agile players. Insurtech data analytics applications and advanced wealth management platform features are offering hyper-personalized customer experiences. Digital lending models for consumers are becoming more sophisticated, leveraging data to improve access to credit.
  • Platforms are now achieving approval times that are over 50% faster than traditional underwriting processes. Ultimately, understanding buy now pay later market trends and deploying effective regtech solutions for AML compliance are critical for navigating this dynamic environment.

What are the key market drivers leading to the rise in the adoption of Fintech Industry?

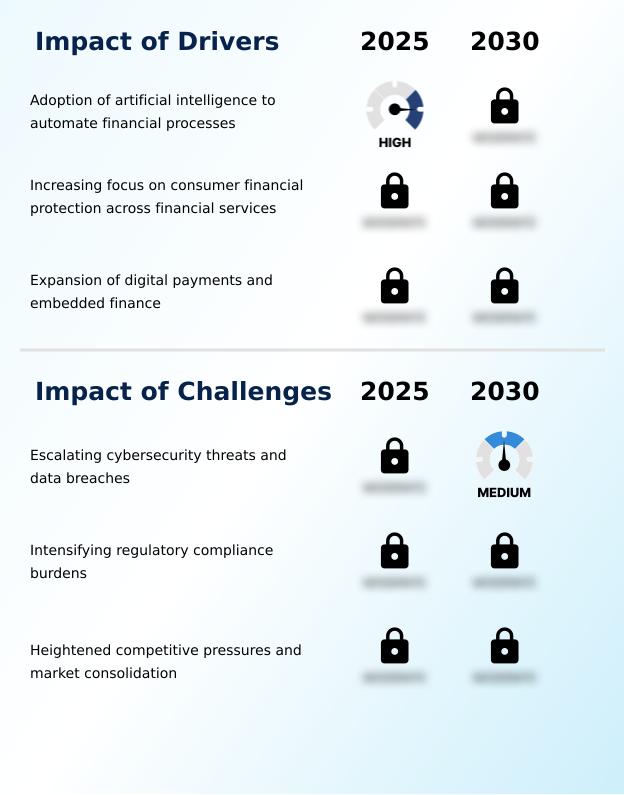
  • The adoption of artificial intelligence to automate financial processes is a key driver enhancing operational efficiency, customer experience, and risk management across the industry.

  • The adoption of artificial intelligence is a primary driver propelling the fintech market, enhancing everything from algorithmic trading to fraud detection. This is coupled with the rapid expansion of digital payments and embedded finance, which are transforming consumer interactions.
  • Digital payments now account for 66% of all e-commerce value globally, underscoring the shift away from traditional transaction methods. Regulatory evolution, particularly around open banking, is also a critical catalyst, fostering innovation by mandating secure data sharing.
  • This allows for the development of new services built on real-time payment systems and advanced payment infrastructure.
  • The convergence of these drivers is accelerating financial inclusion and enabling more personalized services, from robo advisors to sophisticated insurtech and regtech solutions that automate complex compliance tasks.

What are the market trends shaping the Fintech Industry?

  • The surge in stablecoin adoption is a primary trend driving fintech innovation, facilitating more efficient cross-border transactions and enhancing financial stability.

  • Key market trends are reshaping financial services, with asset tokenization emerging as a transformative force, enabling the mainstream integration of previously illiquid assets. The surge in stablecoin adoption is concurrently facilitating more efficient cross-border transactions, with some platforms reporting transaction processing speeds twice as fast as conventional methods.
  • This is complemented by the proliferation of super-apps, which bundle services like e-commerce payments and micro-investing into unified platforms, enhancing user engagement. The use of blockchain technology underpins many of these shifts, providing the secure foundation for both digital wallets and wealth management platforms.
  • As a result of these integrated systems, fintechs have demonstrated an ability to reduce identity-theft fraud by up to 78% through advanced KYC verification processes, highlighting the security benefits driving these trends.

What challenges does the Fintech Industry face during its growth?

  • Escalating cybersecurity threats and data breaches represent a significant challenge, eroding consumer trust and imposing substantial costs on the industry.

  • The fintech market faces significant challenges, primarily from escalating cybersecurity threats that can lead to major data breaches, with some incidents compromising over 400 gigabytes of client data. This risk is compounded by intensifying regulatory compliance burdens, as divergent global frameworks increase operational costs. For instance, penalties for non-compliance with anti-money laundering rules have risen sharply in certain jurisdictions.
  • Furthermore, heightened competitive pressures and market consolidation are squeezing margins, forcing companies to focus on profitability over pure growth. Navigating these hurdles requires continuous investment in robust security like biometric authentication, agile regtech solutions, and differentiated offerings in areas like digital lending and cryptocurrency exchange to maintain market confidence and sustainable growth.

Exclusive Technavio Analysis on Customer Landscape

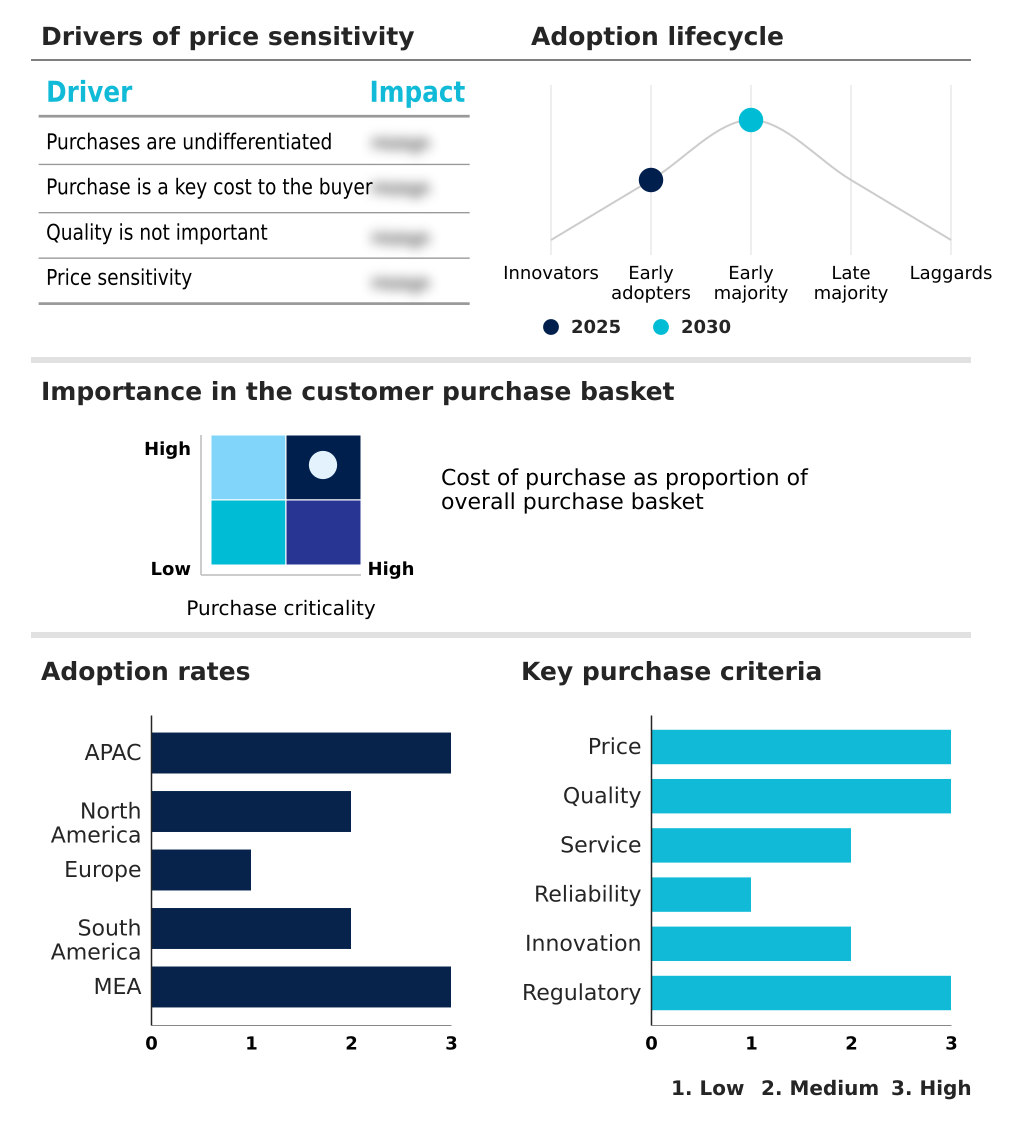
The fintech market forecasting report includes the adoption lifecycle of the market, covering from the innovator’s stage to the laggard’s stage. It focuses on adoption rates in different regions based on penetration. Furthermore, the fintech market report also includes key purchase criteria and drivers of price sensitivity to help companies evaluate and develop their market growth analysis strategies.

Customer Landscape of Fintech Industry

Competitive Landscape

Companies are implementing various strategies, such as strategic alliances, fintech market forecast, partnerships, mergers and acquisitions, geographical expansion, and product/service launches, to enhance their presence in the industry.

Acorns Advisers LLC - AI-driven micro-investing and automated wealth management solutions convert consumer spending into long-term, diversified investment portfolios through advanced behavioral analysis.

The industry research and growth report includes detailed analyses of the competitive landscape of the market and information about key companies, including:

  • Acorns Advisers LLC
  • Adyen NV
  • Affirm Holdings Inc.
  • Ant International
  • Avant LLC
  • Brex
  • Checkout Ltd.
  • Coinbase Global Inc.
  • DMI Finance
  • Earnest LLC
  • Fundrise LLC
  • Google LLC
  • PayPal Holdings Inc.
  • Plaid Inc.
  • Revolut Ltd.
  • SoFi Technologies Inc.
  • Stripe Inc.
  • Upstart Network Inc.
  • Wise Payments Ltd.
  • Zeta Services Inc.

Qualitative and quantitative analysis of companies has been conducted to help clients understand the wider business environment as well as the strengths and weaknesses of key industry players. Data is qualitatively analyzed to categorize companies as pure play, category-focused, industry-focused, and diversified; it is quantitatively analyzed to categorize companies as dominant, leading, strong, tentative, and weak.

Recent Development and News in Fintech market

  • In March 2025, Ant International expanded its Alipay+ solution to better facilitate cross-border transactions in Southeast Asia, connecting local digital wallets with international merchants.
  • In May 2025, the Monetary Authority of Singapore established a new regulatory framework for stablecoins, aiming to improve the safety and efficiency of digital asset transactions and encourage institutional investment.
  • In August 2025, Grab Holdings integrated advanced machine learning algorithms into its financial services to refine credit scoring for individuals and small businesses lacking formal credit histories in the region.
  • In February 2025, Stripe launched a suite of cross-border payment tools featuring automated currency conversion and localized payment methods to simplify international commerce for small and medium-sized businesses.

Dive into Technavio’s robust research methodology, blending expert interviews, extensive data synthesis, and validated models for unparalleled Fintech Market insights. See full methodology.

Market Scope
Page number 289
Base year 2025
Historic period 2020-2024
Forecast period 2026-2030
Growth momentum & CAGR Accelerate at a CAGR of 32.8%
Market growth 2026-2030 USD 1029156.0 million
Market structure Fragmented
YoY growth 2025-2026(%) 26.7%
Key countries China, India, Japan, Australia, Singapore, Indonesia, US, Canada, Mexico, UK, Germany, France, Switzerland, Sweden, The Netherlands, Brazil, Argentina, Chile, UAE, Saudi Arabia, Israel, South Africa and Nigeria
Competitive landscape Leading Companies, Market Positioning of Companies, Competitive Strategies, and Industry Risks

Request Free Sample

Research Analyst Overview

  • The fintech market's trajectory is defined by the integration of advanced technologies to enhance core financial operations. The deployment of artificial intelligence, machine learning, and cloud computing is no longer a differentiator but a baseline for competitive survival. Key applications span from automated wealth management and digital lending to sophisticated spend management platforms for corporate clients.
  • This technological shift is evident in the rise of neobanks and the increasing use of biometric authentication to secure transactions. Platforms are focusing on creating seamless payment infrastructure for everything from e-commerce payments to complex cross-border transactions. In a significant operational improvement, some firms have leveraged AI to refine credit scoring models, achieving a 10% reduction in default rates.
  • This data-driven approach is critical as the industry moves toward mainstream asset tokenization and broader stablecoin adoption, forcing strategic reevaluation in boardrooms regarding investment in payment processing, regulatory compliance, and overall digital banking capabilities.

What are the Key Data Covered in this Fintech Market Research and Growth Report?

  • What is the expected growth of the Fintech Market between 2026 and 2030?

    • USD 1,029.16 billion, at a CAGR of 32.8%

  • What segmentation does the market report cover?

    • The report is segmented by Deployment (On-premises, and Cloud), End-user (Banking, Insurance, Securities, and Others), Application (Fraud monitoring, KYC verification, and Compliance and regulatory support) and Geography (APAC, North America, Europe, South America, Middle East and Africa)

  • Which regions are analyzed in the report?

    • APAC, North America, Europe, South America and Middle East and Africa

  • What are the key growth drivers and market challenges?

    • Adoption of artificial intelligence to automate financial processes, Escalating cybersecurity threats and data breaches

  • Who are the major players in the Fintech Market?

    • Acorns Advisers LLC, Adyen NV, Affirm Holdings Inc., Ant International, Avant LLC, Brex, Checkout Ltd., Coinbase Global Inc., DMI Finance, Earnest LLC, Fundrise LLC, Google LLC, PayPal Holdings Inc., Plaid Inc., Revolut Ltd., SoFi Technologies Inc., Stripe Inc., Upstart Network Inc., Wise Payments Ltd. and Zeta Services Inc.

Market Research Insights

  • The evolution of financial services is marked by a significant push toward integrated digital experiences, with fintech automation solutions at the core of this shift. The effectiveness of AI-powered lending models is notable, with some platforms achieving a 10% reduction in default rates by leveraging alternative data.
  • Similarly, the adoption of AI-driven fraud detection systems has demonstrated substantial ROI, with certain implementations yielding a 300% boost in identifying sophisticated threats. This environment is fostering the growth of embedded financial products and stablecoin payment systems, which are becoming integral to e-commerce.
  • As companies navigate digital banking license requirements, the emphasis on a superior neobank customer experience and streamlined insurtech claims processing continues to intensify, reshaping consumer expectations and competitive dynamics across the sector.

We can help! Our analysts can customize this fintech market research report to meet your requirements.

Get in touch

1. Executive Summary

1.1 Market overview

Executive Summary - Chart on Market Overview
Executive Summary - Data Table on Market Overview
Executive Summary - Chart on Global Market Characteristics
Executive Summary - Chart on Market by Geography
Executive Summary - Chart on Market Segmentation by Deployment
Executive Summary - Chart on Market Segmentation by End-user
Executive Summary - Chart on Market Segmentation by Application
Executive Summary - Chart on Incremental Growth
Executive Summary - Data Table on Incremental Growth
Executive Summary - Chart on Company Market Positioning

2. Technavio Analysis

2.1 Analysis of price sensitivity, lifecycle, customer purchase basket, adoption rates, and purchase criteria

2.2 Criticality of inputs and Factors of differentiation

Chart on Overview on criticality of inputs and factors of differentiation

2.3 Factors of disruption

Chart on Overview on factors of disruption

2.4 Impact of drivers and challenges

Chart on Impact of drivers and challenges in 2025 and 2030

3. Market Landscape

3.1 Market ecosystem

Chart on Parent Market
Data Table on - Parent Market

3.2 Market characteristics

Chart on Market characteristics analysis

3.3 Value chain analysis

Chart on Value chain analysis

4. Market Sizing

4.1 Market definition

Data Table on Offerings of companies included in the market definition

4.2 Market segment analysis

Market segments

4.3 Market size 2025

4.4 Market outlook: Forecast for 2025-2030

Chart on Global - Market size and forecast 2025-2030 ($ million)
Data Table on Global - Market size and forecast 2025-2030 ($ million)
Chart on Global Market: Year-over-year growth 2025-2030 (%)
Data Table on Global Market: Year-over-year growth 2025-2030 (%)

5. Historic Market Size

5.1 Global Fintech Market 2020 - 2024

Historic Market Size - Data Table on Global Fintech Market 2020 - 2024 ($ million)

5.2 Deployment segment analysis 2020 - 2024

Historic Market Size - Deployment Segment 2020 - 2024 ($ million)

5.3 End-user segment analysis 2020 - 2024

Historic Market Size - End-user Segment 2020 - 2024 ($ million)

5.4 Application segment analysis 2020 - 2024

Historic Market Size - Application Segment 2020 - 2024 ($ million)

5.5 Geography segment analysis 2020 - 2024

Historic Market Size - Geography Segment 2020 - 2024 ($ million)

5.6 Country segment analysis 2020 - 2024

Historic Market Size - Country Segment 2020 - 2024 ($ million)

6. Qualitative Analysis

6.1 Impact of AI on Global Fintech Market

7. Five Forces Analysis

7.1 Five forces summary

Five forces analysis - Comparison between 2025 and 2030

7.2 Bargaining power of buyers

Bargaining power of buyers - Impact of key factors 2025 and 2030

7.3 Bargaining power of suppliers

Bargaining power of suppliers - Impact of key factors in 2025 and 2030

7.4 Threat of new entrants

Threat of new entrants - Impact of key factors in 2025 and 2030

7.5 Threat of substitutes

Threat of substitutes - Impact of key factors in 2025 and 2030

7.6 Threat of rivalry

Threat of rivalry - Impact of key factors in 2025 and 2030

7.7 Market condition

Chart on Market condition - Five forces 2025 and 2030

8. Market Segmentation by Deployment

8.1 Market segments

Chart on Deployment - Market share 2025-2030 (%)
Data Table on Deployment - Market share 2025-2030 (%)

8.2 Comparison by Deployment

Chart on Comparison by Deployment
Data Table on Comparison by Deployment

8.3 On-premises - Market size and forecast 2025-2030

Chart on On-premises - Market size and forecast 2025-2030 ($ million)
Data Table on On-premises - Market size and forecast 2025-2030 ($ million)
Chart on On-premises - Year-over-year growth 2025-2030 (%)
Data Table on On-premises - Year-over-year growth 2025-2030 (%)

8.4 Cloud - Market size and forecast 2025-2030

Chart on Cloud - Market size and forecast 2025-2030 ($ million)
Data Table on Cloud - Market size and forecast 2025-2030 ($ million)
Chart on Cloud - Year-over-year growth 2025-2030 (%)
Data Table on Cloud - Year-over-year growth 2025-2030 (%)

8.5 Market opportunity by Deployment

Market opportunity by Deployment ($ million)
Data Table on Market opportunity by Deployment ($ million)

9. Market Segmentation by End-user

9.1 Market segments

Chart on End-user - Market share 2025-2030 (%)
Data Table on End-user - Market share 2025-2030 (%)

9.2 Comparison by End-user

Chart on Comparison by End-user
Data Table on Comparison by End-user

9.3 Banking - Market size and forecast 2025-2030

Chart on Banking - Market size and forecast 2025-2030 ($ million)
Data Table on Banking - Market size and forecast 2025-2030 ($ million)
Chart on Banking - Year-over-year growth 2025-2030 (%)
Data Table on Banking - Year-over-year growth 2025-2030 (%)

9.4 Insurance - Market size and forecast 2025-2030

Chart on Insurance - Market size and forecast 2025-2030 ($ million)
Data Table on Insurance - Market size and forecast 2025-2030 ($ million)
Chart on Insurance - Year-over-year growth 2025-2030 (%)
Data Table on Insurance - Year-over-year growth 2025-2030 (%)

9.5 Securities - Market size and forecast 2025-2030

Chart on Securities - Market size and forecast 2025-2030 ($ million)
Data Table on Securities - Market size and forecast 2025-2030 ($ million)
Chart on Securities - Year-over-year growth 2025-2030 (%)
Data Table on Securities - Year-over-year growth 2025-2030 (%)

9.6 Others - Market size and forecast 2025-2030

Chart on Others - Market size and forecast 2025-2030 ($ million)
Data Table on Others - Market size and forecast 2025-2030 ($ million)
Chart on Others - Year-over-year growth 2025-2030 (%)
Data Table on Others - Year-over-year growth 2025-2030 (%)

9.7 Market opportunity by End-user

Market opportunity by End-user ($ million)
Data Table on Market opportunity by End-user ($ million)

10. Market Segmentation by Application

10.1 Market segments

Chart on Application - Market share 2025-2030 (%)
Data Table on Application - Market share 2025-2030 (%)

10.2 Comparison by Application

Chart on Comparison by Application
Data Table on Comparison by Application

10.3 Fraud monitoring - Market size and forecast 2025-2030

Chart on Fraud monitoring - Market size and forecast 2025-2030 ($ million)
Data Table on Fraud monitoring - Market size and forecast 2025-2030 ($ million)
Chart on Fraud monitoring - Year-over-year growth 2025-2030 (%)
Data Table on Fraud monitoring - Year-over-year growth 2025-2030 (%)

10.4 KYC verification - Market size and forecast 2025-2030

Chart on KYC verification - Market size and forecast 2025-2030 ($ million)
Data Table on KYC verification - Market size and forecast 2025-2030 ($ million)
Chart on KYC verification - Year-over-year growth 2025-2030 (%)
Data Table on KYC verification - Year-over-year growth 2025-2030 (%)

10.5 Compliance and regulatory support - Market size and forecast 2025-2030

Chart on Compliance and regulatory support - Market size and forecast 2025-2030 ($ million)
Data Table on Compliance and regulatory support - Market size and forecast 2025-2030 ($ million)
Chart on Compliance and regulatory support - Year-over-year growth 2025-2030 (%)
Data Table on Compliance and regulatory support - Year-over-year growth 2025-2030 (%)

10.6 Market opportunity by Application

Market opportunity by Application ($ million)
Data Table on Market opportunity by Application ($ million)

11. Customer Landscape

11.1 Customer landscape overview

Analysis of price sensitivity, lifecycle, customer purchase basket, adoption rates, and purchase criteria

12. Geographic Landscape

12.1 Geographic segmentation

Chart on Market share by geography 2025-2030 (%)
Data Table on Market share by geography 2025-2030 (%)

12.2 Geographic comparison

Chart on Geographic comparison
Data Table on Geographic comparison

12.3 APAC - Market size and forecast 2025-2030

Chart on APAC - Market size and forecast 2025-2030 ($ million)
Data Table on APAC - Market size and forecast 2025-2030 ($ million)
Chart on APAC - Year-over-year growth 2025-2030 (%)
Data Table on APAC - Year-over-year growth 2025-2030 (%)
Chart on Regional Comparison - APAC
Data Table on Regional Comparison - APAC

12.3.1 China - Market size and forecast 2025-2030

Chart on China - Market size and forecast 2025-2030 ($ million)
Data Table on China - Market size and forecast 2025-2030 ($ million)
Chart on China - Year-over-year growth 2025-2030 (%)
Data Table on China - Year-over-year growth 2025-2030 (%)

12.3.2 India - Market size and forecast 2025-2030

Chart on India - Market size and forecast 2025-2030 ($ million)
Data Table on India - Market size and forecast 2025-2030 ($ million)
Chart on India - Year-over-year growth 2025-2030 (%)
Data Table on India - Year-over-year growth 2025-2030 (%)

12.3.3 Japan - Market size and forecast 2025-2030

Chart on Japan - Market size and forecast 2025-2030 ($ million)
Data Table on Japan - Market size and forecast 2025-2030 ($ million)
Chart on Japan - Year-over-year growth 2025-2030 (%)
Data Table on Japan - Year-over-year growth 2025-2030 (%)

12.3.4 Australia - Market size and forecast 2025-2030

Chart on Australia - Market size and forecast 2025-2030 ($ million)
Data Table on Australia - Market size and forecast 2025-2030 ($ million)
Chart on Australia - Year-over-year growth 2025-2030 (%)
Data Table on Australia - Year-over-year growth 2025-2030 (%)

12.3.5 Singapore - Market size and forecast 2025-2030

Chart on Singapore - Market size and forecast 2025-2030 ($ million)
Data Table on Singapore - Market size and forecast 2025-2030 ($ million)
Chart on Singapore - Year-over-year growth 2025-2030 (%)
Data Table on Singapore - Year-over-year growth 2025-2030 (%)

12.3.6 Indonesia - Market size and forecast 2025-2030

Chart on Indonesia - Market size and forecast 2025-2030 ($ million)
Data Table on Indonesia - Market size and forecast 2025-2030 ($ million)
Chart on Indonesia - Year-over-year growth 2025-2030 (%)
Data Table on Indonesia - Year-over-year growth 2025-2030 (%)

12.4 North America - Market size and forecast 2025-2030

Chart on North America - Market size and forecast 2025-2030 ($ million)
Data Table on North America - Market size and forecast 2025-2030 ($ million)
Chart on North America - Year-over-year growth 2025-2030 (%)
Data Table on North America - Year-over-year growth 2025-2030 (%)
Chart on Regional Comparison - North America
Data Table on Regional Comparison - North America

12.4.1 US - Market size and forecast 2025-2030

Chart on US - Market size and forecast 2025-2030 ($ million)
Data Table on US - Market size and forecast 2025-2030 ($ million)
Chart on US - Year-over-year growth 2025-2030 (%)
Data Table on US - Year-over-year growth 2025-2030 (%)

12.4.2 Canada - Market size and forecast 2025-2030

Chart on Canada - Market size and forecast 2025-2030 ($ million)
Data Table on Canada - Market size and forecast 2025-2030 ($ million)
Chart on Canada - Year-over-year growth 2025-2030 (%)
Data Table on Canada - Year-over-year growth 2025-2030 (%)

12.4.3 Mexico - Market size and forecast 2025-2030

Chart on Mexico - Market size and forecast 2025-2030 ($ million)
Data Table on Mexico - Market size and forecast 2025-2030 ($ million)
Chart on Mexico - Year-over-year growth 2025-2030 (%)
Data Table on Mexico - Year-over-year growth 2025-2030 (%)

12.5 Europe - Market size and forecast 2025-2030

Chart on Europe - Market size and forecast 2025-2030 ($ million)
Data Table on Europe - Market size and forecast 2025-2030 ($ million)
Chart on Europe - Year-over-year growth 2025-2030 (%)
Data Table on Europe - Year-over-year growth 2025-2030 (%)
Chart on Regional Comparison - Europe
Data Table on Regional Comparison - Europe

12.5.1 UK - Market size and forecast 2025-2030

Chart on UK - Market size and forecast 2025-2030 ($ million)
Data Table on UK - Market size and forecast 2025-2030 ($ million)
Chart on UK - Year-over-year growth 2025-2030 (%)
Data Table on UK - Year-over-year growth 2025-2030 (%)

12.5.2 Germany - Market size and forecast 2025-2030

Chart on Germany - Market size and forecast 2025-2030 ($ million)
Data Table on Germany - Market size and forecast 2025-2030 ($ million)
Chart on Germany - Year-over-year growth 2025-2030 (%)
Data Table on Germany - Year-over-year growth 2025-2030 (%)

12.5.3 France - Market size and forecast 2025-2030

Chart on France - Market size and forecast 2025-2030 ($ million)
Data Table on France - Market size and forecast 2025-2030 ($ million)
Chart on France - Year-over-year growth 2025-2030 (%)
Data Table on France - Year-over-year growth 2025-2030 (%)

12.5.4 Switzerland - Market size and forecast 2025-2030

Chart on Switzerland - Market size and forecast 2025-2030 ($ million)
Data Table on Switzerland - Market size and forecast 2025-2030 ($ million)
Chart on Switzerland - Year-over-year growth 2025-2030 (%)
Data Table on Switzerland - Year-over-year growth 2025-2030 (%)

12.5.5 Sweden - Market size and forecast 2025-2030

Chart on Sweden - Market size and forecast 2025-2030 ($ million)
Data Table on Sweden - Market size and forecast 2025-2030 ($ million)
Chart on Sweden - Year-over-year growth 2025-2030 (%)
Data Table on Sweden - Year-over-year growth 2025-2030 (%)

12.5.6 The Netherlands - Market size and forecast 2025-2030

Chart on The Netherlands - Market size and forecast 2025-2030 ($ million)
Data Table on The Netherlands - Market size and forecast 2025-2030 ($ million)
Chart on The Netherlands - Year-over-year growth 2025-2030 (%)
Data Table on The Netherlands - Year-over-year growth 2025-2030 (%)

12.6 South America - Market size and forecast 2025-2030

Chart on South America - Market size and forecast 2025-2030 ($ million)
Data Table on South America - Market size and forecast 2025-2030 ($ million)
Chart on South America - Year-over-year growth 2025-2030 (%)
Data Table on South America - Year-over-year growth 2025-2030 (%)
Chart on Regional Comparison - South America
Data Table on Regional Comparison - South America

12.6.1 Brazil - Market size and forecast 2025-2030

Chart on Brazil - Market size and forecast 2025-2030 ($ million)
Data Table on Brazil - Market size and forecast 2025-2030 ($ million)
Chart on Brazil - Year-over-year growth 2025-2030 (%)
Data Table on Brazil - Year-over-year growth 2025-2030 (%)

12.6.2 Argentina - Market size and forecast 2025-2030

Chart on Argentina - Market size and forecast 2025-2030 ($ million)
Data Table on Argentina - Market size and forecast 2025-2030 ($ million)
Chart on Argentina - Year-over-year growth 2025-2030 (%)
Data Table on Argentina - Year-over-year growth 2025-2030 (%)

12.6.3 Chile - Market size and forecast 2025-2030

Chart on Chile - Market size and forecast 2025-2030 ($ million)
Data Table on Chile - Market size and forecast 2025-2030 ($ million)
Chart on Chile - Year-over-year growth 2025-2030 (%)
Data Table on Chile - Year-over-year growth 2025-2030 (%)

12.7 Middle East and Africa - Market size and forecast 2025-2030

Chart on Middle East and Africa - Market size and forecast 2025-2030 ($ million)
Data Table on Middle East and Africa - Market size and forecast 2025-2030 ($ million)
Chart on Middle East and Africa - Year-over-year growth 2025-2030 (%)
Data Table on Middle East and Africa - Year-over-year growth 2025-2030 (%)
Chart on Regional Comparison - Middle East and Africa
Data Table on Regional Comparison - Middle East and Africa

12.7.1 UAE - Market size and forecast 2025-2030

Chart on UAE - Market size and forecast 2025-2030 ($ million)
Data Table on UAE - Market size and forecast 2025-2030 ($ million)
Chart on UAE - Year-over-year growth 2025-2030 (%)
Data Table on UAE - Year-over-year growth 2025-2030 (%)

12.7.2 Saudi Arabia - Market size and forecast 2025-2030

Chart on Saudi Arabia - Market size and forecast 2025-2030 ($ million)
Data Table on Saudi Arabia - Market size and forecast 2025-2030 ($ million)
Chart on Saudi Arabia - Year-over-year growth 2025-2030 (%)
Data Table on Saudi Arabia - Year-over-year growth 2025-2030 (%)

12.7.3 Israel - Market size and forecast 2025-2030

Chart on Israel - Market size and forecast 2025-2030 ($ million)
Data Table on Israel - Market size and forecast 2025-2030 ($ million)
Chart on Israel - Year-over-year growth 2025-2030 (%)
Data Table on Israel - Year-over-year growth 2025-2030 (%)

12.7.4 South Africa - Market size and forecast 2025-2030

Chart on South Africa - Market size and forecast 2025-2030 ($ million)
Data Table on South Africa - Market size and forecast 2025-2030 ($ million)
Chart on South Africa - Year-over-year growth 2025-2030 (%)
Data Table on South Africa - Year-over-year growth 2025-2030 (%)

12.7.5 Nigeria - Market size and forecast 2025-2030

Chart on Nigeria - Market size and forecast 2025-2030 ($ million)
Data Table on Nigeria - Market size and forecast 2025-2030 ($ million)
Chart on Nigeria - Year-over-year growth 2025-2030 (%)
Data Table on Nigeria - Year-over-year growth 2025-2030 (%)

12.8 Market opportunity by geography

Market opportunity by geography ($ million)
Data Tables on Market opportunity by geography ($ million)

13. Drivers, Challenges, and Opportunity

13.1 Market drivers

Adoption of artificial intelligence to automate financial processes
Increasing focus on consumer financial protection across financial services
Expansion of digital payments and embedded finance

13.2 Market challenges

Escalating cybersecurity threats and data breaches
Intensifying regulatory compliance burdens
Heightened competitive pressures and market consolidation

13.3 Impact of drivers and challenges

Impact of drivers and challenges in 2025 and 2030

13.4 Market opportunities

Surge in stablecoin adoption driving fintech innovation
Mainstream integration of asset tokenization
Proliferation of super apps in financial services

14. Competitive Landscape

14.1 Overview

14.2

Overview on criticality of inputs and factors of differentiation

14.3 Landscape disruption

Overview on factors of disruption

14.4 Industry risks

Impact of key risks on business

15. Competitive Analysis

15.1 Companies profiled

Companies covered

15.2 Company ranking index

15.3 Market positioning of companies

Matrix on companies position and classification

15.4 Acorns Advisers LLC

Acorns Advisers LLC - Overview
Acorns Advisers LLC - Product / Service
Acorns Advisers LLC - Key offerings
SWOT

15.5 Adyen NV

Adyen NV - Overview
Adyen NV - Product / Service
Adyen NV - Key offerings
SWOT

15.6 Affirm Holdings Inc.

Affirm Holdings Inc. - Overview
Affirm Holdings Inc. - Product / Service
Affirm Holdings Inc. - Key offerings
SWOT

15.7 Ant International

Ant International - Overview
Ant International - Product / Service
Ant International - Key offerings
SWOT

15.8 Brex

Brex - Overview
Brex - Product / Service
Brex - Key offerings
SWOT

15.9 Checkout Ltd.

Checkout Ltd. - Overview
Checkout Ltd. - Product / Service
Checkout Ltd. - Key offerings
SWOT

15.10 Coinbase Global Inc.

Coinbase Global Inc. - Overview
Coinbase Global Inc. - Product / Service
Coinbase Global Inc. - Key offerings
SWOT

15.11 Google LLC

Google LLC - Overview
Google LLC - Product / Service
Google LLC - Key offerings
SWOT

15.12 PayPal Holdings Inc.

PayPal Holdings Inc. - Overview
PayPal Holdings Inc. - Product / Service
PayPal Holdings Inc. - Key news
PayPal Holdings Inc. - Key offerings
SWOT

15.13 Plaid Inc.

Plaid Inc. - Overview
Plaid Inc. - Product / Service
Plaid Inc. - Key offerings
SWOT

15.14 Revolut Ltd.

Revolut Ltd. - Overview
Revolut Ltd. - Product / Service
Revolut Ltd. - Key offerings
SWOT

15.15 SoFi Technologies Inc.

SoFi Technologies Inc. - Overview
SoFi Technologies Inc. - Product / Service
SoFi Technologies Inc. - Key offerings
SWOT

15.16 Stripe Inc.

Stripe Inc. - Overview
Stripe Inc. - Product / Service
Stripe Inc. - Key offerings
SWOT

15.17 Upstart Network Inc.

Upstart Network Inc. - Overview
Upstart Network Inc. - Product / Service
Upstart Network Inc. - Key offerings
SWOT

15.18 Wise Payments Ltd.

Wise Payments Ltd. - Overview
Wise Payments Ltd. - Business segments
Wise Payments Ltd. - Key offerings
Wise Payments Ltd. - Segment focus
SWOT

16. Appendix

16.1 Scope of the report

Market definition
Objectives
Notes and caveats

16.2 Inclusions and exclusions checklist

Inclusions checklist
Exclusions checklist

16.3 Currency conversion rates for US$

16.4 Research methodology

16.5 Data procurement

Information sources

16.6 Data validation

16.7 Validation techniques employed for market sizing

16.8 Data synthesis

16.9 360 degree market analysis

16.10 List of abbreviations

Research Methodology

Technavio presents a detailed picture of the market by way of study, synthesis, and summation of data from multiple sources. The analysts have presented the various facets of the market with a particular focus on identifying the key industry influencers. The data thus presented is comprehensive, reliable, and the result of extensive research, both primary and secondary.

INFORMATION SOURCES

Primary sources

  • Manufacturers and suppliers
  • Channel partners
  • Industry experts
  • Strategic decision makers

Secondary sources

  • Industry journals and periodicals
  • Government data
  • Financial reports of key industry players
  • Historical data
  • Press releases

DATA ANALYSIS

Data Synthesis

  • Collation of data
  • Estimation of key figures
  • Analysis of derived insights

Data Validation

  • Triangulation with data models
  • Reference against proprietary databases
  • Corroboration with industry experts

REPORT WRITING

Qualitative

  • Market drivers
  • Market challenges
  • Market trends
  • Five forces analysis

Quantitative

  • Market size and forecast
  • Market segmentation
  • Geographical insights
  • Competitive landscape

Interested in this report?

Get your sample now to see our research methodology and insights!

Download Now

Frequently Asked Questions

Fintech market growth will increase by USD 1029156.0 million during 2026-2030.

The Fintech market is expected to grow at a CAGR of 32.8% during 2026-2030.

Fintech market is segmented by Deployment (On-premises, Cloud) End-user (Banking, Insurance, Securities, Others) Application (Fraud monitoring, KYC verification, Compliance and regulatory support)

Acorns Advisers LLC, Adyen NV, Affirm Holdings Inc., Ant International, Avant LLC, Brex, Checkout Ltd., Coinbase Global Inc., DMI Finance, Earnest LLC, Fundrise LLC, Google LLC, PayPal Holdings Inc., Plaid Inc., Revolut Ltd., SoFi Technologies Inc., Stripe Inc., Upstart Network Inc., Wise Payments Ltd., Zeta Services Inc. are a few of the key vendors in the Fintech market.

APAC will register the highest growth rate of 39.1% among the other regions. Therefore, the Fintech market in APAC is expected to garner significant business opportunities for the vendors during the forecast period.

China, India, Japan, Australia, Singapore, Indonesia, US, Canada, Mexico, UK, Germany, France, Switzerland, Sweden, The Netherlands, Brazil, Argentina, Chile, UAE, Saudi Arabia, Israel, South Africa, Nigeria

  • Adoption of artificial intelligence to automate financial processes is the driving factor this market.

The Fintech market vendors should focus on grabbing business opportunities from the Deployment segment as it accounted for the largest market share in the base year.
RIA - Research AI Assistant
Ask RIA