Fish Box Market Size 2024-2028
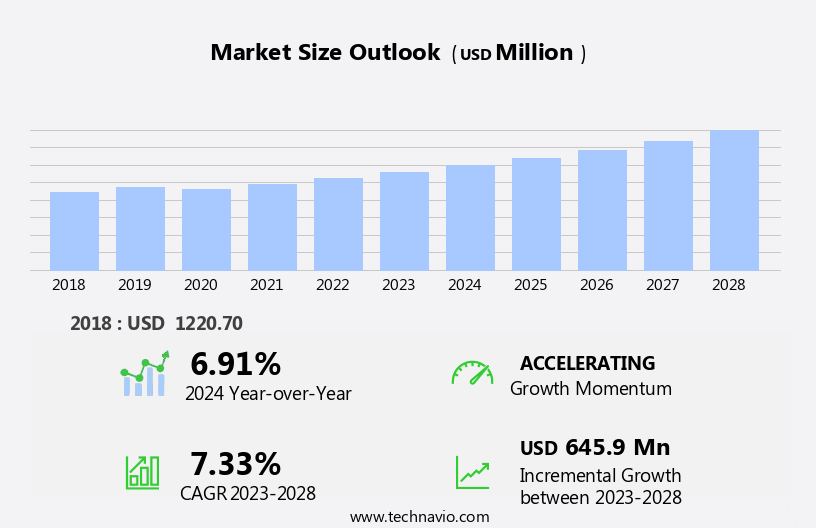
The fish box market size is forecast to increase by USD 645.9 million at a CAGR of 7.33% between 2023 and 2028.
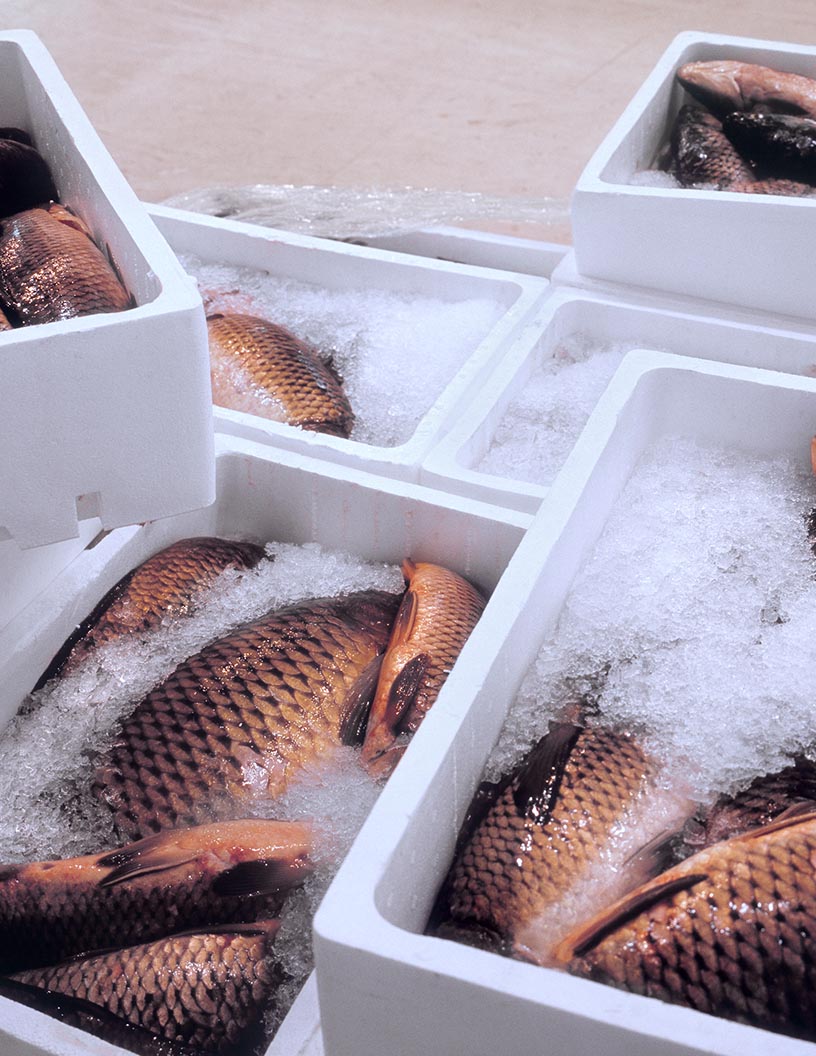
- The market is experiencing significant growth due to the rising consumption of fish and fish products worldwide. The increasing preference for seafood as a source of protein is driving the demand for fish boxes to ensure the safe and efficient transportation of these perishable goods. Another key trend in the market is the demand for lightweight packaging solutions, which not only reduce transportation costs but also minimize the carbon footprint of the industry. However, the market faces challenges due to the increasing price of polymers, the primary material used in the production of fish boxes.
- This price hike may lead to higher production costs for manufacturers and potentially result in increased prices for consumers. To mitigate these challenges, companies in the market should explore alternative materials or seek cost-effective sourcing strategies for polymers. Additionally, investing in research and development of innovative packaging solutions that address both the need for lightweighting and cost efficiency could provide a competitive edge in the market. Overall, the market presents opportunities for growth, particularly in regions with high fish consumption, while requiring careful consideration of raw material costs and the development of sustainable packaging solutions.
What will be the Size of the Fish Box Market during the forecast period?
- In the dynamic and evolving market, temperature-controlled shipping plays a crucial role in preserving the quality of various offerings, including seasonal fish, frozen fish, and fresh fish. This sector caters to diverse applications, from food delivery services and price optimization for businesses to consumer preferences for customizable boxes and sustainable seafood. Fish recipes and service differentiation are key factors driving innovation in the market. Restaurant supply and online grocery shopping have integrated fish boxes into their offerings, providing weekly or monthly deliveries to customers' doors. Home delivery models have gained popularity, especially during the ongoing health crisis, as consumers seek convenience and safety.
- Data analytics and consumer preferences shape the market, with subscription models and seafood sourcing strategies adapting to meet the demands of various customer segments. Seafood meal kits and fish fillets, along with variety packs and frozen seafood, cater to the growing trend of healthy eating and sustainable packaging. Operational efficiency and food safety are essential considerations for fish wholesalers and retailers, with cold chain logistics and supply chain management playing a vital role in maintaining product quality and ensuring timely delivery. The geographic reach of fish box providers continues to expand, offering ocean-friendly seafood options to an increasingly diverse customer base.
- Price optimization and competitive pricing strategies are essential for businesses looking to attract and retain customers, with value proposition and customizable boxes appealing to various consumer segments. Packaging innovations and fish preparation techniques further differentiate offerings, ensuring a unique value proposition for each player in the market. Food allergies and seafood snacks are emerging trends, with fish boxes catering to these preferences and ensuring food safety. The market continues to unfold, with ongoing patterns and applications shaping the competitive landscape.
How is this Fish Box Industry segmented?
The fish box industry research report provides comprehensive data (region-wise segment analysis), with forecasts and estimates in "USD million" for the period 2024-2028, as well as historical data from 2018-2022 for the following segments.
- Application
- Terminal
- Supermarket
- Material
- Expanded polystyrene
- Polypropylene
- Others
- Geography
- North America
- US
- Europe
- Spain
- APAC
- China
- India
- Indonesia
- Rest of World (ROW)
- North America
By Application Insights
The terminal segment is estimated to witness significant growth during the forecast period.
In the dynamic world of seafood markets, diet trends favoring healthier eating have driven customer acquisition towards high-quality, fresh and sustainable seafood offerings. Wholesalers source fish from various seafood terminals, ensuring efficient operations through temperature-controlled shipping and timely delivery. Subscription models cater to consumers' preferences, offering weekly or monthly fish deliveries. Local seafood and restaurant supplies benefit from these services, ensuring a consistent supply of fresh fish. Food allergies necessitate careful sourcing and handling, making operational efficiency crucial. Fish delivery services employ data analytics to optimize prices and cater to diverse consumer segments with customizable boxes.
Frozen and fresh fish, seasonal catches, and seafood meal kits cater to various customer needs. Sustainable seafood and ocean-friendly practices are emphasized, prioritizing food safety and ethical sourcing. Retail fish markets and online grocery shopping platforms leverage technology for order fulfillment and home delivery. Seafood cooking classes and recipe suggestions add value to the proposition. Customers appreciate the convenience and variety packs, frozen seafood, and seafood snacks. Cold chain logistics ensure the fish remains fresh during transportation, extending its geographic reach. Sustainable packaging and supply chain management are essential for businesses seeking competitive pricing and customer loyalty.
Packaging innovations cater to the needs of the industry, ensuring fish preparation remains easy and convenient. The value proposition lies in providing a wide variety of fish fillets, whole fish, and customizable boxes, all while promoting healthy eating and catering to diverse consumer preferences.
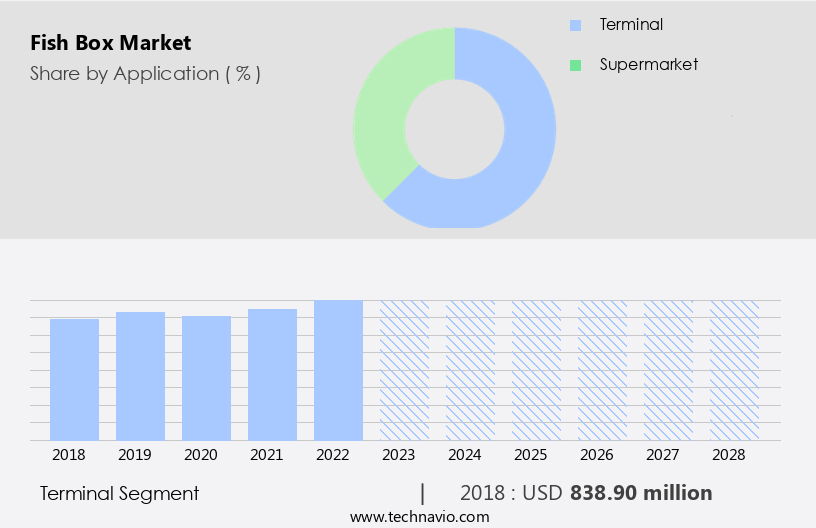
The Terminal segment was valued at USD 838.90 million in 2018 and showed a gradual increase during the forecast period.
Regional Analysis
APAC is estimated to contribute 45% to the growth of the global market during the forecast period. Technavio's analysts have elaborately explained the regional trends and drivers that shape the market during the forecast period.
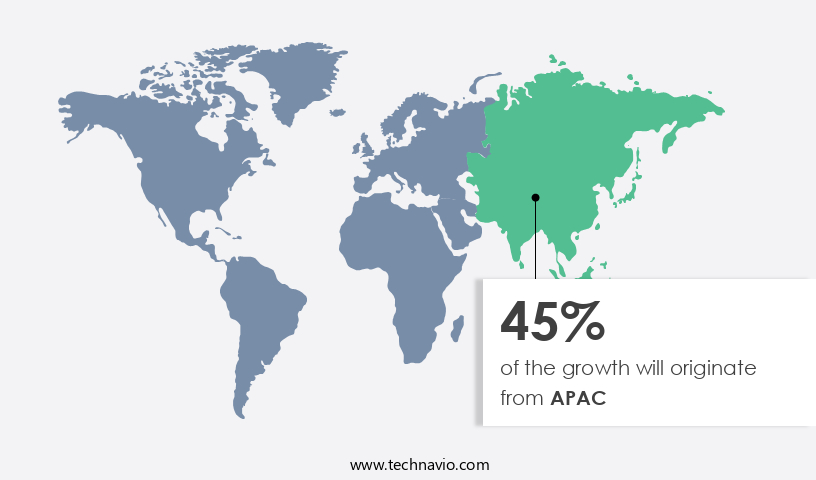
The market in the region is experiencing significant growth due to increasing consumer preferences for seafood, particularly in China and India. In China, the demand for insulated fish boxes is high, driven by the popularity of frozen fish and other types, including cured and canned varieties. India is another rapidly expanding market for packaged and processed fish products, with fish fillets, canned tuna, and fish pickles being among the most popular. Operational efficiency and food safety are key priorities for fish wholesalers and seafood suppliers, leading to advancements in temperature-controlled shipping and sustainable packaging. Subscription models and weekly or monthly fish deliveries cater to the diverse consumer preferences and busy lifestyles.
Seafood sourcing from local and sustainable sources is a growing trend, with many fish wholesalers focusing on ocean-friendly seafood and customizable boxes to meet the needs of various customer segments. Online fish ordering and home delivery services are also gaining traction, with data analytics playing a crucial role in price optimization and consumer targeting. The market's geographic reach is expanding, with food delivery services and retail fish markets offering a wide variety of fresh and frozen fish, fish fillets, and seafood meal kits. The value proposition of customizable boxes and healthy eating options further enhances the market's appeal. Supply chain management and cold chain logistics are essential for maintaining the quality and freshness of fish products, ensuring customer loyalty and competitive pricing.
Packaging innovations continue to shape the market, with sustainable and eco-friendly materials gaining popularity. Fish preparation and cooking methods are also evolving, with a focus on seafood snacks, seasonal fish, and fish recipes. Food allergies remain a concern, with many companies offering allergy-friendly options and clear labeling to cater to this segment of the market. The market's growth is expected to continue, driven by these trends and the increasing demand for fish and seafood products.
Market Dynamics
Our researchers analyzed the data with 2023 as the base year, along with the key drivers, trends, and challenges. A holistic analysis of drivers will help companies refine their marketing strategies to gain a competitive advantage.
What are the key market drivers leading to the rise in the adoption of Fish Box Industry?
- The significant rise in the consumption of fish and associated products serves as the primary catalyst for market growth.
- The global market for fish boxes has experienced significant growth due to the increasing consumption of fish and fish products worldwide. Fish is recognized as a valuable source of high-quality protein and essential nutrients, including zinc, iodine, and selenium. Major fish-consuming countries, such as Iceland, Japan, Portugal, and India, continue to drive market demand. Omega-3 rich fish, including mackerel, herring, sardine, fresh tuna, salmon, and trout, are particularly popular due to their numerous health benefits, such as improved brain function.
- To cater to diverse customer preferences, fish box providers offer competitive pricing, sustainable packaging, and customizable boxes. Packaging innovations, such as insulated materials and cold chain logistics, ensure the fish remains fresh during transportation and delivery. The focus on healthy eating and customer segmentation has further fueled market growth. Effective supply chain management and ocean-friendly seafood practices are essential to maintaining a strong value proposition in this industry.
What are the market trends shaping the Fish Box Industry?
- The trend in the packaging market is shifting towards lightweight options due to rising demand. This requirement for lighter packaging solutions is a significant market development.
- In the evolving seafood industry, the market has gained traction due to its alignment with diet trends and customer preferences. Product quality and food safety are paramount, making whole fish an attractive option. Operational efficiency is a significant factor in business success, and the market addresses this need through its fish delivery system. The company caters to customers with food allergies by offering customized subscription models, ensuring a seamless ordering process. The market distinguishes itself from competitors by partnering with reputable fish wholesalers and implementing rigorous seafood sourcing practices.
- Weekly fish delivery and order fulfillment ensure customers receive fresh, local seafood. The company's lightweight fish boxes, constructed primarily from EPS and fiber, offer operational advantages. These materials, which consist of over 80% air, are lightweight and convenient for handling during transportation. This commitment to lightweight packaging contributes to efficient transportation and increased demand for the market's services.
What challenges does the Fish Box Industry face during its growth?
- The escalating cost of polymers poses a significant challenge to the expansion and growth of the industry.
- The market faces rising challenges due to the increasing prices of key polymers used in its production. These polymers, including EPS, polypropylene, and PVC, are essential for maintaining the temperature-controlled environment necessary for shipping seasonal and fresh fish. According to industry analysis, the price of EPS is projected to rise by over 2.5 cents per pound, while polypropylene and PVC prices are anticipated to increase by more than eight cents and three cents per pound, respectively, during the forecast period. This price optimization in the plastic manufacturing industry directly impacts the market. Consumers continue to demand high-quality fish for food delivery services, restaurant supply, and online grocery shopping.
- To meet this demand, businesses rely on fish boxes to ensure the freshness and preservation of their products. However, the increased cost of raw materials may lead to higher prices for these services and potentially impact consumer preferences. Data analytics plays a crucial role in understanding and adapting to these market dynamics, enabling businesses to optimize their offerings and differentiate their services. Fish recipes and monthly fish delivery subscriptions remain popular among consumers, and home delivery continues to be a key trend in the food industry. Despite these challenges, the market is expected to remain a significant contributor to the food supply chain, offering innovative solutions for temperature-controlled shipping and preserving the freshness of fish products.
Exclusive Customer Landscape
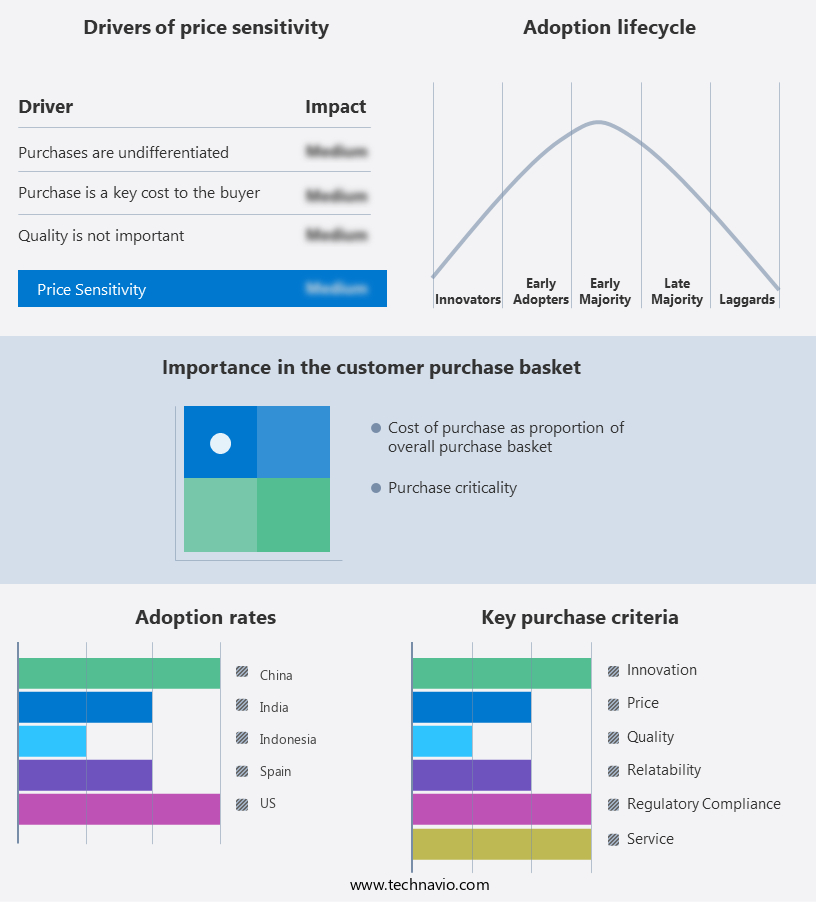
The fish box market forecasting report includes the adoption lifecycle of the market, covering from the innovator's stage to the laggard's stage. It focuses on adoption rates in different regions based on penetration. Furthermore, the fish box market report also includes key purchase criteria and drivers of price sensitivity to help companies evaluate and develop their market growth analysis strategies.
Customer Landscape
Key Companies & Market Insights
Companies are implementing various strategies, such as strategic alliances, fish box market forecast, partnerships, mergers and acquisitions, geographical expansion, and product/service launches, to enhance their presence in the industry.
Allwin Roto Plast - The company specializes in providing a range of fish transportation solutions, including insulated pallet containers with a capacity of 1000L, fish totes, and various insulated totes from Allwin.
The industry research and growth report includes detailed analyses of the competitive landscape of the market and information about key companies, including:
- Allwin Roto Plast
- BASF SE
- Carry Cool Enterprise
- Corex Plastics Pty Ltd.
- Craemer GmbH
- CRT Packaging (UK) Ltd.
- Eppor-Pack Sdn Bhd
- Fletcher European Containers Ltd.
- Industrial Associates
- Life Solutions
- Ocean Roto Moulding Sdn. Bhd.
- PPS Midlands Ltd.
- Prakash Packaging
- Sekisui Kasei Co., Ltd.
- Smurfit Kappa Group
- Snyder Industries Inc.
- SOLIDUS SOLUTIONS Holding B.V.
- STYRO Insulations Mat. Ind. LLC
- Styropack
- Tri-Core Plastics Containers Ltd.
Qualitative and quantitative analysis of companies has been conducted to help clients understand the wider business environment as well as the strengths and weaknesses of key industry players. Data is qualitatively analyzed to categorize companies as pure play, category-focused, industry-focused, and diversified; it is quantitatively analyzed to categorize companies as dominant, leading, strong, tentative, and weak.
Recent Development and News in Fish Box Market
- In February 2024, Bluewater, a leading player in the market, introduced an innovative insulated fish box with an integrated GPS tracking system, enhancing traceability and reducing fish loss during transportation (Bluewater Press Release, 2024).
- In June 2025, Thermo Fisher Scientific and Seaboard Triumph Foods entered into a strategic partnership to develop advanced fish boxes with improved insulation and temperature control, targeting the growing demand for sustainable and high-quality seafood (Thermo Fisher Scientific Press Release, 2025).
- In October 2025, the European Union approved new regulations mandating the use of fish boxes with advanced insulation and temperature control systems to ensure the safe transport of fish, increasing market demand for these products (European Commission Press Release, 2025).
- In December 2025, Polar Ice Box, a leading fish box manufacturer, announced a significant investment of USD20 million to expand its production capacity and enter the Asian market, targeting the increasing demand for seafood in the region (Polar Ice Box Press Release, 2025).
Research Analyst Overview
In the dynamic market, eco-friendly packaging and fish farming are at the forefront of trends. Reusable containers are increasingly popular, reducing ocean health's impact and promoting food waste reduction. Seafood recipes and healthy meal options appeal to customers seeking longer-term value, driving subscription renewal rates. Online reviews play a crucial role in brand awareness, with consumers prioritizing carbon footprint and ocean conservation. Fish conservation and seafood safety standards are essential, as is meal planning and seasonal seafood calendar awareness.
Social media engagement and customer service are key differentiators, while fisheries management and customer feedback ensure wild-caught seafood's sustainability. Food labeling transparency and seafood cooking tips foster trust and loyalty. Fish stock assessment and allergen information are vital for maintaining trust and adhering to regulatory requirements. Biodegradable packaging completes the circle, further reducing the industry's environmental impact.
Dive into Technavio's robust research methodology, blending expert interviews, extensive data synthesis, and validated models for unparalleled Fish Box Market insights. See full methodology.
|
Market Scope |
|
|
Report Coverage |
Details |
|
Page number |
163 |
|
Base year |
2023 |
|
Historic period |
2018-2022 |
|
Forecast period |
2024-2028 |
|
Growth momentum & CAGR |
Accelerate at a CAGR of 7.33% |
|
Market growth 2024-2028 |
USD 645.9 million |
|
Market structure |
Fragmented |
|
YoY growth 2023-2024(%) |
6.91 |
|
Key countries |
China, Spain, US, Indonesia, and India |
|
Competitive landscape |
Leading Companies, Market Positioning of Companies, Competitive Strategies, and Industry Risks |
What are the Key Data Covered in this Fish Box Market Research and Growth Report?
- CAGR of the Fish Box industry during the forecast period
- Detailed information on factors that will drive the growth and forecasting between 2024 and 2028
- Precise estimation of the size of the market and its contribution of the industry in focus to the parent market
- Accurate predictions about upcoming growth and trends and changes in consumer behaviour
- Growth of the market across APAC, Europe, North America, Middle East and Africa, and South America
- Thorough analysis of the market's competitive landscape and detailed information about companies
- Comprehensive analysis of factors that will challenge the fish box market growth of industry companies
We can help! Our analysts can customize this fish box market research report to meet your requirements.
 RIA -
RIA - 
