Fish Feed Market Size 2024-2028
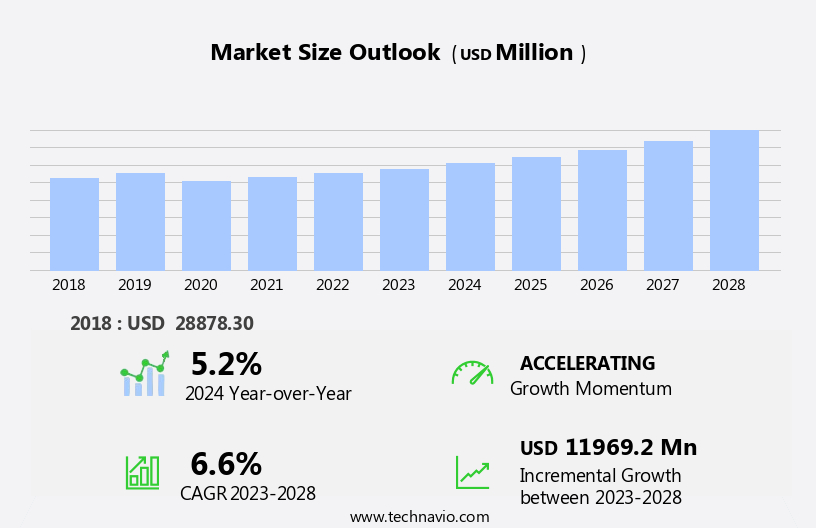
The fish feed market size is forecast to increase by USD 11.97 billion at a CAGR of 6.6% between 2023 and 2028.
- The market is experiencing significant growth, driven primarily by the increasing production of seafood through aquaculture. Aquaculture, which accounts for nearly half of the world's total seafood production, relies heavily on fish feed to sustain the growth of farmed fish. This trend is further fueled by government support and initiatives to promote sustainable aquaculture practices. However, the market is not without challenges. Volatility in prices and availability of raw materials, such as fishmeal and fish oil, pose significant risks to market growth. These inputs are essential in fish feed production and their fluctuations can significantly impact the cost structure of fish feed manufacturers.
- To mitigate these challenges, market players are exploring alternative sources of raw materials, such as plant-based proteins and algae, to reduce their reliance on traditional fishmeal and fish oil. Companies that successfully navigate these challenges and innovate in the area of sustainable and cost-effective fish feed production are poised to capitalize on the growing demand for seafood and capture market share in the market.
What will be the Size of the Fish Feed Market during the forecast period?
- The market in the United States is a dynamic and expanding sector of the aquaculture industry. With the increasing global demand for seafood, aquaculture has become a crucial source to meet the growing consumer needs. The market size for fish feed is substantial, driven by the expansion of aquaculture farms and the rising demand for high-quality, nutritious feed. Key factors fueling market growth include the need for improved fish health, palatability, and digestibility, as well as the adoption of aquaculture certification standards. Aquaculture farm management seeks to optimize feed efficiency, reduce environmental impact, and enhance sustainability initiatives. Innovations in fish feed technology, such as the use of plant-derived lipid sources and sustainable fish feed, are gaining traction.
- Fish feed trends include the focus on improving feed forms, ensuring traceability, and addressing the need for species-specific formulations. The market also faces challenges such as fluctuating raw material costs, fish feed transportation logistics, and the need for regulatory compliance. Household fish farming and the demand for household fish farming equipment are emerging trends, further expanding the market scope. Overall, the market is a vital component of the aquaculture industry, undergoing continuous innovation and growth to meet the evolving needs of fish farmers and consumers.
How is this Fish Feed Industry segmented?
The fish feed industry research report provides comprehensive data (region-wise segment analysis), with forecasts and estimates in "USD million" for the period 2024-2028, as well as historical data from 2018-2022 for the following segments.
- Product Type
- Pellets
- Extruded
- Powdered
- Liquid
- Type
- Carp
- Tilapia
- Salmon
- Catfish
- Others
- Geography
- APAC
- China
- India
- Indonesia
- Thailand
- Vietnam
- Europe
- France
- Norway
- North America
- US
- South America
- Brazil
- Chile
- Middle East and Africa
- APAC
By Product Type Insights
The pellets segment is estimated to witness significant growth during the forecast period.
Fish feed pellets, a compact and specially formulated feed, cater to the nutritional requirements of diverse fish species. Their usage is expanding in aquaculture, aquariums, and ornamental fishkeeping. Traditional practices, such as feeding raw fish to Japanese yellowtail amberjack producers, are being replaced with pellets to ensure consistency and meet consumer preferences. This trend is fostering innovation within the industry. For instance, Ridley Corporation is investigating sustainable fish feed ingredients, like insects, for pellets. These developments are poised to fuel the expansion of the pellets segment in The market. The rising population and income levels, coupled with increasing urbanization and environmental awareness, are driving the demand for sustainable and high-quality fish feed.
Aquafarmers are seeking alternatives to fish oil and fish meal, which are finite marine resources. As a result, there is a growing interest in plant-based fish feed, including those derived from soybean, corn, hemp seeds, and microalgae oil. Feed additives, such as prebiotics, enzymes, antioxidants, and amino acids, are essential components of fish feed formulations. They improve feed conversion rates, fish growth, and overall fish health. These ingredients contribute to the sustainability and efficiency of aquaculture operations. The market encompasses various fish species, including ray-finned fish, tilapia, trout, salmon, mackerel, ribbon fish, and carp. Each species requires specific nutrients and life stages demand different feed types, such as brooder feed, starter feed, grower feed, and finisher feed.
Innovation is a key driver in the market, with ongoing research focusing on optimizing feed quality, reducing carbon footprint, and improving fish nutrition. This includes the development of pellets, granules, and flakes, as well as plant-based and alternative protein sources. Trade policies and regulations play a significant role in the market, influencing the supply chain and market dynamics. Staying informed about these developments is crucial for businesses operating in the fish feed industry.
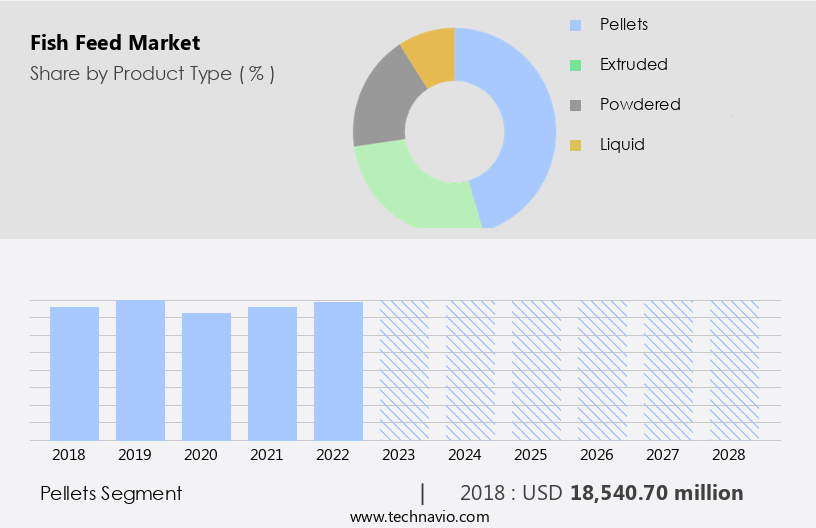
Get a glance at the market report of share of various segments Request Free Sample
The Pellets segment was valued at USD 18.54 billion in 2018 and showed a gradual increase during the forecast period.
Regional Analysis
APAC is estimated to contribute 56% to the growth of the global market during the forecast period.Technavio’s analysts have elaborately explained the regional trends and drivers that shape the market during the forecast period.
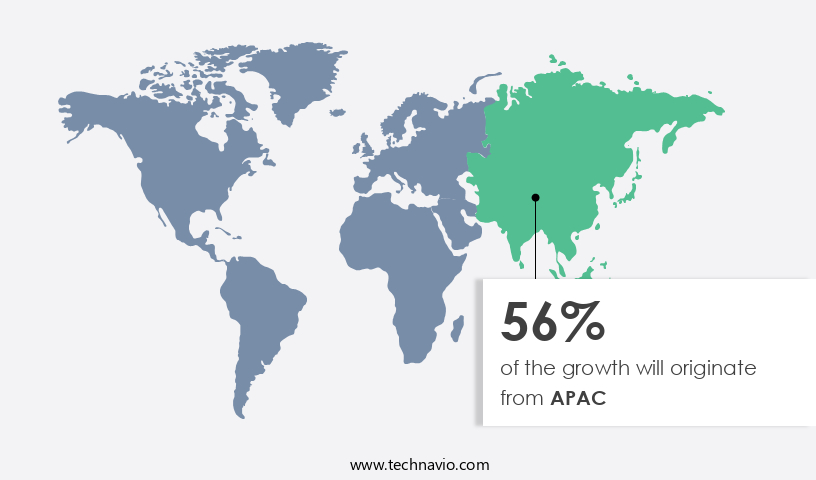
For more insights on the market size of various regions, Request Free Sample
The Asia Pacific region holds a dominant position in The market, accounting for approximately 91.4% of the world's aquaculture output in 2022, which totaled 144.29 million tons. The top seven aquaculture-producing countries, all located in Asia, collectively contributed 86.2% to the global aquaculture production. These countries include China, Indonesia, India, Vietnam, Bangladesh, the Philippines, and South Korea. The significant contribution of these nations highlights their crucial role in the industry. Fish farming plays a vital part in the market, with starter feed being essential for the growth of ray-finished fish like salmon, trout, tilapia, and others during their early life stages.
Fish feed manufacturers incorporate various ingredients such as soybean, corn, fish meal, and plant-derived protein to formulate commercial fish feed. Sustainable products like microalgae oil, prebiotics, and enzymes are increasingly being used to enhance fish nutrition and improve feed conversion rates. Environmental awareness and the need for sustainable aquaculture practices have led to the development of alternative protein sources like hemp seeds, algae, and plant-based feeds. The increasing urbanization and income levels have driven up the demand for processed seafood, further fueling the growth of the market. The supply chain for fish feed involves various stages, from the production of raw materials to distribution and sales.
Feed additives like vitamins, minerals, amino acids, antioxidants, and antibiotics play a crucial role in ensuring the quality and nutritional value of fish feed. The form of fish feed, such as pellets, sticks, granules, flakes, and powder, varies depending on the life stages of the fish species. The fish feed industry is continuously innovating to meet the evolving needs of the market and minimize the carbon footprint, focusing on sustainability and preserving aquatic ecosystems.
Market Dynamics
Our researchers analyzed the data with 2023 as the base year, along with the key drivers, trends, and challenges. A holistic analysis of drivers will help companies refine their marketing strategies to gain a competitive advantage.
What are the key market drivers leading to the rise in the adoption of Fish Feed Industry?
- Rising production of seafood through aquaculture is the key driver of the market.
- The market is experiencing notable growth due to the increasing production of seafood through aquaculture. Aquaculture, the process of cultivating fish and sea plants in controlled environments, has witnessed significant expansion over the last few decades. According to the United Nations Food and Agriculture Organization (FAO), aquaculture yielded over 94 million metric tons of seafood in 2022, more than double the production from 2006.
- Three decades ago, aquaculture contributed to only 15% of total seafood production, illustrating the sector's impressive growth and investment. This industry's expansion can be attributed to advancements in technology and the rising demand for sustainable and high-quality seafood sources.
What are the market trends shaping the Fish Feed Industry?
- Government support is the upcoming market trend.
- The market is experiencing notable growth due to government initiatives and financial support aimed at promoting aquaculture and enhancing seafood production and export. For instance, in July 2024, the Indian Ministry of Finance announced significant measures in the Union Budget to boost seafood exports. The Ministry proposed reducing the basic customs duty on specific broodstocks, polychaete worms, shrimp, and fish feed to 5%, with the objective of lowering production costs and encouraging higher output.
- This reduction is expected to strengthen India's position in the global seafood industry. Government interventions like these are crucial in driving the market's growth and sustainability.
What challenges does the Fish Feed Industry face during its growth?
- Volatility in prices and availability of raw materials is a key challenge affecting the industry growth.
- The market encounters substantial challenges due to the volatility in the prices and availability of essential raw materials, particularly millet and corn. Millets, renowned for their nutritional benefits, including proteins, minerals, and dietary fiber, serve as a sustainable and healthy alternative to traditional grains. Corn, a vital carbohydrate source, provides essential energy for fish, especially for species like carp and tilapia. However, the cost of millet has witnessed a considerable increase. In 2020, its price was approximately USD300 per metric ton, but by 2024, it had risen to around USD445 per metric ton.
- Corn, too, experiences price fluctuations, impacting the overall cost structure of fish feed production. These raw material price trends pose significant challenges for market participants, necessitating strategic sourcing and pricing strategies.
Exclusive Customer Landscape
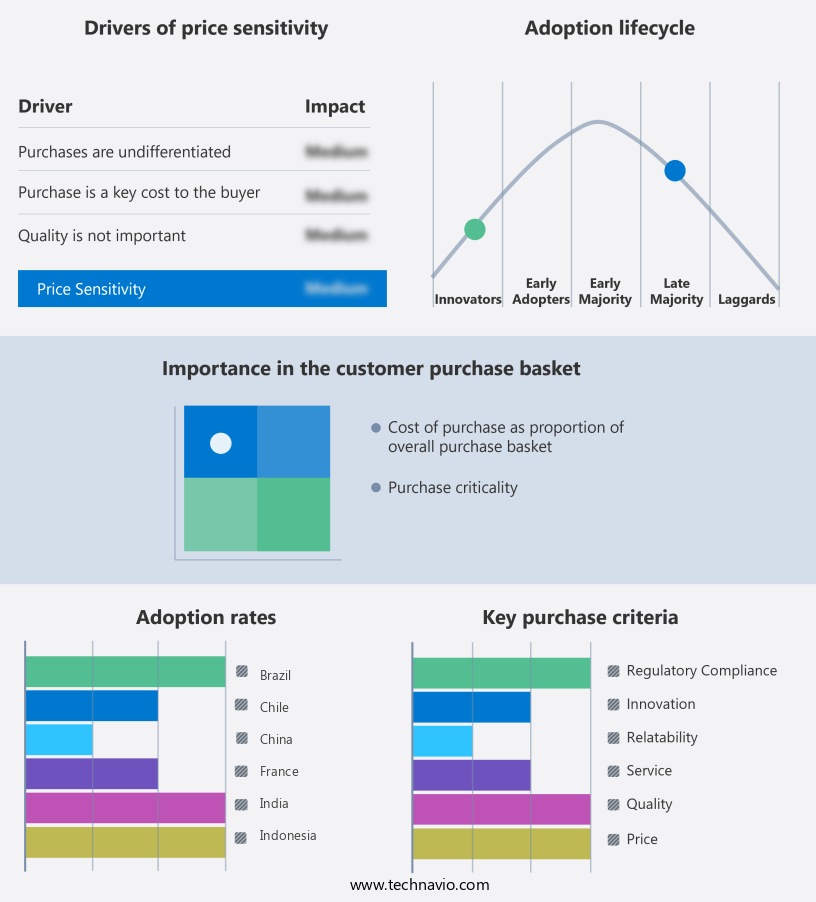
The fish feed market forecasting report includes the adoption lifecycle of the market, covering from the innovator’s stage to the laggard’s stage. It focuses on adoption rates in different regions based on penetration. Furthermore, the fish feed market report also includes key purchase criteria and drivers of price sensitivity to help companies evaluate and develop their market growth analysis strategies.
Customer Landscape
Key Companies & Market Insights
Companies are implementing various strategies, such as strategic alliances, fish feed market forecast, partnerships, mergers and acquisitions, geographical expansion, and product/service launches, to enhance their presence in the industry.
Aller Aqua AS - The company specializes in producing fish feed, engineered to enhance survival rates and foster rapid growth through scientifically formulated nutritional solutions. Our offerings prioritize sustainability and efficiency, ensuring optimal fish health and productivity for aquaculture operations worldwide.
The industry research and growth report includes detailed analyses of the competitive landscape of the market and information about key companies, including:
- Aller Aqua AS
- Alltech Inc.
- Bern Aqua NV
- BioMar Group
- Cargill Inc.
- Feed One Co. Ltd.
- Grand Fish Feed
- Growel Feeds Pvt. Ltd.
- HappyFeeds
- Heritage Nutrivet Ltd.
- Hosokawa Alpine Group
- Mowi ASA
- Skretting
- Sneha Group
- Specialised Aquatic Feeds
- Sreema Feeds
- Suhyup Feed
- The Scoular Co.
- World Feeds Ltd
- Zeigler Bros Inc.
Qualitative and quantitative analysis of companies has been conducted to help clients understand the wider business environment as well as the strengths and weaknesses of key industry players. Data is qualitatively analyzed to categorize companies as pure play, category-focused, industry-focused, and diversified; it is quantitatively analyzed to categorize companies as dominant, leading, strong, tentative, and weak.
Research Analyst Overview
The market is a significant sector within the broader aquaculture industry, supplying essential nutrients to various ray-finned fish species and other aquatic organisms. Fish farming has gained prominence as a sustainable and efficient alternative to wild fish populations, which have been facing declining numbers due to overfishing and environmental pressures. Fish feed manufacturers are continually innovating to meet the nutritional requirements of aquaculture operations. Starter feed, specifically formulated for the early life stages of fish, plays a crucial role in ensuring optimal growth and survival. Soybean meal, a primary source of protein, is a common ingredient in fish feed formulations.
However, the industry is exploring alternative protein sources such as microalgae oil and plant-derived proteins to reduce reliance on traditional marine feed resources and promote sustainable aquaculture. Prebiotics and probiotics are increasingly used as feed additives to enhance fish nutrition and improve feed conversion rates. These supplements support the growth of beneficial microorganisms in the fish gut, contributing to better digestion and overall health. Carbohydrates, amino acids, vitamins, minerals, and antioxidants are other essential components of fish feed formulations. The market dynamics of fish feed are influenced by various factors, including population growth, income levels, and urbanization. As disposable income increases, the demand for seafood and, consequently, fish feed rises.
Urbanization and trade policies also impact the market, as they influence the availability and cost of raw materials and the logistics of distribution. Fish feed manufacturers face challenges in maintaining feed quality and sustainability while minimizing their carbon footprint. Soyabean and corn are common feed ingredients, but their environmental impact and potential for price volatility necessitate exploration of alternative, more sustainable sources. Hemp seeds, algae, and other plant-based ingredients are gaining popularity as potential replacements for traditional fish meal and oil. Innovation is a key driver in the market, with manufacturers continually developing new products and technologies to address the evolving needs of aquafarmers.
Pellets, flakes, and granules are common fish feed formats, but alternative forms such as sticks and powders are also gaining traction. The use of antioxidants, enzymes, and other feed additives further enhances fish feed quality and performance. The market encompasses a diverse range of species, including salmon, trout, tilapia, mackerel, carp, and many others. Each species has unique nutritional requirements, necessitating customized feed formulations. The market also caters to different life stages, from brooder feed for fry to finisher feed for mature fish. In , the market is a dynamic and evolving sector that plays a crucial role in the sustainable production of seafood.
Fish feed manufacturers face challenges in meeting the nutritional needs of aquaculture operations while minimizing environmental impact and maintaining affordability. Innovation and the exploration of alternative protein sources and feed formats are key trends shaping the future of the fish feed industry.
|
Market Scope |
|
|
Report Coverage |
Details |
|
Page number |
213 |
|
Base year |
2023 |
|
Historic period |
2018-2022 |
|
Forecast period |
2024-2028 |
|
Growth momentum & CAGR |
Accelerate at a CAGR of 6.6% |
|
Market growth 2024-2028 |
USD 11969.2 million |
|
Market structure |
Fragmented |
|
YoY growth 2023-2024(%) |
5.2 |
|
Key countries |
China, US, India, Vietnam, Indonesia, Thailand, Norway, Chile, France, and Brazil |
|
Competitive landscape |
Leading Companies, Market Positioning of Companies, Competitive Strategies, and Industry Risks |
What are the Key Data Covered in this Fish Feed Market Research and Growth Report?
- CAGR of the Fish Feed industry during the forecast period
- Detailed information on factors that will drive the growth and forecasting between 2024 and 2028
- Precise estimation of the size of the market and its contribution of the industry in focus to the parent market
- Accurate predictions about upcoming growth and trends and changes in consumer behaviour
- Growth of the market across APAC, Europe, North America, South America, and Middle East and Africa
- Thorough analysis of the market’s competitive landscape and detailed information about companies
- Comprehensive analysis of factors that will challenge the fish feed market growth of industry companies
We can help! Our analysts can customize this fish feed market research report to meet your requirements.
 RIA -
RIA - 
