Dietary Fiber Market Analysis, Size, and Forecast 2024-2028: North America (US and Canada), Europe (France, Germany, Italy, and UK), Middle East and Africa (Egypt, KSA, Oman, and UAE), APAC (China, India, and Japan), South America (Argentina and Brazil), and Rest of World (ROW)

Dietary Fiber Market Analysis, Size, and Forecast 2024-2028:
North America (US and Canada), Europe (France, Germany, Italy, and UK), Middle East and Africa (Egypt, KSA, Oman, and UAE), APAC (China, India, and Japan), South America (Argentina and Brazil), and Rest of World (ROW)

Published: May 2024 169 Pages SKU: IRTNTR70739

Market Overview at a Glance

$3.97 B
Market Opportunity
10.87%
CAGR
9.53
YoY growth 2023-2024(%)

Dietary Fiber Market Size 2024-2028

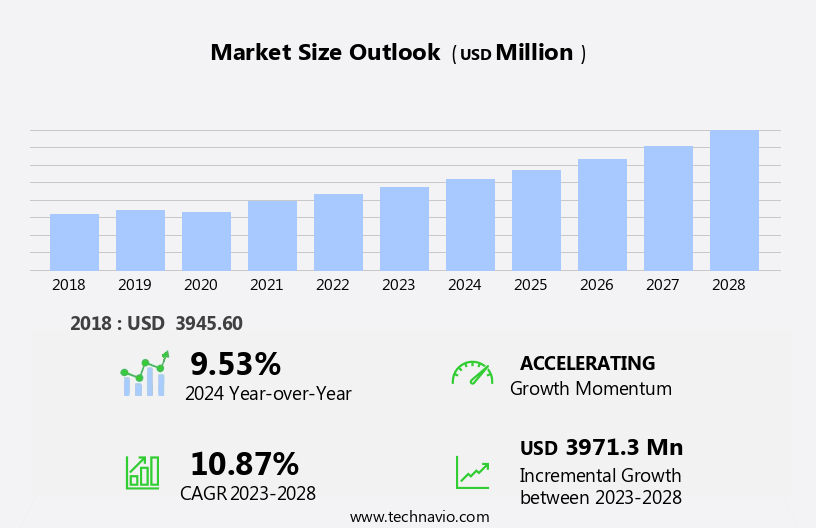
The dietary fiber market size is forecast to increase by USD 3.97 billion, at a CAGR of 10.87% between 2023 and 2028.

  • The market is driven by the growing awareness and recognition of the health benefits associated with high-fiber foods. Consumers are increasingly seeking out fiber-rich products to support digestive health, reduce cholesterol levels, and manage weight. This trend is further fueled by the rising demand from emerging economies, where the adoption of Western diets and increasing health consciousness are driving growth. Additionally, the demand for prebiotic ingredients, which contain prebiotic compounds that promote the growth of beneficial gut bacteria, is on the rise. However, the market faces challenges from stringent food regulations. Governments and regulatory bodies are implementing strict guidelines to ensure the safety and quality of fiber-containing foods, which can increase production costs and limit innovation. Companies must navigate these regulations while also addressing consumer demands for natural, clean-label products.
  • To capitalize on market opportunities and navigate challenges effectively, businesses should focus on developing innovative, fiber-rich products that meet regulatory requirements and consumer preferences. Additionally, partnerships and collaborations with regulatory bodies and industry associations can help companies stay informed and compliant with the latest regulations.

What will be the Size of the Dietary Fiber Market during the forecast period?

Dietary Fiber Market Size

Explore in-depth regional segment analysis with market size data - historical 2018-2022 and forecasts 2024-2028 - in the full report.  
Request Free Sample

The market continues to evolve, driven by ongoing research and development in fiber sources, extraction methods, and applications. Soluble fiber, with its high viscosity and ability to form a gel-like substance in the presence of water, is increasingly utilized as a weight management aid and for blood sugar control. Insoluble fiber, known for its water holding capacity and ability to increase stool bulk, is essential for digestive health and colonic health benefits. Pectin, a complex polysaccharide, is a functional fiber source gaining attention for its prebiotic effects and potential impact on gut microbiota. The extraction of pectin from various plant sources is a subject of ongoing research, as is the optimization of pectin's viscosity and solubility for various applications.

Hemicellulose, another complex carbohydrate, is a promising source of dietary fiber with a diverse range of types and properties. Its impact on glycemic index, viscosity measurement, and fiber digestion rate is under investigation, as is its potential synergy with probiotics. Fiber labeling standards continue to evolve, with a focus on transparency and accuracy in fiber content claims. Lignin composition and its role in fiber quality assessment are also areas of active research, as is the food matrix effect on fiber bioavailability. The ongoing exploration of fiber's role in various sectors, from food and beverage to pharmaceuticals and nutraceuticals, ensures a dynamic and evolving market landscape.

From fiber fortification and fiber supplementation to cholesterol reduction and colonic health benefits, the potential applications of dietary fiber are vast and continually unfolding.

How is this Dietary Fiber Industry segmented?

The dietary fiber industry research report provides comprehensive data (region-wise segment analysis), with forecasts and estimates in "USD million" for the period 2024-2028, as well as historical data from 2018-2022 for the following segments.

  • End-user
    • Food and beverage
    • Pharmaceuticals
    • Animal and pet feed
  • Type
    • Insoluble
    • Soluble
  • Raw Material
    • Fruits & Vegetables
    • Cereals & Grains
    • Nuts & Seeds
    • Legumes
  • Geography
    • North America
      • US
      • Canada
    • Europe
      • France
      • Germany
      • Italy
      • UK
    • Middle East and Africa
      • Egypt
      • KSA
      • Oman
      • UAE
    • APAC
      • China
      • India
      • Japan
    • South America
      • Argentina
      • Brazil
    • Rest of World (ROW)

By End-user Insights

The food and beverage segment is estimated to witness significant growth during the forecast period.

Dietary fibers, integral to maintaining optimal health, are increasingly utilized in food production due to their ability to prevent diabetes mellitus, bolster immune functions, and reduce the risk of cardiovascular diseases. The nutritional benefits, coupled with their technological properties, make dietary fibers a sought-after ingredient for food manufacturers. These fibers, predominantly derived from agricultural products and by-products, are essential for enhancing their functional properties. Resistant starch content, soluble and insoluble fiber types, hemicellulose, and cellulose are key components of dietary fibers. Soluble fibers, with high viscosity and water holding capacity, contribute to satiety response, blood sugar control, and cholesterol reduction.

Insoluble fibers, on the other hand, increase stool bulk and promote gut microbiota health. Functional fiber sources, such as pectin, inulin, and prebiotics, offer additional health benefits, including digestive health markers, probiotic synergy, and fiber degradation. Fiber labeling standards ensure transparency and accuracy in product information, while fiber extraction methods and fiber fortification maintain consistent product quality. The impact of dietary fiber on the glycemic index, gut microbiota, and food matrix are critical factors in food product development. Fermentation byproducts, lignin composition, and fiber digestion rate are also essential considerations for manufacturers. Incorporating dietary fibers into food products not only addresses nutritional needs but also offers opportunities for innovation in various food categories.

Dietary Fiber Market Size

Request Free Sample

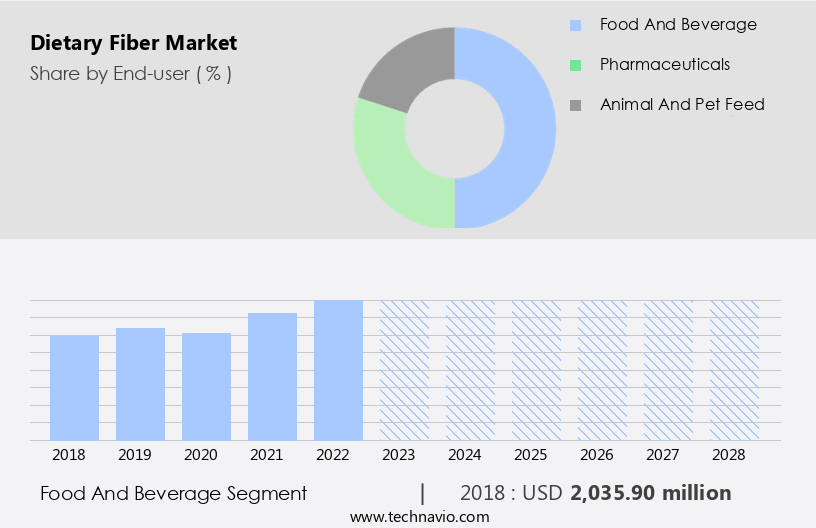
The Food and beverage segment was valued at USD 2.04 billion in 2018 and showed a gradual increase during the forecast period.

Regional Analysis

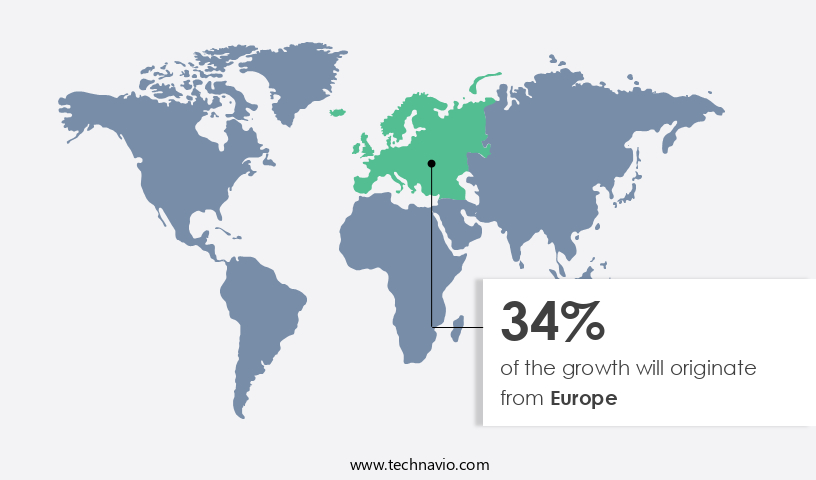
Europe is estimated to contribute 34% to the growth of the global market during the forecast period.Technavio's analysts have elaborately explained the regional trends and drivers that shape the market during the forecast period.

Dietary Fiber Market Share by Geography

 Request Free Sample

The North American market is experiencing significant growth due to increasing consumer awareness and preference for high-fiber foods. Fiber bioavailability and resistant starch content are key factors driving demand for functional fiber sources. Digestive health markers, such as viscosity measurement and satiety response, are essential considerations for consumers seeking weight management aids. Hemicellulose types and their glycemic index impact are also influential in fiber selection. Fiber supplementation, including soluble and insoluble fiber types, offers various health benefits, such as water holding capacity, gut microbiota impact, and colonic health benefits. Pectin extraction and fiber labeling standards are important for transparency and consumer trust.

Lignin composition and fiber quality assessment are crucial for cellulose properties and fermentation byproducts. Blood sugar control, cholesterol reduction, and probiotic synergy are significant health benefits associated with dietary fiber. Fiber fortification and prebiotic fiber effects contribute to fiber degradation and fiber intake levels. Inulin properties and dietary fiber analysis are essential for product development and market innovation. The US dominates the North American the market, with aggressive product launches catering to the growing demand for digestive health benefits. The younger population's trend towards raw, organic, and functional food products further fuels market growth. Overall, the market in North America is evolving to meet consumers' increasing demand for fiber-rich, health-conscious food options.

Market Dynamics

The Global dietary fiber market is experiencing significant expansion, driven by increasing consumer focus on gut health and weight management. This heightened awareness fuels demand for various forms, including soluble dietary fiber, insoluble dietary fiber, and particularly prebiotic fiber, which is gaining traction. The market for dietary fiber supplements and high-fiber snacks is booming, reflecting shifts in healthy food trends. As a crucial component in many products, functional food ingredients like inulin and resistant starch are seeing widespread adoption in new product development fiber. The dietary fiber industry trends highlight a strong correlation with the plant-based diet influence, further propelling dietary fiber market growth. The increasing consumer awareness dietary fiber's role in blood sugar control and its diverse nutraceutical applications are key drivers shaping the expanding dietary fiber market size.

Our researchers analyzed the data with 2023 as the base year, along with the key drivers, trends, and challenges. A holistic analysis of drivers will help companies refine their marketing strategies to gain a competitive advantage.

What are the key market drivers leading to the rise in the adoption of Dietary Fiber Industry?

  • The significant health benefits derived from consuming high-fiber foods serve as the primary market driver. 
  • The global health consciousness trend has gained significant momentum due to the increasing prevalence of obesity and related health issues, such as heart diseases. According to the World Health Organization (WHO), approximately 39 million children under the age of 5 were obese in 2021. In response, consumers worldwide are prioritizing their health and fitness by focusing on the nutritional value of their diets. One essential nutrient gaining prominence is dietary fiber. Dietary fiber, a non-digestible carbohydrate, plays a crucial role in maintaining digestive health and overall well-being. It is classified into two types: soluble and insoluble.
  • Soluble fiber, which is fermented in the large intestine, aids in weight management by increasing satiety and reducing calorie intake. Insoluble fiber, on the other hand, promotes regular bowel movements and adds bulk to the stool. Functional fiber sources, such as resistant starch and hemicellulose types, have gained popularity due to their added health benefits. Resistant starch, which is resistant to digestion in the small intestine, acts as a prebiotic and improves fiber bioavailability. Hemicellulose, a complex polysaccharide, is rich in fiber and has a low glycemic index impact, making it an ideal choice for individuals with diabetes.
  • Moreover, fiber supplementation is a viable solution for those who struggle to meet their daily fiber requirements through their diet alone. Viscosity measurement and digestive health markers are essential factors in evaluating the effectiveness of fiber supplements. As consumers become more health-conscious, the demand for fiber-rich foods and supplements is expected to surge, making it a promising market.

What are the market trends shaping the Dietary Fiber Industry?

  • Emerging economies are experiencing a surging demand that represents the latest market trend. This increasing need from developing countries is a significant factor shaping the business landscape.
  • The market is experiencing significant growth due to increasing consumer awareness and demand for healthier food options. Dietary fiber, which includes both soluble and insoluble types, plays a crucial role in maintaining digestive health and providing various health benefits. Soluble fiber, known for its water-holding capacity, contributes to a satiety response, helping consumers feel full for longer periods. Insoluble fiber types, on the other hand, contribute to the bulking effect and promote regular bowel movements. The impact of dietary fiber on gut microbiota is another key factor driving market growth. Pectin extraction is a common method used to obtain dietary fiber from fruits and vegetables.
  • Fiber labeling standards are essential to ensure accurate and clear communication of fiber content to consumers. Lignin composition is also a critical aspect of dietary fiber, as it affects the colonic health benefits. As consumers become more health-conscious, the demand for foods and beverages with high dietary fiber content continues to rise. This trend is particularly noticeable in emerging economies such as China, Brazil, India, and Russia, where the market for dietary fiber is in a growth stage. Dietary fiber companies are increasingly investing in these markets to cater to the rising demand for nutritional food products.
  • In summary, the market is experiencing growth due to increasing consumer awareness and demand for healthier food options. The health benefits associated with dietary fiber, including its impact on gut microbiota and colonic health, are driving market growth. Consumer interest in foods and beverages with high dietary fiber content is particularly strong in emerging economies, making them attractive markets for dietary fiber companies.

What challenges does the Dietary Fiber Industry face during its growth?

  • The stringent food regulations pose a significant challenge to the growth of the industry. Adhering to these regulations, which are essential for ensuring food safety and quality, requires substantial resources and compliance efforts from industry players. 
  • The market encounters challenges in adhering to the rigorous regulations set by authorities, hindering new entrants and product launches. In the US, for instance, foods labeled as high in fiber must contain a minimum of 5 grams (0.17 ounces) per serving and 8 grams (0.28 ounces) of whole grain. The US Food and Drug Administration (FDA) mandates that manufacturers of packaged food disclose nutritional information on product packaging. In Europe, under the Nutrition and Health Claims Regulation (NHCR), a food product can only be classified as high in fiber if it contains 6 grams of fiber per 100 grams of every serving.
  • Fiber extraction methods, such as mechanical and enzymatic processes, play a crucial role in fiber quality assessment. Prebiotic fiber effects, fiber degradation, and fermentation byproducts are significant factors influencing fiber's health benefits. Cellulose properties, including its crystalline structure and degree of polymerization, are essential considerations in fiber fortification. The assessment of fiber quality is essential to ensure the desired health benefits and to meet regulatory requirements.

Exclusive Customer Landscape

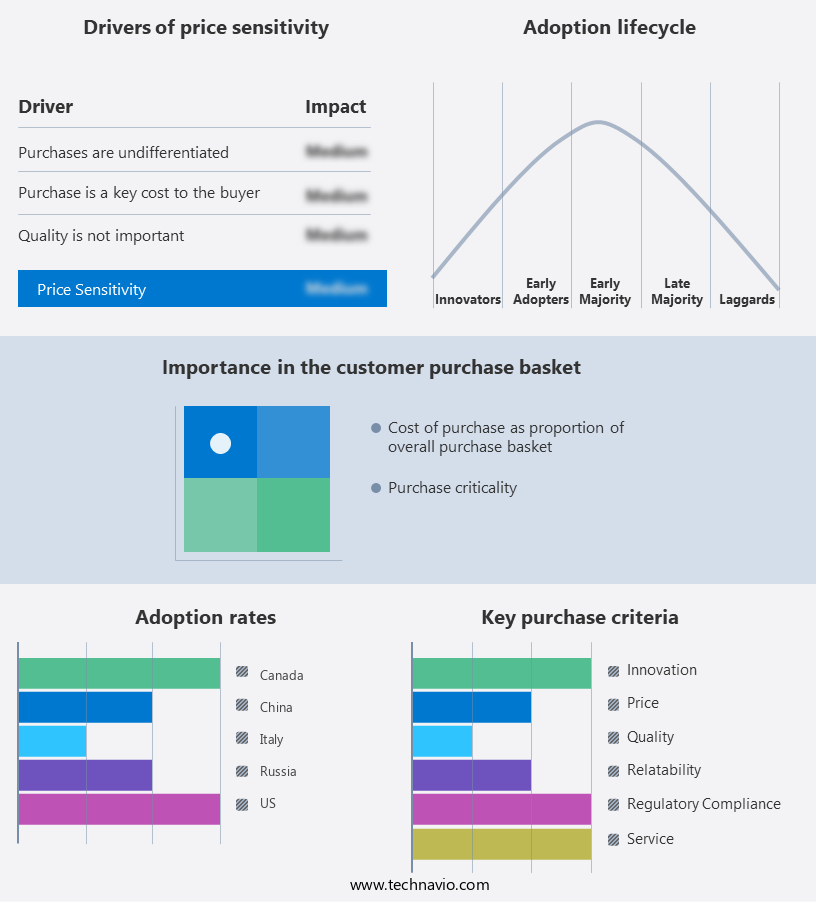
The dietary fiber market forecasting report includes the adoption lifecycle of the market, covering from the innovator's stage to the laggard's stage. It focuses on adoption rates in different regions based on penetration. Furthermore, the dietary fiber market report also includes key purchase criteria and drivers of price sensitivity to help companies evaluate and develop their market growth analysis strategies.

Dietary Fiber Market Share by Geography

 Customer Landscape

Key Companies & Market Insights

Companies are implementing various strategies, such as strategic alliances, dietary fiber market forecast, partnerships, mergers and acquisitions, geographical expansion, and product/service launches, to enhance their presence in the industry.

BEYOND BIOPHARMA CO. LTD. - This company specializes in providing dietary fiber solutions, including Cargill's soluble fiber offerings, to enhance food and beverage products' nutritional value and consumer health benefits.

The industry research and growth report includes detailed analyses of the competitive landscape of the market and information about key companies, including:

  • BEYOND BIOPHARMA CO. LTD.
  • Cargill Inc.
  • Cooperatie Koninklijke Cosun UA
  • COSUCRA
  • DuPont de Nemours Inc.
  • FrieslandCampina
  • FutureCeuticals
  • Herbafood Ingredients GmbH
  • Ingredion Inc.
  • Interfiber Ltd.
  • International Flavors and Fragrances Inc.
  • J RETTENMAIER and SOHNE GmbH and Co KG
  • Kerry Group Plc
  • Matsutani Chemical Industry Co. Ltd.
  • Meiji Holdings Co. Ltd.
  • NEXIRA
  • Roquette Freres SA
  • Sudzucker AG
  • Tate and Lyle PLC
  • Tereos Participations

Qualitative and quantitative analysis of companies has been conducted to help clients understand the wider business environment as well as the strengths and weaknesses of key industry players. Data is qualitatively analyzed to categorize companies as pure play, category-focused, industry-focused, and diversified; it is quantitatively analyzed to categorize companies as dominant, leading, strong, tentative, and weak.

Recent Development and News in Dietary Fiber Market

  • In January 2024, Danone Manifesto Ventures, a global investment organization focused on sustainable food startups, announced a strategic investment in Fiberstar, Inc., a leading producer of water-soluble dietary fibers. This collaboration aimed to expand Danone's portfolio of health-focused products (Danone Manifesto Ventures Press Release, 2024).
  • In March 2024, DuPont Nutrition & Biosciences, a global biotech company, launched a new dietary fiber ingredient, Danisco™ NOVELU® P50, which offered improved prebiotic properties and gut health benefits. This launch marked a significant technological advancement in the market (DuPont Nutrition & Biosciences Press Release, 2024).
  • In May 2024, Ingredion Incorporated, a leading global ingredient solutions provider, acquired Provenance Specialty Foods, a U.S.-based company specializing in plant-based and clean-label ingredients, including dietary fibers. This acquisition expanded Ingredion's offerings and capabilities in the market (Ingredion Incorporated Press Release, 2024).
  • In April 2025, the European Food Safety Authority (EFSA) approved the health claim for the dietary fiber, Sunfiber®, produced by Taiyo International, Inc. The approval allowed food manufacturers to make specific health claims related to the fiber's ability to improve bowel function (EFSA Journal, 2025).

Research Analyst Overview

  • The market is experiencing significant growth, driven by increasing consumer awareness of its health benefits. Fiber's role in cardiovascular health, metabolic syndrome management, and colon cancer risk reduction is well-established. Intestinal transit time and nutrient absorption are improved, leading to immune function boost and inflammation reduction. Food processing impact on fiber's sensory properties and shelf life stability is a key consideration in fiber ingredient selection. Prebiotic fiber types, such as inulin and oligofructose, promote probiotic growth and modulate the gut microbiome.
  • Fiber-rich foods like fruits, vegetables, and whole grains are essential, but fiber supplement formulations offer convenience and consistency. Age-related changes in fiber needs and fiber source identification are also important considerations. Fiber characterization and texture modification techniques enable the development of fiber ingredients with desirable properties for various applications, including obesity prevention and type 2 diabetes management.

Dive into Technavio's robust research methodology, blending expert interviews, extensive data synthesis, and validated models for unparalleled Dietary Fiber Market insights. See full methodology.

Market Scope

Report Coverage

Details

Page number

169

Base year

2023

Historic period

2018-2022

Forecast period

2024-2028

Growth momentum & CAGR

Accelerate at a CAGR of 10.87%

Market growth 2024-2028

USD 3971.3 million

Market structure

Fragmented

YoY growth 2023-2024(%)

9.53

Key countries

US, Canada, Germany, UK, Italy, France, China, India, Japan, Brazil, Egypt, UAE, Oman, Argentina, KSA, UAE, Brazil, and Rest of World (ROW)

Competitive landscape

Leading Companies, Market Positioning of Companies, Competitive Strategies, and Industry Risks

Request Free Sample

What are the Key Data Covered in this Dietary Fiber Market Research and Growth Report?

  • CAGR of the Dietary Fiber industry during the forecast period
  • Detailed information on factors that will drive the growth and forecasting between 2024 and 2028
  • Precise estimation of the size of the market and its contribution of the industry in focus to the parent market
  • Accurate predictions about upcoming growth and trends and changes in consumer behaviour
  • Growth of the market across North America, Europe, APAC, South America, and Middle East and Africa
  • Thorough analysis of the market's competitive landscape and detailed information about companies
  • Comprehensive analysis of factors that will challenge the dietary fiber market growth of industry companies

We can help! Our analysts can customize this dietary fiber market research report to meet your requirements.

Get in touch

1 Executive Summary

  • 1.1 Market overview
    • Executive Summary - Chart on Market Overview
    • Executive Summary - Data Table on Market Overview
    • Executive Summary - Chart on Global Market Characteristics
    • Executive Summary - Chart on Market by Geography
    • Executive Summary - Chart on Market Segmentation by End-user
    • Executive Summary - Chart on Market Segmentation by Type
    • Executive Summary - Chart on Incremental Growth
    • Executive Summary - Data Table on Incremental Growth
    • Executive Summary - Chart on Company Market Positioning

2 Market Landscape

  • 2.1 Market ecosystem
    • Parent Market
    • Data Table on - Parent Market
  • 2.2 Market characteristics
    • Market characteristics analysis
  • 2.3 Value chain analysis
    • Value Chain Analysis

3 Market Sizing

  • 3.1 Market definition
    • Offerings of companies included in the market definition
  • 3.2 Market segment analysis
    • Market segments
  • 3.3 Market size 2023
    • 3.4 Market outlook: Forecast for 2023-2028
      • Chart on Global - Market size and forecast 2023-2028 ($ million)
      • Data Table on Global - Market size and forecast 2023-2028 ($ million)
      • Chart on Global Market: Year-over-year growth 2023-2028 (%)
      • Data Table on Global Market: Year-over-year growth 2023-2028 (%)

    4 Historic Market Size

    • 4.1 Global Dietary Fiber Market 2018 - 2022
      • Historic Market Size - Data Table on Global Dietary Fiber Market 2018 - 2022 ($ million)
    • 4.2 End-user segment analysis 2018 - 2022
      • Historic Market Size - End-user Segment 2018 - 2022 ($ million)
    • 4.3 Type segment analysis 2018 - 2022
      • Historic Market Size - Type Segment 2018 - 2022 ($ million)
    • 4.4 Geography segment analysis 2018 - 2022
      • Historic Market Size - Geography Segment 2018 - 2022 ($ million)
    • 4.5 Country segment analysis 2018 - 2022
      • Historic Market Size - Country Segment 2018 - 2022 ($ million)

    5 Five Forces Analysis

    • 5.1 Five forces summary
      • Five forces analysis - Comparison between 2023 and 2028
    • 5.2 Bargaining power of buyers
      • Bargaining power of buyers - Impact of key factors 2023 and 2028
    • 5.3 Bargaining power of suppliers
      • Bargaining power of suppliers - Impact of key factors in 2023 and 2028
    • 5.4 Threat of new entrants
      • Threat of new entrants - Impact of key factors in 2023 and 2028
    • 5.5 Threat of substitutes
      • Threat of substitutes - Impact of key factors in 2023 and 2028
    • 5.6 Threat of rivalry
      • Threat of rivalry - Impact of key factors in 2023 and 2028
    • 5.7 Market condition
      • Chart on Market condition - Five forces 2023 and 2028

    6 Market Segmentation by End-user

    • 6.1 Market segments
      • Chart on End-user - Market share (2023-2028) (%)
      • Data Table on End-user - Market share (2023-2028) (%)
    • 6.2 Comparison by End-user
      • Chart on Comparison by End-user
      • Data Table on Comparison by End-user
    • 6.3 Food and beverage - Market size and forecast (2023-2028)
      • Chart on Food and beverage - Market size and forecast (2023-2028) ($ million)
      • Data Table on Food and beverage - Market size and forecast (2023-2028) ($ million)
      • Chart on Food and beverage - Year-over-year growth (2023-2028) (%)
      • Data Table on Food and beverage - Year-over-year growth (2023-2028) (%)
    • 6.4 Pharmaceuticals - Market size and forecast (2023-2028)
      • Chart on Pharmaceuticals - Market size and forecast (2023-2028) ($ million)
      • Data Table on Pharmaceuticals - Market size and forecast (2023-2028) ($ million)
      • Chart on Pharmaceuticals - Year-over-year growth (2023-2028) (%)
      • Data Table on Pharmaceuticals - Year-over-year growth (2023-2028) (%)
    • 6.5 Animal and pet feed - Market size and forecast (2023-2028)
      • Chart on Animal and pet feed - Market size and forecast (2023-2028) ($ million)
      • Data Table on Animal and pet feed - Market size and forecast (2023-2028) ($ million)
      • Chart on Animal and pet feed - Year-over-year growth (2023-2028) (%)
      • Data Table on Animal and pet feed - Year-over-year growth (2023-2028) (%)
    • 6.6 Market opportunity by End-user
      • Market opportunity by End-user ($ million)
      • Data Table on Market opportunity by End-user ($ million)

    7 Market Segmentation by Type

    • 7.1 Market segments
      • Chart on Type - Market share (2023-2028) (%)
      • Data Table on Type - Market share (2023-2028) (%)
    • 7.2 Comparison by Type
      • Chart on Comparison by Type
      • Data Table on Comparison by Type
    • 7.3 Insoluble - Market size and forecast (2023-2028)
      • Chart on Insoluble - Market size and forecast (2023-2028) ($ million)
      • Data Table on Insoluble - Market size and forecast (2023-2028) ($ million)
      • Chart on Insoluble - Year-over-year growth (2023-2028) (%)
      • Data Table on Insoluble - Year-over-year growth (2023-2028) (%)
    • 7.4 Soluble - Market size and forecast (2023-2028)
      • Chart on Soluble - Market size and forecast (2023-2028) ($ million)
      • Data Table on Soluble - Market size and forecast (2023-2028) ($ million)
      • Chart on Soluble - Year-over-year growth (2023-2028) (%)
      • Data Table on Soluble - Year-over-year growth (2023-2028) (%)
    • 7.5 Market opportunity by Type
      • Market opportunity by Type ($ million)
      • Data Table on Market opportunity by Type ($ million)

    8 Market Segmentation by Raw Material

    • 8.1 Market segments
      • Chart on Raw Material - Market share (2023-2028) (%)
      • Data Table on Raw Material - Market share (2023-2028) (%)
    • 8.2 Comparison by Raw Material
      • Chart on Comparison by Raw Material
      • Data Table on Comparison by Raw Material
    • 8.3 Fruits & Vegetables - Market size and forecast (2023-2028)
      • Chart on Fruits & Vegetables - Market size and forecast (2023-2028) ($ million)
      • Data Table on Fruits & Vegetables - Market size and forecast (2023-2028) ($ million)
      • Chart on Fruits & Vegetables - Year-over-year growth (2023-2028) (%)
      • Data Table on Fruits & Vegetables - Year-over-year growth (2023-2028) (%)
    • 8.4 Cereals & Grains - Market size and forecast (2023-2028)
      • Chart on Cereals & Grains - Market size and forecast (2023-2028) ($ million)
      • Data Table on Cereals & Grains - Market size and forecast (2023-2028) ($ million)
      • Chart on Cereals & Grains - Year-over-year growth (2023-2028) (%)
      • Data Table on Cereals & Grains - Year-over-year growth (2023-2028) (%)
    • 8.5 Nuts & Seeds - Market size and forecast (2023-2028)
      • Chart on Nuts & Seeds - Market size and forecast (2023-2028) ($ million)
      • Data Table on Nuts & Seeds - Market size and forecast (2023-2028) ($ million)
      • Chart on Nuts & Seeds - Year-over-year growth (2023-2028) (%)
      • Data Table on Nuts & Seeds - Year-over-year growth (2023-2028) (%)
    • 8.6 Legumes - Market size and forecast (2023-2028)
      • Chart on Legumes - Market size and forecast (2023-2028) ($ million)
      • Data Table on Legumes - Market size and forecast (2023-2028) ($ million)
      • Chart on Legumes - Year-over-year growth (2023-2028) (%)
      • Data Table on Legumes - Year-over-year growth (2023-2028) (%)
    • 8.7 Market opportunity by Raw Material
      • Market opportunity by Raw Material ($ million)
      • Data Table on Market opportunity by Raw Material ($ million)

    9 Customer Landscape

    • 9.1 Customer landscape overview
      • Analysis of price sensitivity, lifecycle, customer purchase basket, adoption rates, and purchase criteria

    10 Geographic Landscape

    • 10.1 Geographic segmentation
      • Chart on Market share by geography 2023-2028 (%)
      • Data Table on Market share by geography 2023-2028 (%)
    • 10.2 Geographic comparison
      • Chart on Geographic comparison
      • Data Table on Geographic comparison
    • 10.3 North America - Market size and forecast 2023-2028
      • Chart on North America - Market size and forecast 2023-2028 ($ million)
      • Data Table on North America - Market size and forecast 2023-2028 ($ million)
      • Chart on North America - Year-over-year growth 2023-2028 (%)
      • Data Table on North America - Year-over-year growth 2023-2028 (%)
    • 10.4 Europe - Market size and forecast 2023-2028
      • Chart on Europe - Market size and forecast 2023-2028 ($ million)
      • Data Table on Europe - Market size and forecast 2023-2028 ($ million)
      • Chart on Europe - Year-over-year growth 2023-2028 (%)
      • Data Table on Europe - Year-over-year growth 2023-2028 (%)
    • 10.5 APAC - Market size and forecast 2023-2028
      • Chart on APAC - Market size and forecast 2023-2028 ($ million)
      • Data Table on APAC - Market size and forecast 2023-2028 ($ million)
      • Chart on APAC - Year-over-year growth 2023-2028 (%)
      • Data Table on APAC - Year-over-year growth 2023-2028 (%)
    • 10.6 South America - Market size and forecast 2023-2028
      • Chart on South America - Market size and forecast 2023-2028 ($ million)
      • Data Table on South America - Market size and forecast 2023-2028 ($ million)
      • Chart on South America - Year-over-year growth 2023-2028 (%)
      • Data Table on South America - Year-over-year growth 2023-2028 (%)
    • 10.7 Middle East and Africa - Market size and forecast 2023-2028
      • Chart on Middle East and Africa - Market size and forecast 2023-2028 ($ million)
      • Data Table on Middle East and Africa - Market size and forecast 2023-2028 ($ million)
      • Chart on Middle East and Africa - Year-over-year growth 2023-2028 (%)
      • Data Table on Middle East and Africa - Year-over-year growth 2023-2028 (%)
    • 10.8 US - Market size and forecast 2023-2028
      • Chart on US - Market size and forecast 2023-2028 ($ million)
      • Data Table on US - Market size and forecast 2023-2028 ($ million)
      • Chart on US - Year-over-year growth 2023-2028 (%)
      • Data Table on US - Year-over-year growth 2023-2028 (%)
    • 10.9 China - Market size and forecast 2023-2028
      • Chart on China - Market size and forecast 2023-2028 ($ million)
      • Data Table on China - Market size and forecast 2023-2028 ($ million)
      • Chart on China - Year-over-year growth 2023-2028 (%)
      • Data Table on China - Year-over-year growth 2023-2028 (%)
    • 10.10 Italy - Market size and forecast 2023-2028
      • Chart on Italy - Market size and forecast 2023-2028 ($ million)
      • Data Table on Italy - Market size and forecast 2023-2028 ($ million)
      • Chart on Italy - Year-over-year growth 2023-2028 (%)
      • Data Table on Italy - Year-over-year growth 2023-2028 (%)
    • 10.11 Russia - Market size and forecast 2023-2028
      • Chart on Russia - Market size and forecast 2023-2028 ($ million)
      • Data Table on Russia - Market size and forecast 2023-2028 ($ million)
      • Chart on Russia - Year-over-year growth 2023-2028 (%)
      • Data Table on Russia - Year-over-year growth 2023-2028 (%)
    • 10.12 Canada - Market size and forecast 2023-2028
      • Chart on Canada - Market size and forecast 2023-2028 ($ million)
      • Data Table on Canada - Market size and forecast 2023-2028 ($ million)
      • Chart on Canada - Year-over-year growth 2023-2028 (%)
      • Data Table on Canada - Year-over-year growth 2023-2028 (%)
    • 10.13 Market opportunity by geography
      • Market opportunity by geography ($ million)
      • Data Tables on Market opportunity by geography ($ million)
    • 10.14 Germany - Market size and forecast (2023-2028)
      • Chart on Germany - Market size and forecast (2023-2028) ($ million)
      • Data Table on Germany - Market size and forecast (2023-2028) ($ million)
      • Chart on Germany - Year-over-year growth (2023-2028) (%)
      • Data Table on Germany - Year-over-year growth (2023-2028) (%)
    • 10.15 UK - Market size and forecast (2023-2028)
      • Chart on UK - Market size and forecast (2023-2028) ($ million)
      • Data Table on UK - Market size and forecast (2023-2028) ($ million)
      • Chart on UK - Year-over-year growth (2023-2028) (%)
      • Data Table on UK - Year-over-year growth (2023-2028) (%)
    • 10.16 France - Market size and forecast (2023-2028)
      • Chart on France - Market size and forecast (2023-2028) ($ million)
      • Data Table on France - Market size and forecast (2023-2028) ($ million)
      • Chart on France - Year-over-year growth (2023-2028) (%)
      • Data Table on France - Year-over-year growth (2023-2028) (%)
    • 10.17 India - Market size and forecast (2023-2028)
      • Chart on India - Market size and forecast (2023-2028) ($ million)
      • Data Table on India - Market size and forecast (2023-2028) ($ million)
      • Chart on India - Year-over-year growth (2023-2028) (%)
      • Data Table on India - Year-over-year growth (2023-2028) (%)
    • 10.18 Japan - Market size and forecast (2023-2028)
      • Chart on Japan - Market size and forecast (2023-2028) ($ million)
      • Data Table on Japan - Market size and forecast (2023-2028) ($ million)
      • Chart on Japan - Year-over-year growth (2023-2028) (%)
      • Data Table on Japan - Year-over-year growth (2023-2028) (%)
    • 10.19 Brazil - Market size and forecast (2023-2028)
      • Chart on Brazil - Market size and forecast (2023-2028) ($ million)
      • Data Table on Brazil - Market size and forecast (2023-2028) ($ million)
      • Chart on Brazil - Year-over-year growth (2023-2028) (%)
      • Data Table on Brazil - Year-over-year growth (2023-2028) (%)
    • 10.20 Egypt - Market size and forecast (2023-2028)
      • Chart on Egypt - Market size and forecast (2023-2028) ($ million)
      • Data Table on Egypt - Market size and forecast (2023-2028) ($ million)
      • Chart on Egypt - Year-over-year growth (2023-2028) (%)
      • Data Table on Egypt - Year-over-year growth (2023-2028) (%)
    • 10.21 UAE - Market size and forecast (2023-2028)
      • Chart on UAE - Market size and forecast (2023-2028) ($ million)
      • Data Table on UAE - Market size and forecast (2023-2028) ($ million)
      • Chart on UAE - Year-over-year growth (2023-2028) (%)
      • Data Table on UAE - Year-over-year growth (2023-2028) (%)
    • 10.22 Oman - Market size and forecast (2023-2028)
      • Chart on Oman - Market size and forecast (2023-2028) ($ million)
      • Data Table on Oman - Market size and forecast (2023-2028) ($ million)
      • Chart on Oman - Year-over-year growth (2023-2028) (%)
      • Data Table on Oman - Year-over-year growth (2023-2028) (%)
    • 10.23 Argentina - Market size and forecast (2023-2028)
      • Chart on Argentina - Market size and forecast (2023-2028) ($ million)
      • Data Table on Argentina - Market size and forecast (2023-2028) ($ million)
      • Chart on Argentina - Year-over-year growth (2023-2028) (%)
      • Data Table on Argentina - Year-over-year growth (2023-2028) (%)
    • 10.24 KSA - Market size and forecast (2023-2028)
      • Chart on KSA - Market size and forecast (2023-2028) ($ million)
      • Data Table on KSA - Market size and forecast (2023-2028) ($ million)
      • Chart on KSA - Year-over-year growth (2023-2028) (%)
      • Data Table on KSA - Year-over-year growth (2023-2028) (%)
    • 10.25 Rest of World (ROW) - Market size and forecast (2023-2028)
      • Chart on Rest of World (ROW) - Market size and forecast (2023-2028) ($ million)
      • Data Table on Rest of World (ROW) - Market size and forecast (2023-2028) ($ million)
      • Chart on Rest of World (ROW) - Year-over-year growth (2023-2028) (%)
      • Data Table on Rest of World (ROW) - Year-over-year growth (2023-2028) (%)

    11 Drivers, Challenges, and Opportunity/Restraints

    • 11.1 Market drivers
      • 11.2 Market challenges
        • 11.3 Impact of drivers and challenges
          • Impact of drivers and challenges in 2023 and 2028
        • 11.4 Market opportunities/restraints

          12 Competitive Landscape

          • 12.1 Overview
            • 12.2 Competitive Landscape
              • Overview on criticality of inputs and factors of differentiation
            • 12.3 Landscape disruption
              • Overview on factors of disruption
            • 12.4 Industry risks
              • Impact of key risks on business

            13 Competitive Analysis

            • 13.1 Companies profiled
              • Companies covered
            • 13.2 Market positioning of companies
              • Matrix on companies position and classification
            • 13.3 Cargill Inc.
              • Cargill Inc. - Overview
              • Cargill Inc. - Product / Service
              • Cargill Inc. - Key news
              • Cargill Inc. - Key offerings
            • 13.4 Cooperatie Koninklijke Cosun UA
              • Cooperatie Koninklijke Cosun UA - Overview
              • Cooperatie Koninklijke Cosun UA - Product / Service
              • Cooperatie Koninklijke Cosun UA - Key offerings
            • 13.5 COSUCRA
              • COSUCRA - Overview
              • COSUCRA - Product / Service
              • COSUCRA - Key offerings
            • 13.6 FrieslandCampina
              • FrieslandCampina - Overview
              • FrieslandCampina - Business segments
              • FrieslandCampina - Key offerings
              • FrieslandCampina - Segment focus
            • 13.7 Ingredion Inc.
              • Ingredion Inc. - Overview
              • Ingredion Inc. - Business segments
              • Ingredion Inc. - Key news
              • Ingredion Inc. - Key offerings
              • Ingredion Inc. - Segment focus
            • 13.8 Interfiber Ltd.
              • Interfiber Ltd. - Overview
              • Interfiber Ltd. - Product / Service
              • Interfiber Ltd. - Key offerings
            • 13.9 International Flavors and Fragrances Inc.
              • International Flavors and Fragrances Inc. - Overview
              • International Flavors and Fragrances Inc. - Business segments
              • International Flavors and Fragrances Inc. - Key news
              • International Flavors and Fragrances Inc. - Key offerings
              • International Flavors and Fragrances Inc. - Segment focus
            • 13.10 J RETTENMAIER and SOHNE GmbH and Co KG
              • J RETTENMAIER and SOHNE GmbH and Co KG - Overview
              • J RETTENMAIER and SOHNE GmbH and Co KG - Product / Service
              • J RETTENMAIER and SOHNE GmbH and Co KG - Key offerings
            • 13.11 Kerry Group Plc
              • Kerry Group Plc - Overview
              • Kerry Group Plc - Business segments
              • Kerry Group Plc - Key news
              • Kerry Group Plc - Key offerings
              • Kerry Group Plc - Segment focus
            • 13.12 Matsutani Chemical Industry Co. Ltd.
              • Matsutani Chemical Industry Co. Ltd. - Overview
              • Matsutani Chemical Industry Co. Ltd. - Product / Service
              • Matsutani Chemical Industry Co. Ltd. - Key offerings
            • 13.13 Meiji Holdings Co. Ltd.
              • Meiji Holdings Co. Ltd. - Overview
              • Meiji Holdings Co. Ltd. - Business segments
              • Meiji Holdings Co. Ltd. - Key news
              • Meiji Holdings Co. Ltd. - Key offerings
              • Meiji Holdings Co. Ltd. - Segment focus
            • 13.14 Roquette Freres SA
              • Roquette Freres SA - Overview
              • Roquette Freres SA - Product / Service
              • Roquette Freres SA - Key offerings
            • 13.15 Sudzucker AG
              • Sudzucker AG - Overview
              • Sudzucker AG - Business segments
              • Sudzucker AG - Key news
              • Sudzucker AG - Key offerings
              • Sudzucker AG - Segment focus
            • 13.16 Tate and Lyle PLC
              • Tate and Lyle PLC - Overview
              • Tate and Lyle PLC - Business segments
              • Tate and Lyle PLC - Key news
              • Tate and Lyle PLC - Key offerings
              • Tate and Lyle PLC - Segment focus
            • 13.17 Tereos Participations
              • Tereos Participations - Overview
              • Tereos Participations - Product / Service
              • Tereos Participations - Key offerings

            14 Appendix

            • 14.1 Scope of the report
              • 14.2 Inclusions and exclusions checklist
                • Inclusions checklist
                • Exclusions checklist
              • 14.3 Currency conversion rates for US$
                • Currency conversion rates for US$
              • 14.4 Research methodology
                • Research methodology
              • 14.5 Data procurement
                • Information sources
              • 14.6 Data validation
                • Data validation
              • 14.7 Validation techniques employed for market sizing
                • Validation techniques employed for market sizing
              • 14.8 Data synthesis
                • Data synthesis
              • 14.9 360 degree market analysis
                • 360 degree market analysis
              • 14.10 List of abbreviations
                • List of abbreviations

              Research Methodology

              Technavio presents a detailed picture of the market by way of study, synthesis, and summation of data from multiple sources. The analysts have presented the various facets of the market with a particular focus on identifying the key industry influencers. The data thus presented is comprehensive, reliable, and the result of extensive research, both primary and secondary.

              INFORMATION SOURCES

              Primary sources

              • Manufacturers and suppliers
              • Channel partners
              • Industry experts
              • Strategic decision makers

              Secondary sources

              • Industry journals and periodicals
              • Government data
              • Financial reports of key industry players
              • Historical data
              • Press releases

              DATA ANALYSIS

              Data Synthesis

              • Collation of data
              • Estimation of key figures
              • Analysis of derived insights

              Data Validation

              • Triangulation with data models
              • Reference against proprietary databases
              • Corroboration with industry experts

              REPORT WRITING

              Qualitative

              • Market drivers
              • Market challenges
              • Market trends
              • Five forces analysis

              Quantitative

              • Market size and forecast
              • Market segmentation
              • Geographical insights
              • Competitive landscape

              Interested in this report?

              Get your sample now to see our research methodology and insights!

              Download Now

              Frequently Asked Questions

              Dietary Fiber market growth will increase by $ 3971.3 mn during 2024-2028 .

              The Dietary Fiber market is expected to grow at a CAGR of 10.87% during 2024-2028 .

              Dietary Fiber market is segmented by End-user( Food and beverage, Pharmaceuticals, Animal and pet feed) Type( Insoluble, Soluble)

              BEYOND BIOPHARMA CO. LTD., Cargill Inc., Cooperatie Koninklijke Cosun UA, COSUCRA, DuPont de Nemours Inc., FrieslandCampina, FutureCeuticals, Herbafood Ingredients GmbH, Ingredion Inc., Interfiber Ltd., International Flavors and Fragrances Inc., J RETTENMAIER and SOHNE GmbH and Co KG, Kerry Group Plc, Matsutani Chemical Industry Co. Ltd., Meiji Holdings Co. Ltd., NEXIRA, Roquette Freres SA, Sudzucker AG, Tate and Lyle PLC, Tereos Participations are a few of the key vendors in the Dietary Fiber market.

              Europe will register the highest growth rate of 34% among the other regions. Therefore, the Dietary Fiber market in Europe is expected to garner significant business opportunities for the vendors during the forecast period.

              US, Canada, Germany, UK, Italy, France, China, India, Japan, Brazil, Egypt, UAE, Oman, Argentina, KSA, UAE, Brazil, Rest of World (ROW)

              • Health benefits of high-fiber foodsUrbanization has prompted extensive changes in the way of life and the dietary habits of people across the world. Obesity is becoming a major concern globally. For instance is the driving factor this market.
              • according to the World health organization (WHO) is the driving factor this market.
              • nearly 39 million children under the age of 5 were obese in 2021. Also is the driving factor this market.
              • heart diseases are one of the most commonly prevalent diseases. To reduce the rising prevalence of such diseases is the driving factor this market.
              • people have started adopting healthy lifestyles. In line with this is the driving factor this market.
              • consumers across the world are becoming more conscious about their health and fitness and paying more attention to the nutritional content of the foods that they consume. The health-conscious population base demands foods that have an optimal combination of essential nutrients. As such is the driving factor this market.
              • the demand for high-fiber food is increasing.High-fiber foods offer several nutritional benefits. The USDA (US Department of Agriculture) recommends that high-fiber grains be incorporated in regular meals is the driving factor this market.
              • half of which should be high-fiber grains. Whole grains are rich in nutrients such as vitamins is the driving factor this market.
              • minerals is the driving factor this market.
              • and Omega-3 fatty acids. Owing to their high fiber content is the driving factor this market.
              • they are helpful in maintaining the levels of cholesterol in the blood and keeping the heart healthy. High-fiber foods also have many health benefits is the driving factor this market.
              • as they help the liver to function properly and remove toxins and sugar from the body. The intake of high-fiber foods slows down the digestion process is the driving factor this market.
              • which ensures that all the nutrients are absorbed and released into the bloodstream evenly. High-fiber foods help in controlling hunger is the driving factor this market.
              • as they enhance the feeling of fullness (satiety). Thus is the driving factor this market.
              • the demand for fiber supplements is increasing is the driving factor this market.
              • which is the driving factor this market.
              • in turn is the driving factor this market.
              • will drive the growth of the global dietary fiber market during the forecast period. is the driving factor this market.

              The Dietary Fiber market vendors should focus on grabbing business opportunities from the Food and beverage segment as it accounted for the largest market share in the base year.