Flammable Storage Cabinets Market Size 2024-2028
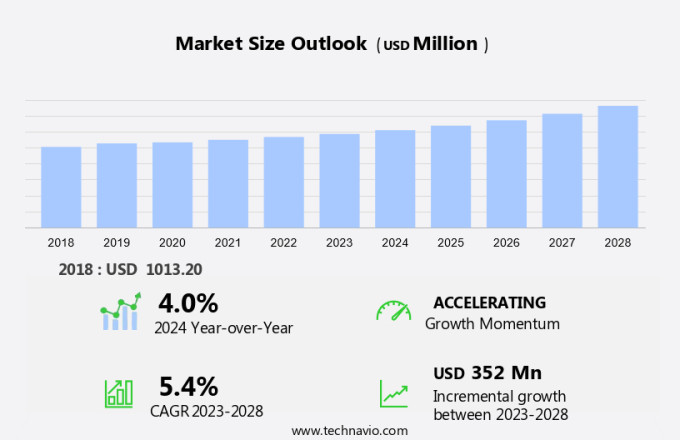
The flammable storage cabinets market size is forecast to increase by USD 352 million at a CAGR of 5.4% between 2023 and 2028.
- In the petrochemical industry, ensuring safety in the storage of flammable substances is of paramount importance. The market for flammable storage cabinets is witnessing significant growth due to several factors. Firstly, the increasing number of workplace safety regulations mandates the use of specialized storage solutions to mitigate fire risks. With the rise of research and development in these sectors, there is a growing need for safe storage solutions, including those made from sheet metal, to mitigate fire risks in sterile workspaces and factory laboratories.
- Additionally, the demand for sterile workspaces in medical supplies and factory laboratories necessitates the use of such cabinets to prevent contamination from infectious agents or active pharmaceutical ingredients. Furthermore, ongoing research and development efforts in the field of fire safety are leading to the introduction of advanced features in these cabinets, such as automatic fire suppression systems and improved insulation materials. Overall, the market for flammable storage cabinets is poised for steady growth, driven by the need for safety, regulatory compliance, and technological innovation.
What will be the Size of the Market During the Forecast Period?
- The market for flammable storage cabinets plays a crucial role in the chemical industry, ensuring the safe and compliant storage of flammable materials. Proper storage is essential for maintaining industrial safety and adhering to regulatory requirements. Flammable storage cabinets are designed to protect against fire hazards, making them an integral part of safety engineering in laboratories and industrial settings. These cabinets are engineered to maintain specific temperatures and humidity levels, which is vital for the stability and safety of stored chemicals. Compliance with regulations is a significant factor driving the demand for flammable storage cabinets.
- Additionally, regulatory bodies such as the National Fire Protection Association (NFPA) and the Occupational Safety and Health Administration (OSHA) have established strict guidelines for chemical storage. Regular compliance audits and inspections are necessary to maintain safety protocols and prevent accidents. Safety culture is a priority in the chemical industry, and proper training on the use and maintenance of flammable storage cabinets is essential. Safety procedures, including hazard identification, emergency response, and spill containment, are critical components of a comprehensive safety management system. Designing and implementing sustainable practices in the chemical industry is another trend influencing the market for flammable storage cabinets.
- Furthermore, these practices include the use of energy-efficient cabinets, recycling programs for old cabinets, and the implementation of ergonomic designs to improve worker safety and productivity. Fire safety equipment, such as fire suppression systems and fire extinguishers, are often integrated into flammable storage cabinets to minimize the risk of fire and ensure a quick response in case of an emergency. Industry standards for flammable storage cabinets are continually evolving, with a focus on improving safety, reducing environmental impact, and increasing efficiency. Regular safety audits and continuous improvement efforts are necessary to stay current with these standards and maintain a competitive edge in the market.
- In conclusion, personal protective equipment (PPE) is another critical component of safety in the chemical industry. Properly storing flammable materials in designated cabinets reduces the need for workers to handle these materials directly, minimizing the risk of exposure and potential accidents. In conclusion, the market for flammable storage cabinets is a vital segment in the chemical industry, with a focus on safety, compliance, and sustainability. Proper design, maintenance, and training are essential to ensure the safe and efficient storage of flammable materials and minimize the risk of accidents.
How is this market segmented and which is the largest segment?
The market research report provides comprehensive data (region-wise segment analysis), with forecasts and estimates in "USD million" for the period 2024-2028, as well as historical data from 2018-2022 for the following segments.
- Capacity
- Small capacity
- Medium capacity
- Large capacity
- End-user
- Chemical industry
- Pharmaceuticals
- Automotive and paint shops
- Laboratories
- Others
- Geography
- North America
- Canada
- US
- Europe
- Germany
- UK
- France
- Italy
- APAC
- China
- India
- Japan
- South Korea
- South America
- Middle East and Africa
- North America
By Capacity Insights
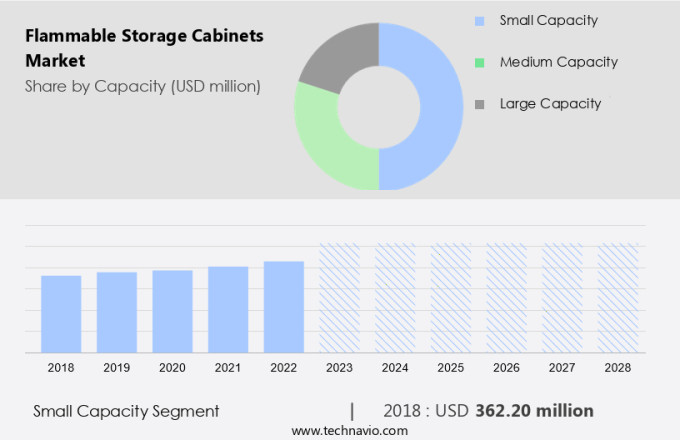
- The small capacity segment is estimated to witness significant growth during the forecast period.
The market for flammable storage cabinets accommodating a capacity of up to 30 gallons is experiencing significant demand in the United States, particularly in sectors such as laboratories, research facilities, and small manufacturing sites. This trend is driven by the increasing importance of workplace safety and the need for proper storage of hazardous materials. These compact cabinets are essential for facilities with limited space or those requiring the storage of smaller quantities of flammable substances near workstations. Compliance with Occupational Safety and Health Administration (OSHA) and National Fire Protection Association (NFPA) regulations is a major consideration for organizations. These regulations ensure the safe handling and storage of flammable materials, thereby reducing the risk of chemical exposures.
Furthermore, advanced features such as monitoring systems, ventilation, and advanced locking systems add to the appeal of these cabinets. Flammable storage cabinets are also gaining popularity in other applications, including automotive repair shops and educational institutions. The implementation of safety protocols in small to medium-sized enterprises is a significant factor contributing to the growth of this market segment. These storage solutions offer an effective and efficient solution for the safe storage of flammable materials while adhering to regulatory requirements. In conclusion, the demand for small flammable storage cabinets is on the rise in the United States due to the importance of workplace safety, regulatory compliance, and the need for efficient storage solutions for smaller quantities of flammable materials. These cabinets offer advanced features such as monitoring systems, ventilation, and advanced locking systems, making them an attractive option for organizations across various industries.
Get a glance at the market report of share of various segments Request Free Sample
The small capacity segment was valued at USD 362.20 million in 2018 and showed a gradual increase during the forecast period.
Regional Analysis
- North America is estimated to contribute 53% to the growth of the global market during the forecast period.
Technavio's analysts have elaborately explained the regional trends and drivers that shape the market during the forecast period.
For more insights on the market share of various regions Request Free Sample
The North American market for flammable storage cabinets is experiencing notable growth due to stringent workplace safety regulations and a heightened focus on risk management. In the United States, the Occupational Safety and Health Administration (OSHA) mandates the use of approved safety cabinets for storing combustible liquids under 29 CFR 1910.106. This regulatory requirement, coupled with increased awareness of chemical hazards following notable incidents, has encouraged businesses across various industries to invest in certified storage solutions.
Moreover, Canada and Mexico are similarly observing a growth in demand for flammable storage cabinets as they align their safety frameworks with international best practices. These cabinets, which come in various material qualities, offer enhanced fire resistance and safety measures, making them indispensable for healthcare facilities and other establishments dealing with flammable substances. By prioritizing investments in these solutions, businesses can ensure compliance with safety standards and protect their assets and employees from potential hazards.
Market Dynamics
Our researchers analyzed the data with 2023 as the base year, along with the key drivers, trends, and challenges. A holistic analysis of drivers will help companies refine their marketing strategies to gain a competitive advantage.
What are the key market drivers leading to the rise in adoption of Flammable Storage Cabinets Market?
The growing incidence of fires due to hazardous chemicals is the key driver of the market.
- The handling and storage of flammable and hazardous chemicals have become a significant concern for various industries and institutions, including hospitals and manufacturing facilities, due to the potential risks of fires and explosions. According to the US Chemical Safety Board, there were over 270 reported hazardous chemical incidents in the US in 2021. These incidents highlight the importance of implementing effective storage solutions, such as flammable storage cabinets, to prevent such incidents. Flammable storage cabinets are engineered with advanced biosafety protocols and construction techniques to ensure the safe and secure storage of flammable liquids, gases, and reactive substances. These cabinets are constructed with fire-resistant materials and feature spill containment systems and advanced safety mechanisms to prevent accidents.
- Furthermore, the implementation of such storage solutions is not only essential for complying with safety regulations but also for maintaining biosecurity and biosafety engineering standards. Investing in flammable storage cabinets is a crucial step toward mitigating risks associated with the handling and storage of hazardous chemicals. By providing a secure and controlled environment for the storage of these substances, businesses can prevent potential accidents, minimize damage, and protect their employees and the environment. Therefore, it is recommended that businesses prioritize the acquisition of high-quality flammable storage cabinets to ensure the safe handling and storage of their hazardous materials.
What are the market trends shaping the Flammable Storage Cabinets Market?
Workplace safety regulations are the upcoming trend in the market.
- The market in the United States is shaped by the strict adherence to safety regulations set by organizations like the Occupational Safety and Health Administration (OSHA) and the Environmental Protection Agency (EPA). These regulations dictate specifications for the storage of hazardous chemicals, with a focus on proper ventilation, fire-resistant construction, and clear labeling systems. For example, OSHA's 29 CFR 1910.106 standard requires that flammable liquids be housed in approved safety cabinets, which feature double-walled steel construction with a 1.5-inch air space, leak-proof sills, and self-closing doors.
- Additionally, European Union REACH regulations and directives also significantly impact the market. Moreover, the importance of ventilation systems, such as those offered by Airflow, in flammable storage cabinets cannot be overstated, as they ensure the safe containment and handling of hazardous materials.
What challenges does Flammable Storage Cabinets Market face during the growth?
High costs associated with flammable storage cabinets is a key challenge affecting the market growth.
- Flammable storage cabinets are essential for industries dealing with petrochemicals, medical supplies, and research and development in factory laboratories. These safety cabinets mitigate fire risks by providing a sterile workspace and safeguarding against the potential ignition of volatile substances. However, the high cost of manufacturing these cabinets using fire-resistant materials and advanced features, such as sensor-based monitoring and emergency response systems, can be a significant financial burden for small and medium-sized businesses, particularly in developing regions. The ongoing expenses, including regular inspections, servicing, and recertification, add to the total cost of ownership. Despite these challenges, the importance of adhering to safety regulations and ensuring the protection of valuable research and active pharmaceutical ingredients cannot be overstated.
- Additionally, compliance with these guidelines is crucial in industries dealing with infectious agents and other hazardous materials. Investing in flammable storage cabinets is a strategic decision that requires careful consideration of the long-term benefits, including the protection of valuable assets, adherence to regulatory requirements, and the peace of mind that comes with knowing your workplace is secure. While the upfront cost may be substantial, the potential risks and consequences of a fire or explosion can be catastrophic. To optimize the investment, businesses can explore financing options, such as leasing or renting, and partnering with suppliers that offer comprehensive maintenance and servicing packages.
- Similarly, implementing a preventative maintenance program can help minimize the need for costly repairs and ensure the cabinets remain in optimal condition. In conclusion, flammable storage cabinets are a critical investment for industries dealing with hazardous materials and volatile substances. While the initial cost may be high, the long-term benefits, including safety, regulatory compliance, and the protection of valuable assets, far outweigh the expenses. By exploring financing options and implementing a preventative maintenance program, businesses can effectively manage the costs and maximize the value of their investment.
Exclusive Customer Landscape
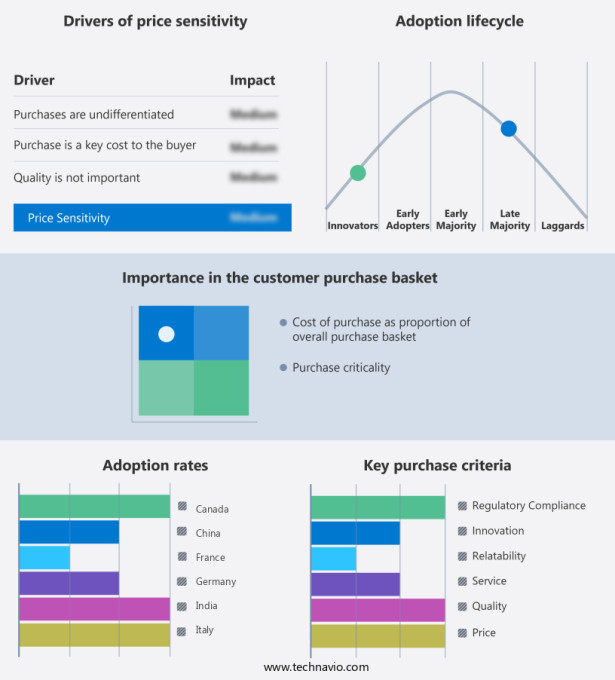
The market forecasting report includes the adoption lifecycle of the market, covering from the innovator's stage to the laggard's stage. It focuses on adoption rates in different regions based on penetration. Furthermore, the market report also includes key purchase criteria and drivers of price sensitivity to help companies evaluate and develop their market growth analysis strategies.
Customer Landscape
Key Companies & Market Insights
Companies are implementing various strategies, such as strategic alliances, market forecast, partnerships, mergers and acquisitions, geographical expansion, and product/service launches, to enhance their presence in the market. The market research and growth report includes detailed analyses of the competitive landscape of the market and information about key companies, including:
- Acklands Grainger Inc.
- asecos GmbH
- Atlantic Maritime Services Pvt. Ltd.
- Cole Parmer Instrument Co. LLC
- DENIOS INC.
- Herbert Williams Fire Equipment Ltd.
- JEIOTECH
- Justrite Mfg. Co. LLC
- Kewaunee International Group
- LabGuard India Pvt. Ltd
- Securall A and A Sheet Metal Products
- Shanghai SAI-U Metal Products Co Ltd.
- Shanghai SYSBEL Industry and Technology Co. Ltd.
- Stericox India Pvt. Ltd.
- UltraFab India Pvt. Ltd.
- Vestil Manufacturing Corp
- Wuxi Huanawell Metal Manufacturing Co Ltd.
Qualitative and quantitative analysis of companies has been conducted to help clients understand the wider business environment as well as the strengths and weaknesses of key market players. Data is qualitatively analyzed to categorize companies as pure play, category-focused, industry-focused, and diversified; it is quantitatively analyzed to categorize companies as dominant, leading, strong, tentative, and weak.
Research Analyst Overview
Flammable storage cabinets play a crucial role in safeguarding hazardous materials, particularly those with volatility and fire risk, in various industries. These cabinets are essential in sectors dealing with petroleum-based products, pharmaceuticals, dyes, and laboratories, among others. Regulatory compliance is paramount in ensuring workplace safety and environmental sustainability. Industry 4.0 technological advancements have led to the development of smart technologies and advanced locking systems, enhancing usability and connectivity features. Fire-resistant materials and monitoring systems are integral components of these cabinets, mitigating the risk of fire and chemical exposures. Chemical storage cabinets cater to various applications, including laboratories, research facilities, and manufacturing industries.
However, humidity control and ventilation systems are essential for maintaining optimal conditions, especially in applications dealing with solvents and other corrosive chemicals. Regulatory bodies oversee safety standards in the storage of hazardous substances, ensuring compliance with workplace safety regulations and biosafety protocols. Construction sites, hospitals, and educational institutions also utilize flammable storage cabinets to mitigate workplace hazards and maintain a sterile workspace. The petroleum chemical industry, healthcare facilities, and research and development centers rely on high-quality, fire-resistant materials to ensure safe storage of flammable liquids and other hazardous substances. Offline distribution channels and biosecurity measures further enhance the importance of these cabinets in various applications.
|
Market Scope |
|
|
Report Coverage |
Details |
|
Page number |
209 |
|
Base year |
2023 |
|
Historic period |
2018-2022 |
|
Forecast period |
2024-2028 |
|
Growth momentum & CAGR |
Accelerate at a CAGR of 5.4% |
|
Market growth 2024-2028 |
USD 352 million |
|
Market structure |
Fragmented |
|
YoY growth 2023-2024(%) |
4.0 |
|
Key countries |
US, Germany, Canada, UK, China, France, Japan, India, Italy, and South Korea |
|
Competitive landscape |
Leading Companies, Market Positioning of Companies, Competitive Strategies, and Industry Risks |
What are the Key Data Covered in this Market Research and Growth Report?
- CAGR of the market during the forecast period
- Detailed information on factors that will drive the market growth and forecasting between 2024 and 2028
- Precise estimation of the size of the market and its contribution of the market in focus to the parent market
- Accurate predictions about upcoming market growth and trends and changes in consumer behaviour
- Growth of the market across North America, Europe, APAC, South America, and Middle East and Africa
- Thorough analysis of the market's competitive landscape and detailed information about companies
- Comprehensive analysis of factors that will challenge the growth of market companies
We can help! Our analysts can customize this market research report to meet your requirements. Get in touch


