Floating Wind Turbine Market Analysis Europe, Asia, North America, Rest of World (ROW) - UK, Japan, Norway, France, Portugal - Size and Forecast 2024-2028

Floating Wind Turbine Market Analysis Europe, Asia, North America, Rest of World (ROW) - UK, Japan, Norway, France, Portugal - Size and Forecast 2024-2028

Published: Aug 2024 192 Pages SKU: IRTNTR44934

Market Overview at a Glance

$7.20 B
Market Opportunity
80.08%
CAGR
79.36
YoY growth 2023-2024(%)

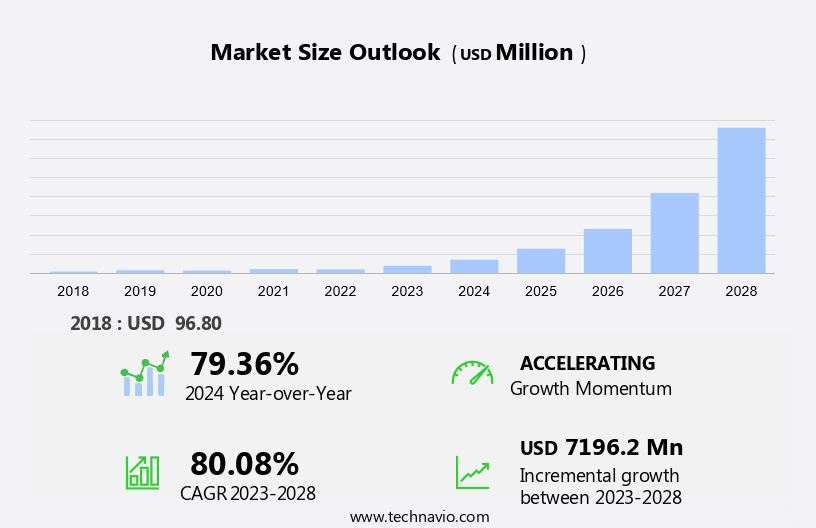
Floating Wind Turbine Market Size 2024-2028 

The floating wind turbine market size is forecast to increase by USD 7.2 billion at a CAGR of 80.08% between 2023 and 2028. The sustainable energy market is witnessing significant growth in the adoption of floating wind turbines due to several driving factors. Favorable government regulations encourage the construction of wind farms in offshore locations, leading to the expansion of the market. The decline in the levelized cost of energy (LCOE) for wind energy generation makes floating wind turbines a cost-effective solution for generating electricity, reducing greenhouse gas emissions and carbon footprint. However, competition from alternative renewable energy sources, such as solar and onshore wind, poses a challenge to the market's growth. To stay competitive, market players must focus on innovation and efficiency to reduce the LCOE of floating wind turbines and improve their performance in harsh oceanic conditions.

Floating Wind Turbine Market Size

 Request Free Sample

Floating wind turbines have emerged as a promising solution to harness wind energy from deep and shallow waters, contributing significantly to the shift towards sustainable power sources. Wind energy, as a renewable and green alternative to fossil fuels, plays a crucial role in mitigating climate change and reducing carbon emissions. Wind Farms and Wind Energy: Wind farms, with their extensive installations of wind turbines, have become a cornerstone of the renewable energy sector. Floating wind turbines expand the reach of wind energy production to offshore sites, where traditional wind turbines cannot operate.

Moreover, these turbines offer an effective solution for energy generation in deep water areas, reducing dependence on fossil fuels and contributing to sustainable energy consumption. Renewable Energy and Green Energy: The global focus on renewable electricity generation and green energy sources has intensified in recent years. Floating wind turbines provide a viable option for meeting the increasing demand for electricity consumption while reducing the carbon footprint. By utilizing wind energy from deep and shallow waters, these turbines contribute to the reduction of greenhouse gases and the overall decrease in carbon emissions. Foundation Technologies: Two primary foundation technologies are employed in floating wind turbine installations: spar-buoy foundations and tension-leg platform (TLP) foundations.

Furthermore, three buoy foundations use a vertical buoy to support the turbine, while TLP foundations use a series of tensioned cables to secure the turbine to the seabed. Semi-submersible foundations are also used in some cases. Each foundation technology offers unique advantages depending on the water depth and site conditions. Deep Water and Shallow Water: Floating wind turbines are designed to operate in both deep and shallow waters. Deep water installations offer higher wind speeds and potential energy output, while shallow water sites may have lower installation costs and easier access for maintenance. Floating wind turbines provide a flexible solution for wind energy production in various water depths, expanding the reach of renewable energy sources.

Moreover, the energy Costs and Sustainable Energy: As energy costs continue to rise and the importance of sustainable energy becomes increasingly apparent, floating wind turbines offer a cost-effective and eco-friendly solution. These turbines enable the expansion of wind energy production to offshore sites, reducing reliance on fossil fuels and contributing to a more sustainable energy mix. Conclusion: Floating wind turbines represent a significant advancement in the renewable energy sector, offering a flexible and effective solution for harnessing wind energy from deep and shallow waters. By reducing dependence on fossil fuels and contributing to the reduction of greenhouse gases, these turbines play a crucial role in mitigating climate change and promoting sustainable energy consumption.

Similarly, the ongoing advancements in floating wind turbine technology promise a promising future for this innovative energy source.

Market Segmentation

The market research report provides comprehensive data (region-wise segment analysis), with forecasts and estimates in "USD billion" for the period 2024-2028, as well as historical data from 2018-2022 for the following segments.

  • Capacity
    • Large-scale
    • Medium-scale
    • Small-scale
  • Type
    • Semi-submersible
    • Spar-buoy
    • Others
  • Geography
    • Europe
      • UK
      • France
      • Norway
    • Asia
      • Japan
    • North America
    • Rest of World (ROW)

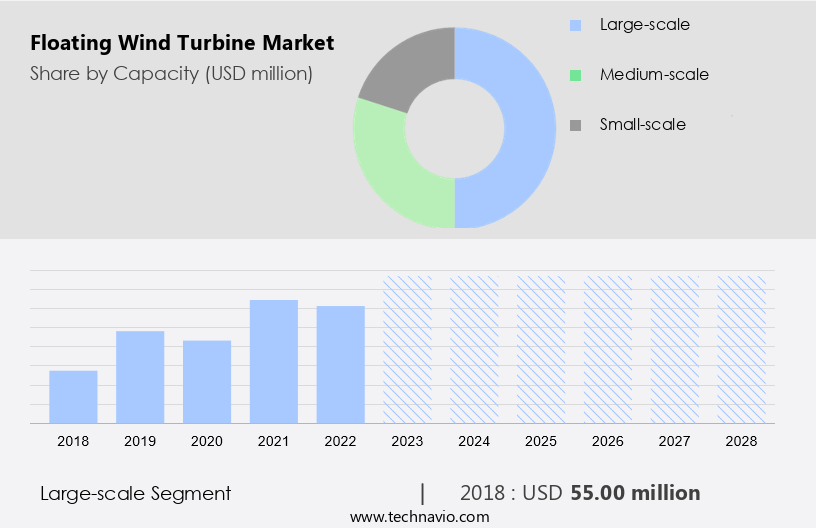
By Capacity Insights

The large-scale segment is estimated to witness significant growth during the forecast period. The market encompasses the production and deployment of wind turbines that are not fixed to the seabed but instead, float on the water surface. These innovative renewable energy solutions are gaining significant traction as sustainable power sources, particularly in the development of wind farms and wind energy projects. Large-scale floating wind turbines, which have a capacity exceeding 8 MW, are a rapidly expanding segment within this market. The large-scale segment is a substantial and swiftly progressing portion of the renewable energy sector. These turbines, with their high capacity, are specifically designed for large-scale offshore wind farms and deep-water floating applications.

Moreover, the ability to harness stronger and more consistent winds found further offshore, where traditional fixed-bottom turbines are not feasible, is a primary reason for their increasing popularity. Advancements in technology have enabled the design and installation of larger turbines on floating platforms, fueling the growth of The market. These technological developments include advancements in materials, engineering, and construction techniques, which have made it possible to create larger, more efficient turbines that can operate effectively in floating conditions. In summary, the large-scale market represents a significant and growing portion of the renewable energy sector, driven by technological advancements that enable the deployment of larger, more efficient turbines in offshore wind farms and deep-water applications.

Floating Wind Turbine Market Size

Get a glance at the market share of various segments Request Free Sample

The large-scale segment was valued at USD 55.00 million in 2018 and showed a gradual increase during the forecast period.
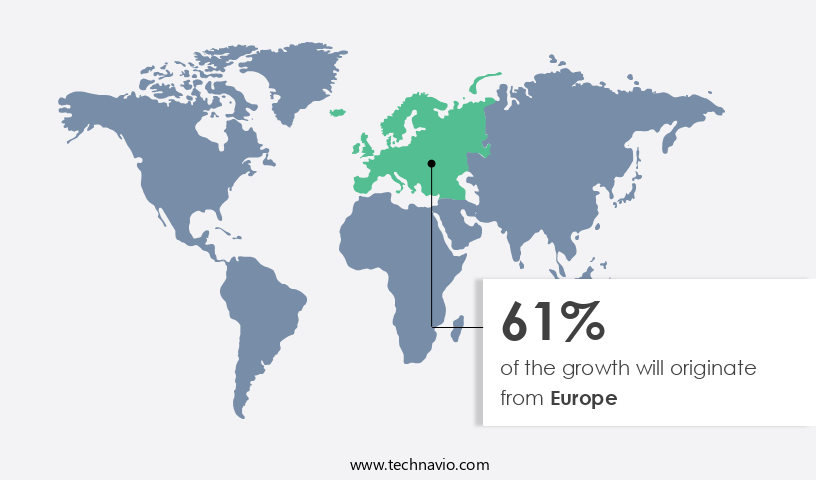
Regional Insights

Europe is estimated to contribute 61% to the growth of the global market during the forecast period. Technavio's analysts have elaborately explained the regional trends and drivers that shape the market during the forecast period.

Floating Wind Turbine Market Share by Geography

For more insights on the market share of various regions Request Free Sample

The European market is projected to experience substantial expansion throughout the forecast period. Notable European countries driving this market include the United Kingdom, France, and Norway. In the UK, prime locations for floating wind farms are situated off the coast of Scotland, characterized by deep waters and favorable geology and metocean conditions suitable for the deployment of floating wind turbines. Additionally, the southwest region of the UK presents promising opportunities for floating wind technology. France boasts suitable sites for floating wind projects in the Mediterranean and Atlantic waters off its coastline, enabling developers to harness the high wind speeds in these areas. These locations offer significant potential for the renewable energy sector as Europe pursues net zero ambitions and strives for industrial-scale renewable energy supply.

Our researchers analyzed the data with 2023 as the base year, along with the key drivers, trends, and challenges. A holistic analysis of drivers will help companies refine their marketing strategies to gain a competitive advantage.

Market Driver

Favorable government regulations for floating wind turbines is the key driver of the market. In the pursuit of clean energy, the energy sector in the United States and globally is shifting towards renewable sources such as wind power, solar photovoltaics (PV), and hydropower. The market, a subset of offshore wind energy, is still in its infancy but gaining traction due to government support. To accelerate the development of floating offshore wind projects, various subsidies and funding mechanisms are being implemented. For instance, the UK government aims to expand its offshore wind energy capacity to 40 Gigawatts (GW) by 2030. Several governments have already invested in demonstration projects to showcase the potential of floating wind turbines. These initiatives are crucial for reducing carbon emissions and lowering energy costs in the long run. The clean energy sector's future relies on continuous innovation and investment in advanced technologies like floating production storage vessels (FPSVs) for offshore wind energy.

Market Trends

The decline in LCOE of wind power generation is the upcoming trend in the market. The global market for wind energy, specifically offshore wind energy, has experienced significant growth due to technological innovations and international efforts to transition to clean energy sources. One such advancement is the utilization of Tension-leg platform foundations for floating wind turbines, which has expanded the reach of wind energy generation into deeper waters. This expansion has led to increased competition with traditional energy sources, such as fossil fuels.

Furthermore, cost reductions in wind turbine operations and maintenance, as well as decreasing turbine costs, have resulted in competitive pricing in the wind turbine market. Consequently, the levelized cost of energy (LCOE) for wind energy has decreased, making it a more economically viable option. Recent bids in Europe and North America for wind energy projects at lower price per kWh have intensified the competitiveness of projects scheduled for commissioning in the upcoming years.

Market Challenge

Competition from alternative technologies is a key challenge affecting the market growth. The global market for sustainable energy, specifically floating wind turbines, is gaining traction as the world seeks to reduce electricity consumption from greenhouse gas-emitting sources and decrease carbon footprints. However, the construction of wind farms using this technology comes with a higher initial investment compared to traditional wind energy methods. Despite this, the intermittent nature of renewable energy sources, such as wind, should not be overlooked. According to the International Energy Agency (IEA), fossil fuels continue to dominate the global electricity generation landscape due to their abundance and lower upfront costs.

For instance, Indonesia, with its renewable energy ambitions, may still rely on coal for the next decade as its primary energy source. The shift towards renewable energy is essential to mitigate environmental concerns, but the challenge lies in balancing the high capital expenditure and inconsistent power output from renewable sources against the reliability and affordability of fossil fuels.

Exclusive Customer Landscape

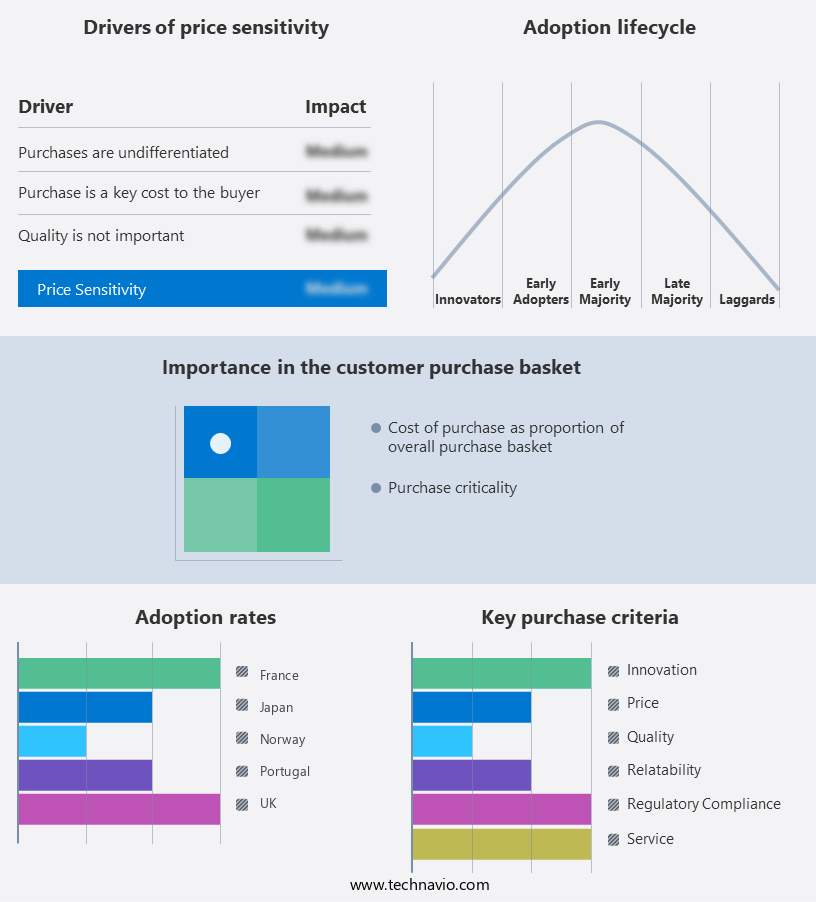
The market forecasting report includes the adoption lifecycle of the market, covering from the innovator's stage to the laggard's stage. It focuses on adoption rates in different regions based on penetration. Furthermore, the report also includes key purchase criteria and drivers of price sensitivity to help companies evaluate and develop their market growth analysis strategies.

Floating Wind Turbine Market Share by Geography

 Customer Landscape

Key Companies & Market Insights

Companies are implementing various strategies, such as strategic alliances, partnerships, mergers and acquisitions, geographical expansion, and product/service launches, to enhance their presence in the market.

Doosan Corp.: The company offers floating wind turbine products such as WinDS3300 and WinDS5500, and 8MW class large-capacity offshore wind turbines.

The market research and growth report includes detailed analyses of the competitive landscape of the market and information about key companies, including:

  • BW Group
  • Doosan Corp.
  • Eaton Corp. Plc
  • Electricite de France SA
  • EnBW Energie Baden Wurttemberg AG
  • ENERCON GmbH
  • Envision Group
  • Equinor ASA
  • General Electric Co.
  • Hitachi Ltd.
  • Ming Yang Smart Energy Group Ltd.
  • Mitsubishi Heavy Industries Ltd.
  • Naval Group
  • Nordex SE
  • Orsted AS
  • Principle Power Inc.
  • SBM Offshore NV
  • Siemens AG
  • Vestas Wind Systems AS
  • Xinjiang Goldwind Science and Technology Co. Ltd.

Qualitative and quantitative analysis of companies has been conducted to help clients understand the wider business environment as well as the strengths and weaknesses of key market players. Data is qualitatively analyzed to categorize companies as pure play, category-focused, industry-focused, and diversified; it is quantitatively analyzed to categorize companies as dominant, leading, strong, tentative, and weak.

Research Analyst Overview

Floating wind turbines are revolutionizing the wind energy sector by enabling energy generation in deep water locations, previously inaccessible for traditional wind farms. Sustainable power sources like wind energy are increasingly becoming the preferred choice to combat climate change and reduce carbon emissions, as the world moves towards net zero ambitions. Renewable energy and green energy are gaining traction in the industrial-scale energy market, replacing fossil fuels and their substantial carbon footprint. Wind farm construction in deep waters is made possible by innovative technologies such as spar-buoy foundations, tension-leg platforms (TLPs), and semi-submersible foundations. Floating offshore wind is a promising solution for meeting electricity consumption demands in commercial and industrial sectors, particularly in regions with cerulean winds.

Moreover, the clean energy sector is witnessing a swell in demand for floating wind turbines due to their ability to generate renewable energy supply at an industrial scale. Energy costs are expected to decrease as the technology matures, making floating wind energy a competitive option for meeting energy demand. The commercial viability of floating wind energy is further enhanced by the integration of floating production and solar energy storage vessels. The future of energy generation lies in the hands of sustainable energy sources, and floating wind turbines are set to play a significant role in this transition.

Market Scope

Report Coverage

Details

Page number

192

Base year

2023

Historic period

2018-2022

Forecast period

2024-2028

Growth momentum & CAGR

Accelerate at a CAGR of 80.08%

Market Growth 2024-2028

USD 7.19 billion

Market structure

Fragmented

YoY growth 2023-2024(%)

79.36

Regional analysis

Europe, Asia, North America, and Rest of World (ROW)

Performing market contribution

Europe at 61%

Key countries

UK, Japan, Norway, France, and Portugal

Competitive landscape

Leading Companies, Market Positioning of Companies, Competitive Strategies, and Industry Risks

Key companies profiled

BW Group, Doosan Corp., Eaton Corp. Plc, Electricite de France SA, EnBW Energie Baden Wurttemberg AG, ENERCON GmbH, Envision Group, Equinor ASA, General Electric Co., Hitachi Ltd., Ming Yang Smart Energy Group Ltd., Mitsubishi Heavy Industries Ltd., Naval Group, Nordex SE, Orsted AS, Principle Power Inc., SBM Offshore NV, Siemens AG, Vestas Wind Systems AS, and Xinjiang Goldwind Science and Technology Co. Ltd.

Market dynamics

Parent market analysis, market growth inducers and obstacles, market forecast, fast-growing and slow-growing segment analysis, COVID-19 impact and recovery analysis and future consumer dynamics, market condition analysis for the forecast period

Customization purview

If our market report has not included the data that you are looking for, you can reach out to our analysts and get segments customized.

Request Free Sample

What are the Key Data Covered in this Market Research and Growth Report?

  • CAGR of the market during the forecast period
  • Detailed information on factors that will drive the market growth and forecasting between 2024 and 2028
  • Precise estimation of the size of the market  and its contribution of the market in focus to the parent market
  • Accurate predictions about upcoming market growth and trends and changes in consumer behaviour
  • Growth of the market across Europe, Asia, North America, and Rest of World (ROW)
  • Thorough analysis of the market's competitive landscape and detailed information about companies
  • Comprehensive analysis of factors that will challenge the growth of market companies

We can help! Our analysts can customize this market research report to meet your requirements. Get in touch

1 Executive Summary

  • 1.1 Market overview
    • Executive Summary - Chart on Market Overview
    • Executive Summary - Data Table on Market Overview
    • Executive Summary - Chart on Global Market Characteristics
    • Executive Summary - Chart on Market by Geography
    • Executive Summary - Chart on Market Segmentation by Capacity
    • Executive Summary - Chart on Market Segmentation by Type
    • Executive Summary - Chart on Incremental Growth
    • Executive Summary - Data Table on Incremental Growth
    • Executive Summary - Chart on Company Market Positioning

2 Technavio Analysis

  • 2.1 Analysis of price sensitivity, lifecycle, customer purchase basket, adoption rates, and purchase criteria
    • Analysis of price sensitivity, lifecycle, customer purchase basket, adoption rates, and purchase criteria
  • 2.2 Criticality of inputs and Factors of differentiation
    • Overview on criticality of inputs and factors of differentiation
  • 2.3 Factors of disruption
    • Overview on factors of disruption
  • 2.4 Impact of drivers and challenges
    • Impact of drivers and challenges in 2023 and 2028

3 Market Landscape

  • 3.1 Market ecosystem
    • Parent Market
    • Data Table on - Parent Market
  • 3.2 Market characteristics
    • Market characteristics analysis
  • 3.3 Value chain analysis
    • Value Chain Analysis

4 Market Sizing

  • 4.1 Market definition
    • Offerings of companies included in the market definition
  • 4.2 Market segment analysis
    • Market segments
  • 4.3 Market size 2023
    • 4.4 Market outlook: Forecast for 2023-2028
      • Chart on Global - Market size and forecast 2023-2028 ($ million)
      • Data Table on Global - Market size and forecast 2023-2028 ($ million)
      • Chart on Global Market: Year-over-year growth 2023-2028 (%)
      • Data Table on Global Market: Year-over-year growth 2023-2028 (%)

    5 Additional Value/Volume Data

    • 5.1 Global floating wind turbine market 2018 - 2022 ($ million)
      • Market Size (value) - Data Table on Global floating wind turbine market 2018 - 2022 ($ million)
    • 5.2 Global floating wind turbine market by Geography 2018 - 2022 ($ million)
      • Market Size (value) - Data Table on Global floating wind turbine market by Geography 2018 - 2022 ($ million)
    • 5.3 Global floating wind turbine market by Capacity 2018 - 2022 ($ million)
      • Market Size (value) - Data Table on Global floating wind turbine market by Capacity 2018 - 2022 ($ million)
    • 5.4 Global floating wind turbine market by Type 2018 - 2022 ($ million)
      • Market Size (value) - Data Table on Global floating wind turbine market by Type 2018 - 2022 ($ million)
    • 5.5 Global floating wind turbine market by country 2018 - 2022 ($ million)
      • Market Size (value) - Data Table on Global floating wind turbine market by Country 2018 - 2022 ($ million)

    6 Five Forces Analysis

    • 6.1 Five forces summary
      • Five forces analysis - Comparison between 2023 and 2028
    • 6.2 Bargaining power of buyers
      • Bargaining power of buyers - Impact of key factors 2023 and 2028
    • 6.3 Bargaining power of suppliers
      • Bargaining power of suppliers - Impact of key factors in 2023 and 2028
    • 6.4 Threat of new entrants
      • Threat of new entrants - Impact of key factors in 2023 and 2028
    • 6.5 Threat of substitutes
      • Threat of substitutes - Impact of key factors in 2023 and 2028
    • 6.6 Threat of rivalry
      • Threat of rivalry - Impact of key factors in 2023 and 2028
    • 6.7 Market condition
      • Chart on Market condition - Five forces 2023 and 2028

    7 Market Segmentation by Capacity

    • 7.1 Market segments
      • Chart on Capacity - Market share 2023-2028 (%)
      • Data Table on Capacity - Market share 2023-2028 (%)
    • 7.2 Comparison by Capacity
      • Chart on Comparison by Capacity
      • Data Table on Comparison by Capacity
    • 7.3 Large-scale - Market size and forecast 2023-2028
      • Chart on Large-scale - Market size and forecast 2023-2028 ($ million)
      • Data Table on Large-scale - Market size and forecast 2023-2028 ($ million)
      • Chart on Large-scale - Year-over-year growth 2023-2028 (%)
      • Data Table on Large-scale - Year-over-year growth 2023-2028 (%)
    • 7.4 Medium-scale - Market size and forecast 2023-2028
      • Chart on Medium-scale - Market size and forecast 2023-2028 ($ million)
      • Data Table on Medium-scale - Market size and forecast 2023-2028 ($ million)
      • Chart on Medium-scale - Year-over-year growth 2023-2028 (%)
      • Data Table on Medium-scale - Year-over-year growth 2023-2028 (%)
    • 7.5 Small-scale - Market size and forecast 2023-2028
      • Chart on Small-scale - Market size and forecast 2023-2028 ($ million)
      • Data Table on Small-scale - Market size and forecast 2023-2028 ($ million)
      • Chart on Small-scale - Year-over-year growth 2023-2028 (%)
      • Data Table on Small-scale - Year-over-year growth 2023-2028 (%)
    • 7.6 Market opportunity by Capacity
      • Market opportunity by Capacity ($ million)
      • Data Table on Market opportunity by Capacity ($ million)

    8 Market Segmentation by Type

    • 8.1 Market segments
      • Chart on Type - Market share 2023-2028 (%)
      • Data Table on Type - Market share 2023-2028 (%)
    • 8.2 Comparison by Type
      • Chart on Comparison by Type
      • Data Table on Comparison by Type
    • 8.3 Semi-submersible - Market size and forecast 2023-2028
      • Chart on Semi-submersible - Market size and forecast 2023-2028 ($ million)
      • Data Table on Semi-submersible - Market size and forecast 2023-2028 ($ million)
      • Chart on Semi-submersible - Year-over-year growth 2023-2028 (%)
      • Data Table on Semi-submersible - Year-over-year growth 2023-2028 (%)
    • 8.4 Spar-buoy - Market size and forecast 2023-2028
      • Chart on Spar-buoy - Market size and forecast 2023-2028 ($ million)
      • Data Table on Spar-buoy - Market size and forecast 2023-2028 ($ million)
      • Chart on Spar-buoy - Year-over-year growth 2023-2028 (%)
      • Data Table on Spar-buoy - Year-over-year growth 2023-2028 (%)
    • 8.5 Others - Market size and forecast 2023-2028
      • Chart on Others - Market size and forecast 2023-2028 ($ million)
      • Data Table on Others - Market size and forecast 2023-2028 ($ million)
      • Chart on Others - Year-over-year growth 2023-2028 (%)
      • Data Table on Others - Year-over-year growth 2023-2028 (%)
    • 8.6 Market opportunity by Type
      • Market opportunity by Type ($ million)
      • Data Table on Market opportunity by Type ($ million)

    9 Customer Landscape

    • 9.1 Customer landscape overview
      • Analysis of price sensitivity, lifecycle, customer purchase basket, adoption rates, and purchase criteria

    10 Geographic Landscape

    • 10.1 Geographic segmentation
      • Chart on Market share by geography 2023-2028 (%)
      • Data Table on Market share by geography 2023-2028 (%)
    • 10.2 Geographic comparison
      • Chart on Geographic comparison
      • Data Table on Geographic comparison
    • 10.3 Europe - Market size and forecast 2023-2028
      • Chart on Europe - Market size and forecast 2023-2028 ($ million)
      • Data Table on Europe - Market size and forecast 2023-2028 ($ million)
      • Chart on Europe - Year-over-year growth 2023-2028 (%)
      • Data Table on Europe - Year-over-year growth 2023-2028 (%)
    • 10.4 Asia - Market size and forecast 2023-2028
      • Chart on Asia - Market size and forecast 2023-2028 ($ million)
      • Data Table on Asia - Market size and forecast 2023-2028 ($ million)
      • Chart on Asia - Year-over-year growth 2023-2028 (%)
      • Data Table on Asia - Year-over-year growth 2023-2028 (%)
    • 10.5 North America - Market size and forecast 2023-2028
      • Chart on North America - Market size and forecast 2023-2028 ($ million)
      • Data Table on North America - Market size and forecast 2023-2028 ($ million)
      • Chart on North America - Year-over-year growth 2023-2028 (%)
      • Data Table on North America - Year-over-year growth 2023-2028 (%)
    • 10.6 Rest of World (ROW) - Market size and forecast 2023-2028
      • Chart on Rest of World (ROW) - Market size and forecast 2023-2028 ($ million)
      • Data Table on Rest of World (ROW) - Market size and forecast 2023-2028 ($ million)
      • Chart on Rest of World (ROW) - Year-over-year growth 2023-2028 (%)
      • Data Table on Rest of World (ROW) - Year-over-year growth 2023-2028 (%)
    • 10.7 UK - Market size and forecast 2023-2028
      • Chart on UK - Market size and forecast 2023-2028 ($ million)
      • Data Table on UK - Market size and forecast 2023-2028 ($ million)
      • Chart on UK - Year-over-year growth 2023-2028 (%)
      • Data Table on UK - Year-over-year growth 2023-2028 (%)
    • 10.8 Portugal - Market size and forecast 2023-2028
      • Chart on Portugal - Market size and forecast 2023-2028 ($ million)
      • Data Table on Portugal - Market size and forecast 2023-2028 ($ million)
      • Chart on Portugal - Year-over-year growth 2023-2028 (%)
      • Data Table on Portugal - Year-over-year growth 2023-2028 (%)
    • 10.9 Norway - Market size and forecast 2023-2028
      • Chart on Norway - Market size and forecast 2023-2028 ($ million)
      • Data Table on Norway - Market size and forecast 2023-2028 ($ million)
      • Chart on Norway - Year-over-year growth 2023-2028 (%)
      • Data Table on Norway - Year-over-year growth 2023-2028 (%)
    • 10.10 Japan - Market size and forecast 2023-2028
      • Chart on Japan - Market size and forecast 2023-2028 ($ million)
      • Data Table on Japan - Market size and forecast 2023-2028 ($ million)
      • Chart on Japan - Year-over-year growth 2023-2028 (%)
      • Data Table on Japan - Year-over-year growth 2023-2028 (%)
    • 10.11 France - Market size and forecast 2023-2028
      • Chart on France - Market size and forecast 2023-2028 ($ million)
      • Data Table on France - Market size and forecast 2023-2028 ($ million)
      • Chart on France - Year-over-year growth 2023-2028 (%)
      • Data Table on France - Year-over-year growth 2023-2028 (%)
    • 10.12 Market opportunity by geography
      • Market opportunity by geography ($ million)
      • Data Tables on Market opportunity by geography ($ million)

    11 Drivers, Challenges, and Opportunity/Restraints

    • 11.1 Market drivers
      • 11.2 Market challenges
        • 11.3 Impact of drivers and challenges
          • Impact of drivers and challenges in 2023 and 2028
        • 11.4 Market opportunities/restraints

          12 Competitive Landscape

          • 12.1 Overview
            • 12.2 Competitive Landscape
              • Overview on criticality of inputs and factors of differentiation
            • 12.3 Landscape disruption
              • Overview on factors of disruption
            • 12.4 Industry risks
              • Impact of key risks on business

            13 Competitive Analysis

            • 13.1 Companies profiled
              • Companies covered
            • 13.2 Company ranking index
              • Company ranking index
            • 13.3 Market positioning of companies
              • Matrix on companies position and classification
            • 13.4 Doosan Corp.
              • Doosan Corp. - Overview
              • Doosan Corp. - Business segments
              • Doosan Corp. - Key news
              • Doosan Corp. - Key offerings
              • Doosan Corp. - Segment focus
              • SWOT
            • 13.5 Eaton Corp. Plc
              • Eaton Corp. Plc - Overview
              • Eaton Corp. Plc - Business segments
              • Eaton Corp. Plc - Key news
              • Eaton Corp. Plc - Key offerings
              • Eaton Corp. Plc - Segment focus
              • SWOT
            • 13.6 Electricite de France SA
              • Electricite de France SA - Overview
              • Electricite de France SA - Business segments
              • Electricite de France SA - Key offerings
              • Electricite de France SA - Segment focus
              • SWOT
            • 13.7 EnBW Energie Baden Wurttemberg AG
              • EnBW Energie Baden Wurttemberg AG - Overview
              • EnBW Energie Baden Wurttemberg AG - Business segments
              • EnBW Energie Baden Wurttemberg AG - Key offerings
              • EnBW Energie Baden Wurttemberg AG - Segment focus
              • SWOT
            • 13.8 Equinor ASA
              • Equinor ASA - Overview
              • Equinor ASA - Business segments
              • Equinor ASA - Key news
              • Equinor ASA - Key offerings
              • Equinor ASA - Segment focus
              • SWOT
            • 13.9 General Electric Co.
              • General Electric Co. - Overview
              • General Electric Co. - Business segments
              • General Electric Co. - Key news
              • General Electric Co. - Key offerings
              • General Electric Co. - Segment focus
              • SWOT
            • 13.10 Hitachi Ltd.
              • Hitachi Ltd. - Overview
              • Hitachi Ltd. - Business segments
              • Hitachi Ltd. - Key news
              • Hitachi Ltd. - Key offerings
              • Hitachi Ltd. - Segment focus
              • SWOT
            • 13.11 Ming Yang Smart Energy Group Ltd.
              • Ming Yang Smart Energy Group Ltd. - Overview
              • Ming Yang Smart Energy Group Ltd. - Business segments
              • Ming Yang Smart Energy Group Ltd. - Key offerings
              • Ming Yang Smart Energy Group Ltd. - Segment focus
              • SWOT
            • 13.12 Naval Group
              • Naval Group - Overview
              • Naval Group - Product / Service
              • Naval Group - Key offerings
              • SWOT
            • 13.13 Nordex SE
              • Nordex SE - Overview
              • Nordex SE - Business segments
              • Nordex SE - Key offerings
              • Nordex SE - Segment focus
              • SWOT
            • 13.14 Principle Power Inc.
              • Principle Power Inc. - Overview
              • Principle Power Inc. - Product / Service
              • Principle Power Inc. - Key offerings
              • SWOT
            • 13.15 SBM Offshore NV
              • SBM Offshore NV - Overview
              • SBM Offshore NV - Business segments
              • SBM Offshore NV - Key offerings
              • SBM Offshore NV - Segment focus
              • SWOT
            • 13.16 Siemens AG
              • Siemens AG - Overview
              • Siemens AG - Business segments
              • Siemens AG - Key news
              • Siemens AG - Key offerings
              • Siemens AG - Segment focus
              • SWOT
            • 13.17 Vestas Wind Systems AS
              • Vestas Wind Systems AS - Overview
              • Vestas Wind Systems AS - Business segments
              • Vestas Wind Systems AS - Key offerings
              • Vestas Wind Systems AS - Segment focus
              • SWOT
            • 13.18 Xinjiang Goldwind Science and Technology Co. Ltd.
              • Xinjiang Goldwind Science and Technology Co. Ltd. - Overview
              • Xinjiang Goldwind Science and Technology Co. Ltd. - Business segments
              • Xinjiang Goldwind Science and Technology Co. Ltd. - Key offerings
              • Xinjiang Goldwind Science and Technology Co. Ltd. - Segment focus
              • SWOT

            14 Appendix

            • 14.1 Scope of the report
              • 14.2 Inclusions and exclusions checklist
                • Inclusions checklist
                • Exclusions checklist
              • 14.3 Currency conversion rates for US$
                • Currency conversion rates for US$
              • 14.4 Research methodology
                • Research methodology
              • 14.5 Data procurement
                • Information sources
              • 14.6 Data validation
                • Data validation
              • 14.7 Validation techniques employed for market sizing
                • Validation techniques employed for market sizing
              • 14.8 Data synthesis
                • Data synthesis
              • 14.9 360 degree market analysis
                • 360 degree market analysis
              • 14.10 List of abbreviations
                • List of abbreviations

              Research Methodology

              Technavio presents a detailed picture of the market by way of study, synthesis, and summation of data from multiple sources. The analysts have presented the various facets of the market with a particular focus on identifying the key industry influencers. The data thus presented is comprehensive, reliable, and the result of extensive research, both primary and secondary.

              INFORMATION SOURCES

              Primary sources

              • Manufacturers and suppliers
              • Channel partners
              • Industry experts
              • Strategic decision makers

              Secondary sources

              • Industry journals and periodicals
              • Government data
              • Financial reports of key industry players
              • Historical data
              • Press releases

              DATA ANALYSIS

              Data Synthesis

              • Collation of data
              • Estimation of key figures
              • Analysis of derived insights

              Data Validation

              • Triangulation with data models
              • Reference against proprietary databases
              • Corroboration with industry experts

              REPORT WRITING

              Qualitative

              • Market drivers
              • Market challenges
              • Market trends
              • Five forces analysis

              Quantitative

              • Market size and forecast
              • Market segmentation
              • Geographical insights
              • Competitive landscape

              Interested in this report?

              Get your sample now to see our research methodology and insights!

              Download Now

              Frequently Asked Questions

              Floating Wind Turbine market growth will increase by $ 7196.2 mn during 2024-2028 .

              The Floating Wind Turbine market is expected to grow at a CAGR of 80.08% during 2024-2028 .

              Floating Wind Turbine market is segmented by Capacity( Large-scale, Medium-scale, Small-scale) Type( Semi-submersible, Spar-buoy, Others, South America, MEA)

              BW Group, Doosan Corp., Eaton Corp. Plc, Electricite de France SA, EnBW Energie Baden Wurttemberg AG, ENERCON GmbH, Envision Group, Equinor ASA, General Electric Co., Hitachi Ltd., Ming Yang Smart Energy Group Ltd., Mitsubishi Heavy Industries Ltd., Naval Group, Nordex SE, Orsted AS, Principle Power Inc., SBM Offshore NV, Siemens AG, Vestas Wind Systems AS, Xinjiang Goldwind Science and Technology Co. Ltd. are a few of the key vendors in the Floating Wind Turbine market.

              Europe will register the highest growth rate of 61% among the other regions. Therefore, the Floating Wind Turbine market in Europe is expected to garner significant business opportunities for the vendors during the forecast period.

              UK, Japan, Norway, France, Portugal

              • Favorable government regulations for floating wind turbinesTo promote emission-free technologies is the driving factor this market.
              • the use of alternative energy sources such as wind power is the driving factor this market.
              • solar PV is the driving factor this market.
              • and hydropower is essential. Globally is the driving factor this market.
              • governments support the adoption of wind power as it is an essential renewable energy source. As the global floating wind turbine market is in its nascent stage is the driving factor this market.
              • some targeted subsidy mechanisms are enforced to support floating wind projects. Many governments have granted funds for floating offshore wind demonstration projects. Some of the activities toward the development of offshore wind projects supported by governments are as follows:The UK government announced its plan to increase the capacity of offshore wind energy installed base to 40 GW by 2030. It also aims to support the development of floating wind turbines during the same period.The European Commission estimated that Europe would need 240 GW -450 GW of offshore wind power by 2050.The Ministry of New and Renewable Energy (MNRE) in India reached its medium- and long-term offshore wind energy target of 5 GW by 2022.Governments from many other countries is the driving factor this market.
              • especially France is the driving factor this market.
              • Norway is the driving factor this market.
              • Portugal is the driving factor this market.
              • Japan is the driving factor this market.
              • and the US is the driving factor this market.
              • have also supported floating offshore wind projects through various industry collaborations and funding mechanisms is the driving factor this market.
              • which will drive the growth of the global floating wind turbine market during the forecast period. is the driving factor this market.

              The Floating Wind Turbine market vendors should focus on grabbing business opportunities from the Large-scale segment as it accounted for the largest market share in the base year.