Flow Meter Market Analysis, Size, and Forecast 2024-2028: North America (US and Canada), Europe (France, Germany, Italy, and UK), Middle East and Africa (Egypt, KSA, Oman, and UAE), APAC (China, India, and Japan), South America (Argentina and Brazil), and Rest of World (ROW)

Flow Meter Market Analysis, Size, and Forecast 2024-2028:
North America (US and Canada), Europe (France, Germany, Italy, and UK), Middle East and Africa (Egypt, KSA, Oman, and UAE), APAC (China, India, and Japan), South America (Argentina and Brazil), and Rest of World (ROW)

Published: Aug 2024 185 Pages SKU: IRTNTR70884

Market Overview at a Glance

$3.03 B
Market Opportunity
5.98%
CAGR
5.55
YoY growth 2023-2024(%)

Flow Meter Market Size 2024-2028

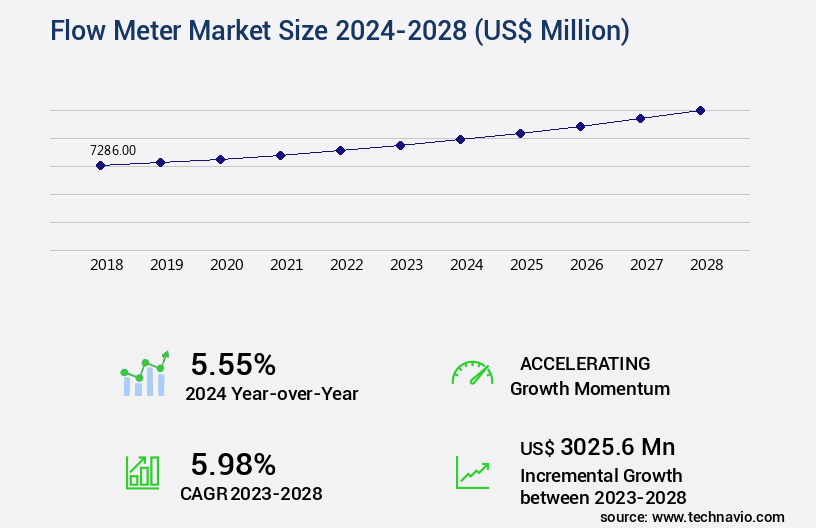
The flow meter market size is valued to increase USD 3.03 billion, at a CAGR of 5.98% from 2023 to 2028. Rising awareness on benefits associated with flow meters will drive the flow meter market.

Major Market Trends & Insights

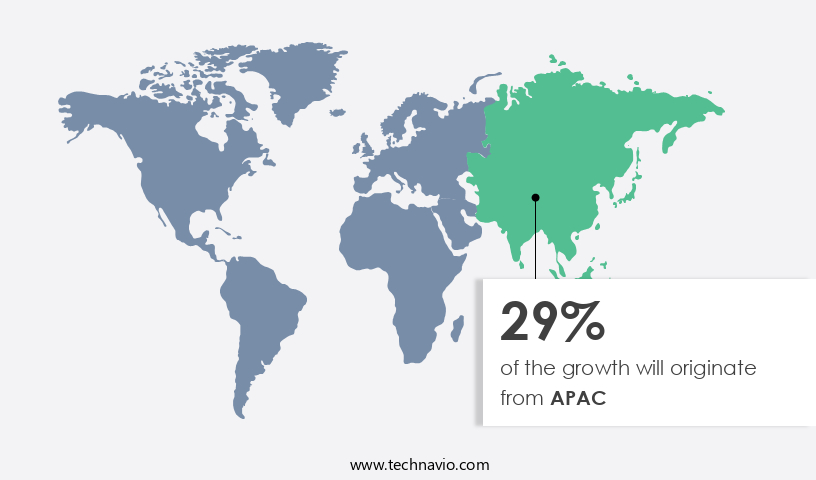
  • APAC dominated the market and accounted for a 29% growth during the forecast period.
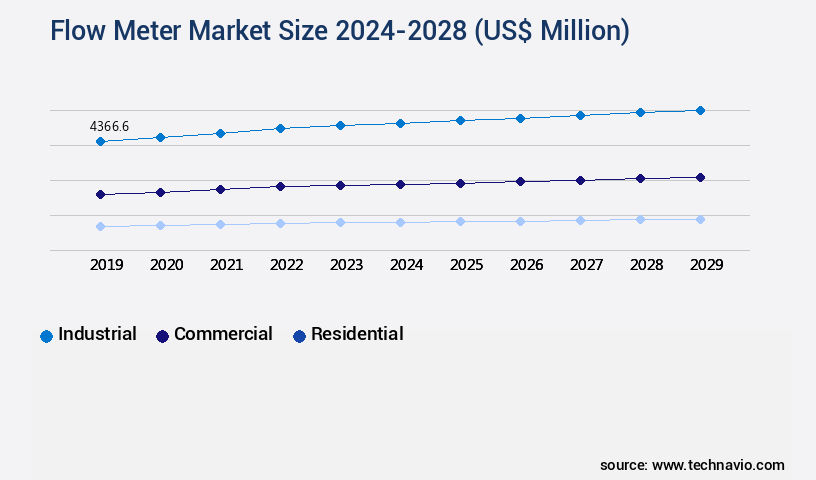
  • By End-user - Industrial segment was valued at USD 4.24 billion in 2022
  • By Technology Type - Ultrasonic segment accounted for the largest market revenue share in 2022

Market Size & Forecast

  • Market Opportunities: USD 64.82 million
  • Market Future Opportunities: USD 3025.60 million
  • CAGR : 5.98%
  • APAC: Largest market in 2022

Market Summary

  • The market represents a dynamic and evolving industry, driven by the increasing adoption of advanced technologies and the growing demand for accurate and efficient flow measurement solutions. Core technologies, such as ultrasonic and Coriolis flow meters, continue to dominate the market, accounting for over 60% of the global market share. Applications in industries like oil and gas, water and wastewater, and power generation are primary drivers of market growth. Despite challenges such as fluctuating crude oil prices and regulatory compliance, the market is expected to recover gradually due to the rising awareness of the benefits associated with flow meters.
  • For instance, The market was valued at approximately USD17.5 billion in 2020 and is projected to reach USD24.5 billion by 2026, growing at a steady pace. This growth can be attributed to the increasing focus on process optimization, energy efficiency, and environmental regulations.

What will be the Size of the Flow Meter Market during the forecast period?

Flow Meter Market Size

Get Key Insights on Market Forecast (PDF) Request Free Sample

How is the Flow Meter Market Segmented and what are the key trends of market segmentation?

The flow meter industry research report provides comprehensive data (region-wise segment analysis), with forecasts and estimates in "USD million" for the period 2024-2028, as well as historical data from 2018-2022 for the following segments.

  • End-user
    • Industrial
    • Commercial
    • Residential
  • Technology Type
    • Ultrasonic
    • Magnetic
    • Coriolis
    • Vortex
  • Product Type
    • Differential Pressure
    • Positive Displacement
    • Velocity
    • Open Channel
  • Application
    • Oil and Gas
    • Water and Wastewater
    • Chemicals
    • Power Generation
  • Geography
    • North America
      • US
      • Canada
    • Europe
      • France
      • Germany
      • Italy
      • UK
    • Middle East and Africa
      • Egypt
      • KSA
      • Oman
      • UAE
    • APAC
      • China
      • India
      • Japan
    • South America
      • Argentina
      • Brazil
    • Rest of World (ROW)

By End-user Insights

The industrial segment is estimated to witness significant growth during the forecast period.

The industrial flow measurement market experiences significant growth, with the segment accounting for a substantial market share. Notably, the water and wastewater industry utilizes flow meters extensively for accurate liquid flow measurement in treatment systems. These systems cater to large volumes of fluid containing suspended solids, sludge by-products, and other materials. The objective is to ensure efficient and cost-effective operations. Moreover, the oil and gas sector is another major consumer of flow meters. These devices facilitate precise measurement of fluid flow in pipelines, enhancing operational productivity and safety. The chemical industry also relies on flow meters for process control and optimization, ensuring consistent product quality and reducing waste.

The power generation sector's increasing focus on energy efficiency and environmental sustainability further boosts the demand for flow meters. In the food and beverage industry, flow meters are essential for maintaining consistent product quality and ensuring regulatory compliance. The paper and printing industry uses flow meters to optimize processes and reduce downtime. Looking ahead, the market anticipates continued expansion, with the APAC and Middle Eastern regions driving growth due to increasing industrial investments. The adoption of advanced technologies, such as wireless flow meters, remote flow monitoring, and smart flow meters, is also fueling market growth. These technologies offer real-time monitoring, improved accuracy, and enhanced operational efficiency.

In summary, the industrial flow measurement market encompasses various sectors, including water and wastewater, oil and gas, chemical, power generation, food and beverage, and paper and printing. Flow meters play a crucial role in ensuring efficient and cost-effective operations, maintaining product quality, and ensuring regulatory compliance. The market's future growth is expected to be driven by technological advancements and increasing industrial investments in the APAC and Middle Eastern regions.

Flow Meter Market Size

Request Free Sample

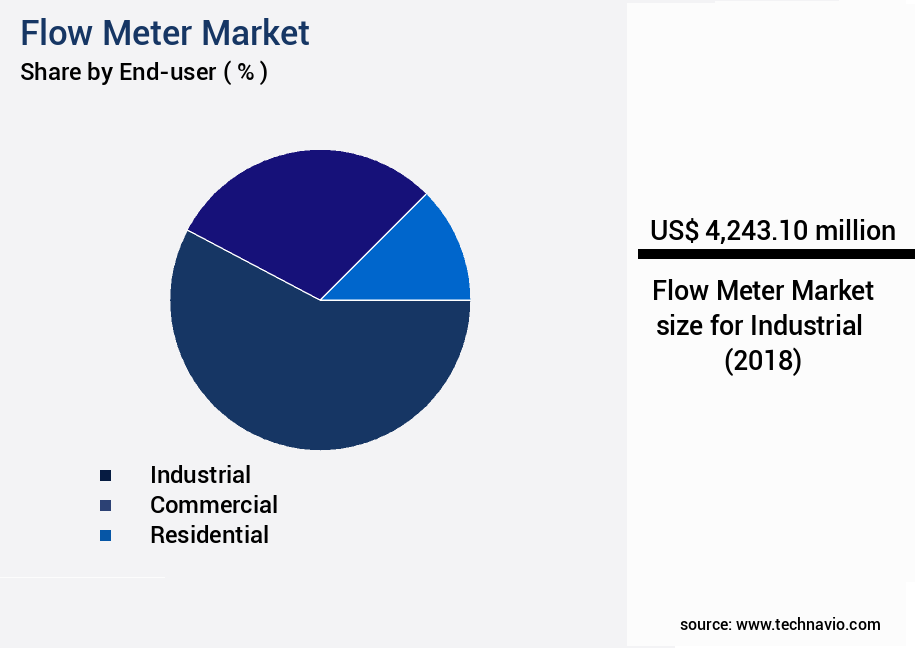
The Industrial segment was valued at USD 4.24 billion in 2018 and showed a gradual increase during the forecast period.

Flow Meter Market Size

Request Free Sample

Regional Analysis

APAC is estimated to contribute 29% to the growth of the global market during the forecast period.Technavio's analysts have elaborately explained the regional trends and drivers that shape the market during the forecast period.

Flow Meter Market Share by Geography

See How Flow Meter Market Demand is Rising in APAC Request Free Sample

In Europe, major industrialized countries such as Germany, Italy, France, the UK, Austria, Switzerland, and the Netherlands, contribute significantly to the market due to their heavy industrialization and demand in the oil and gas, chemical manufacturing sectors. The International Energy Agency (IEA) anticipates a 60 billion cubic meters (bcm) increase in European LNG imports by 2022, necessitating the installation of adequate transportation facilities for natural gas. This trend will fuel the demand for flow meters in the oil and gas industry during the forecast period. According to the European Flow Measuring Instruments Manufacturers Association (EFMIA), the European the market was valued at €3.3 billion in 2020, with a projected growth in demand for Coriolis and ultrasonic flow meters.

Additionally, the European market for magnetic flow meters is expected to grow at a steady pace due to their increasing applications in water and wastewater treatment. The market for turbine flow meters is also anticipated to witness significant growth due to their use in the oil and gas industry for measuring crude oil and natural gas flows.

Market Dynamics

Our researchers analyzed the data with 2023 as the base year, along with the key drivers, trends, and challenges. A holistic analysis of drivers will help companies refine their marketing strategies to gain a competitive advantage.

The market encompasses a range of technologies, including turbine, ultrasonic, differential pressure, positive displacement, electromagnetic, coriolis, thermal mass, vortex, and magnetic flow meters. Each technology offers unique performance characteristics catering to diverse industrial applications. Ultrasonic flow meters leverage advanced signal processing techniques to ensure high accuracy and reliability. In contrast, turbine flow meters, with their high-speed rotating blades, excel in handling large flow rates and harsh environments. Differential pressure flow meters, a popular choice for liquid applications, require a selection guide to ensure optimal performance based on specific fluid properties. Maintenance schedules for positive displacement flow meters are crucial to maintain their accuracy and efficiency.

Electromagnetic flow meters, known for their high accuracy, face limitations in measuring gases and high-viscosity fluids. Coriolis flow meters, a staple in chemical processing, offer high precision and versatility in measuring mass flow rates. Flow meter data acquisition systems require seamless integration with other industrial control systems. Gas flow meters necessitate calibration using standard methods to ensure accurate readings. Liquid flow rate control relies on PID controllers for precise regulation. Vortex flow meters are designed for high-pressure applications, while thermal mass flow meters prioritize accuracy and repeatability. Flow meter sensor technology advancements continue to drive market growth, with innovations in wireless communication protocols, smart flow meter integration with SCADA systems, and industrial flow measurement system design.

Process flow control system optimization is a key trend, with a focus on flow meter selection criteria for different fluids and optimization of system performance. A significant portion of market growth can be attributed to the adoption of advanced flow meter technologies in various industries. For instance, the adoption rates of ultrasonic flow meters in the oil and gas sector are nearly double those in the water and wastewater treatment industry. This trend underscores the importance of understanding the unique requirements of various industries and applications when selecting the optimal flow meter technology.

Flow Meter Market Size

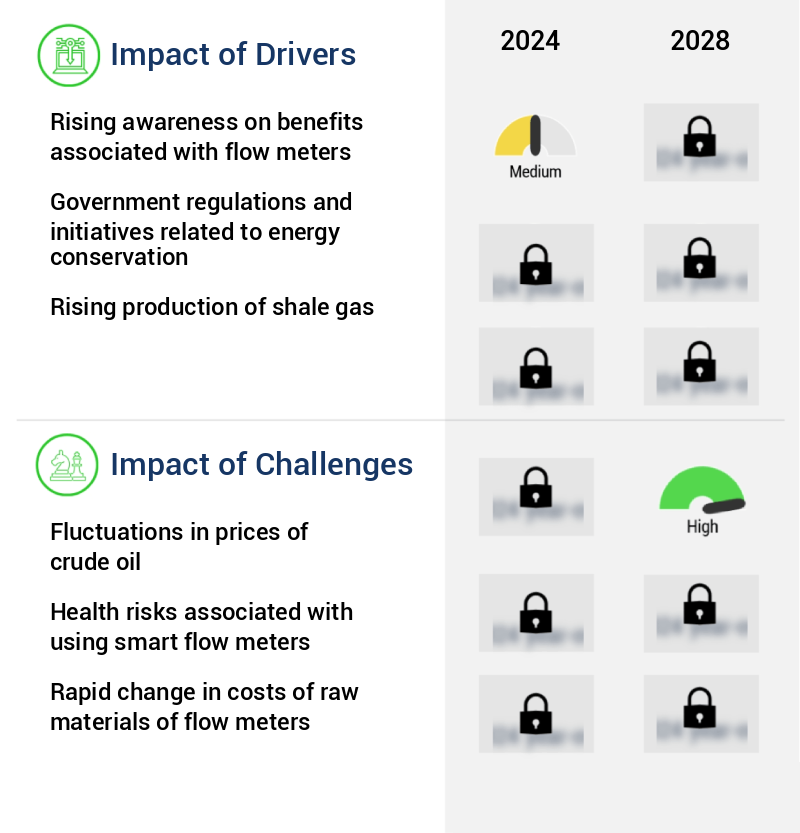
What are the key market drivers leading to the rise in the adoption of Flow Meter Industry?

  • The increasing recognition of flow meters' advantages is the primary catalyst driving market growth. 
  • The market experiences significant expansion due to the advantages offered in various industries. Flow meters play a pivotal role in sectors such as water and wastewater treatment, oil and gas, and power generation. They are also utilized in educational institutions for scientific research. In housing projects, flow meters help monitor water consumption. Engineers have developed robust flow meters capable of withstanding extreme environmental conditions, ensuring precise measurements. These devices contribute to controlling fluid velocity and usage, thereby conserving resources and minimizing wastage. By detecting leaks in pipelines, flow meters prevent unnecessary water loss, enhancing efficiency and cost savings.
  • Flow meters' versatility and applicability across numerous industries underscore their importance in modern industrial processes. Their role extends beyond measurement, offering benefits such as process optimization, improved efficiency, and cost reduction. 

What are the market trends shaping the Flow Meter Industry?

  • The gradual recovery of upstream market activity is an emerging trend. Upstream industries are experiencing a revival.
  • Flow meters, specifically those with multiphase technology, significantly contribute to upstream operations in the oil and gas industry. Once petroleum liquids reach the surface, they pass through a test separator for physical separation into oil, gas, and water. The test separator's primary function is to measure and analyze these constituents as they exit the well in real-time. Flow meters play a crucial role in this process, measuring the volume of each fluid as it leaves the separator.
  • By analyzing the content and flow rate of oil, water, and gas, operators can enhance reservoir analysis and optimize production processes. The integration of flow meters in upstream activities allows for continuous monitoring and improvement, ensuring efficient and effective use of resources.

What challenges does the Flow Meter Industry face during its growth?

  • The volatility in crude oil prices poses a significant challenge to the growth of the industry. 
  • Flow meters are essential tools in the oil and gas industry, serving a vital function in refineries and gas processing plants. These instruments, including Coriolis, ultrasonic, vortex, and turbine meters, measure both gas and liquid flow in in-plant processes. Flow meters are indispensable in blending operations for liquid hydrocarbons as well. The oil and gas sector, linked closely to the upstream industry, experienced a substantial impact due to market fluctuations. The downturn in oil prices significantly affected companies providing flow meters to the upstream and midstream sectors. Consequently, numerous large E and P projects were canceled or delayed, particularly subsea projects.
  • Despite these challenges, the market continues to evolve, with advancements in technology driving innovation. For instance, the increasing adoption of smart flow meters, which offer real-time monitoring and analytics, is a notable trend. Additionally, the growing emphasis on energy efficiency and environmental sustainability is leading to the development of flow meters designed to optimize energy usage and reduce emissions. In conclusion, the oil and gas industry's ongoing transformation necessitates the use of advanced flow meters to improve operational efficiency, ensure regulatory compliance, and reduce environmental impact. Despite market volatility, the market remains dynamic, with technological advancements and shifting industry trends shaping its future.

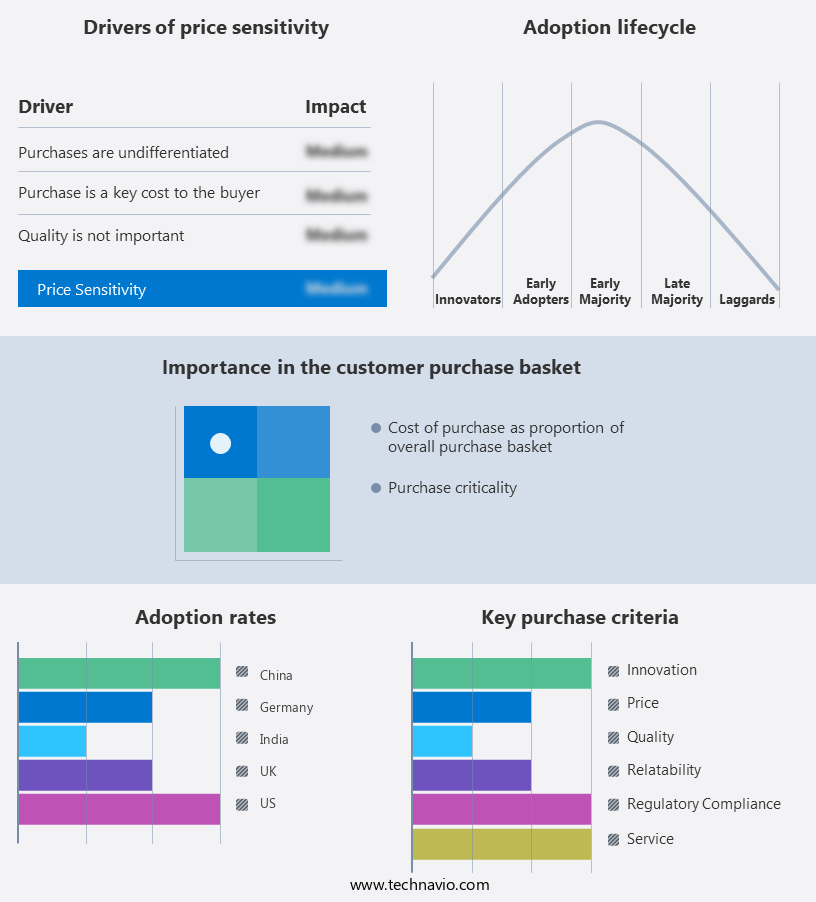
Exclusive Customer Landscape

The flow meter market forecasting report includes the adoption lifecycle of the market, covering from the innovator's stage to the laggard's stage. It focuses on adoption rates in different regions based on penetration. Furthermore, the flow meter market report also includes key purchase criteria and drivers of price sensitivity to help companies evaluate and develop their market growth analysis strategies.

Flow Meter Market Share by Geography

 Customer Landscape of Flow Meter Industry

Competitive Landscape & Market Insights

Companies are implementing various strategies, such as strategic alliances, flow meter market forecast, partnerships, mergers and acquisitions, geographical expansion, and product/service launches, to enhance their presence in the industry.

ABB Ltd. - This company specializes in providing advanced flow meters for various industries, including process and water and wastewater sectors. Their offerings ensure accurate measurement and efficient management of fluid volumes.

The industry research and growth report includes detailed analyses of the competitive landscape of the market and information about key companies, including:

  • ABB Ltd.
  • Azbil Corp.
  • Badger Meter Inc.
  • Brooks Instrument
  • Emerson Electric Co.
  • Endress+Hauser AG
  • General Electric Co.
  • Hitachi Ltd.
  • Honeywell International Inc.
  • Horiba Ltd.
  • Invensys Ltd.
  • KROHNE Messtechnik GmbH
  • OMEGA Engineering Inc.
  • Schneider Electric SE
  • Siemens AG
  • Teledyne Technologies Inc.
  • Tokyo Keiso Co. Ltd.
  • Toshiba Corp.
  • VSE Volumentechnik GmbH
  • Yokogawa Electric Corp.

Qualitative and quantitative analysis of companies has been conducted to help clients understand the wider business environment as well as the strengths and weaknesses of key industry players. Data is qualitatively analyzed to categorize companies as pure play, category-focused, industry-focused, and diversified; it is quantitatively analyzed to categorize companies as dominant, leading, strong, tentative, and weak.

Recent Development and News in Flow Meter Market

  • In January 2024, Emerson Electric Company, a leading technology and engineering firm, announced the launch of its new Micro Motion Coriolis 64000 series flow meters, designed to deliver enhanced accuracy and reliability for process industries. This innovation was showcased at the annual American Chemical Society conference (source: Emerson Electric Company press release).
  • In March 2024, ABB and Honeywell International signed a strategic collaboration agreement to combine their flow measurement and control technologies, aiming to create a comprehensive portfolio and enhance their market presence in the industrial automation sector (source: ABB press release).
  • In May 2024, Endress+Hauser, a Swiss flow measurement solutions provider, secured a significant order from a major oil and gas company for its Magnetic Flowmeter Proline 2000 series. The order, valued at over €10 million, was attributed to the product's high accuracy and reliability (source: Endress+Hauser press release).
  • In April 2025, the European Union (EU) introduced new regulations mandating the installation of advanced flow meters in industrial processes to improve energy efficiency and reduce emissions. This initiative is expected to drive demand for flow meter technologies in Europe (source: European Commission press release).

Dive into Technavio's robust research methodology, blending expert interviews, extensive data synthesis, and validated models for unparalleled Flow Meter Market insights. See full methodology.

Market Scope

Report Coverage

Details

Page number

185

Base year

2023

Historic period

2018-2022

Forecast period

2024-2028

Growth momentum & CAGR

Accelerate at a CAGR of 5.98%

Market growth 2024-2028

USD 3025.6 million

Market structure

Fragmented

YoY growth 2023-2024(%)

5.55

Key countries

US, Canada, Germany, UK, Italy, France, China, India, Japan, Brazil, Egypt, UAE, Oman, Argentina, KSA, UAE, Brazil, and Rest of World (ROW)

Competitive landscape

Leading Companies, Market Positioning of Companies, Competitive Strategies, and Industry Risks

Request Free Sample

Research Analyst Overview

  • In the dynamic and evolving landscape of industrial processes, flow rate measurement plays a pivotal role in optimizing efficiency and ensuring productivity. Two key technologies driving this market's growth are differential pressure sensors and wireless flow meters. Differential pressure sensors, a traditional yet reliable method, measure the difference in pressure between two points in a fluid system. Their robust design and high accuracy make them a preferred choice in various industries, including oil and gas, water and wastewater, and chemicals. On the other hand, wireless flow meters are gaining traction due to their advanced capabilities. These smart devices enable remote flow monitoring, providing real-time data access and facilitating predictive maintenance.
  • Compared to their wired counterparts, wireless flow meters offer increased flexibility and reduced installation costs. Industrial flow measurement continues to evolve, with a growing emphasis on automation and data-driven insights. The integration of artificial intelligence and machine learning algorithms in flow meters is revolutionizing troubleshooting and predictive maintenance. These advanced technologies enable early detection of anomalies and predictive analysis of potential issues, leading to significant cost savings and improved operational efficiency. In summary, the flow rate measurement market is characterized by continuous innovation and the integration of advanced technologies such as differential pressure sensors, wireless flow meters, and AI-driven solutions.
  • These advancements are transforming industrial processes by providing real-time data, improved accuracy, and enhanced operational efficiency.

What are the Key Data Covered in this Flow Meter Market Research and Growth Report?

  • What is the expected growth of the Flow Meter Market between 2024 and 2028?

    • USD 3.03 billion, at a CAGR of 5.98%

  • What segmentation does the market report cover?

    • The report segmented by End-user (Industrial, Commercial, and Residential), Technology Type (Ultrasonic, Magnetic, Coriolis, and Vortex), Geography (Europe, North America, APAC, South America, and Middle East and Africa), Product Type (Differential Pressure, Positive Displacement, Velocity, and Open Channel), and Application (Oil and Gas, Water and Wastewater, Chemicals, and Power Generation)

  • Which regions are analyzed in the report?

    • Europe, North America, APAC, South America, and Middle East and Africa

  • What are the key growth drivers and market challenges?

    • Rising awareness on benefits associated with flow meters, Fluctuations in prices of crude oil

  • Who are the major players in the Flow Meter Market?

    • Key Companies ABB Ltd., Azbil Corp., Badger Meter Inc., Brooks Instrument, Emerson Electric Co., Endress+Hauser AG, General Electric Co., Hitachi Ltd., Honeywell International Inc., Horiba Ltd., Invensys Ltd., KROHNE Messtechnik GmbH, OMEGA Engineering Inc., Schneider Electric SE, Siemens AG, Teledyne Technologies Inc., Tokyo Keiso Co. Ltd., Toshiba Corp., VSE Volumentechnik GmbH, and Yokogawa Electric Corp.

Market Research Insights

  • The market encompasses a diverse range of technologies, including positive displacement, Coriolis, ultrasonic, turbine, and electromagnetic flow meters, catering to industrial process flow control applications. According to industry estimates, the global market for industrial flow meters is projected to reach USD20 billion by 2025, growing at a compound annual growth rate of 4.5%. This expansion is driven by increasing demand for flow rate control in various industries, such as oil and gas, water and wastewater, and chemicals. Flow meter selection, installation, calibration, and maintenance are crucial aspects of ensuring accurate and reliable flow measurement. For instance, Coriolis flow technology offers high accuracy and versatility, making it a popular choice for industries requiring precise flow rate control.
  • In contrast, ultrasonic flow meters are non-intrusive and suitable for applications where there is a need for wireless flow monitoring. With the ongoing advancements in flow meter design and technology, smart flow sensors and wireless communication capabilities are becoming increasingly prevalent, enabling real-time flow rate monitoring and troubleshooting.

We can help! Our analysts can customize this flow meter market research report to meet your requirements.

Get in touch

1 Executive Summary

  • 1.1 Market overview
    • Executive Summary - Chart on Market Overview
    • Executive Summary - Data Table on Market Overview
    • Executive Summary - Chart on Global Market Characteristics
    • Executive Summary - Chart on Market by Geography
    • Executive Summary - Chart on Market Segmentation by End-user
    • Executive Summary - Chart on Market Segmentation by Type
    • Executive Summary - Chart on Incremental Growth
    • Executive Summary - Data Table on Incremental Growth
    • Executive Summary - Chart on Company Market Positioning

2 Market Landscape

  • 2.1 Market ecosystem
    • Parent Market
    • Data Table on - Parent Market
  • 2.2 Market characteristics
    • Market characteristics analysis
  • 2.3 Value chain analysis
    • Value Chain Analysis

3 Market Sizing

  • 3.1 Market definition
    • Offerings of companies included in the market definition
  • 3.2 Market segment analysis
    • Market segments
  • 3.3 Market size 2023
    • 3.4 Market outlook: Forecast for 2023-2028
      • Chart on Global - Market size and forecast 2023-2028 ($ million)
      • Data Table on Global - Market size and forecast 2023-2028 ($ million)
      • Chart on Global Market: Year-over-year growth 2023-2028 (%)
      • Data Table on Global Market: Year-over-year growth 2023-2028 (%)

    4 Historic Market Size

    • 4.1 Global Flow Meter Market 2018 - 2022
      • Historic Market Size - Data Table on Global Flow Meter Market 2018 - 2022 ($ million)
    • 4.2 End-user segment analysis 2018 - 2022
      • Historic Market Size - End-user Segment 2018 - 2022 ($ million)
    • 4.3 Type segment analysis 2018 - 2022
      • Historic Market Size - Type Segment 2018 - 2022 ($ million)
    • 4.4 Geography segment analysis 2018 - 2022
      • Historic Market Size - Geography Segment 2018 - 2022 ($ million)
    • 4.5 Country segment analysis 2018 - 2022
      • Historic Market Size - Country Segment 2018 - 2022 ($ million)

    5 Five Forces Analysis

    • 5.1 Five forces summary
      • Five forces analysis - Comparison between 2023 and 2028
    • 5.2 Bargaining power of buyers
      • Bargaining power of buyers - Impact of key factors 2023 and 2028
    • 5.3 Bargaining power of suppliers
      • Bargaining power of suppliers - Impact of key factors in 2023 and 2028
    • 5.4 Threat of new entrants
      • Threat of new entrants - Impact of key factors in 2023 and 2028
    • 5.5 Threat of substitutes
      • Threat of substitutes - Impact of key factors in 2023 and 2028
    • 5.6 Threat of rivalry
      • Threat of rivalry - Impact of key factors in 2023 and 2028
    • 5.7 Market condition
      • Chart on Market condition - Five forces 2023 and 2028

    6 Market Segmentation by End-user

    • 6.1 Market segments
      • Chart on End-user - Market share (2023-2028) (%)
      • Data Table on End-user - Market share (2023-2028) (%)
    • 6.2 Comparison by End-user
      • Chart on Comparison by End-user
      • Data Table on Comparison by End-user
    • 6.3 Industrial - Market size and forecast (2023-2028)
      • Chart on Industrial - Market size and forecast (2023-2028) ($ million)
      • Data Table on Industrial - Market size and forecast (2023-2028) ($ million)
      • Chart on Industrial - Year-over-year growth (2023-2028) (%)
      • Data Table on Industrial - Year-over-year growth (2023-2028) (%)
    • 6.4 Commercial - Market size and forecast (2023-2028)
      • Chart on Commercial - Market size and forecast (2023-2028) ($ million)
      • Data Table on Commercial - Market size and forecast (2023-2028) ($ million)
      • Chart on Commercial - Year-over-year growth (2023-2028) (%)
      • Data Table on Commercial - Year-over-year growth (2023-2028) (%)
    • 6.5 Residential - Market size and forecast (2023-2028)
      • Chart on Residential - Market size and forecast (2023-2028) ($ million)
      • Data Table on Residential - Market size and forecast (2023-2028) ($ million)
      • Chart on Residential - Year-over-year growth (2023-2028) (%)
      • Data Table on Residential - Year-over-year growth (2023-2028) (%)
    • 6.6 Market opportunity by End-user
      • Market opportunity by End-user ($ million)
      • Data Table on Market opportunity by End-user ($ million)

    7 Market Segmentation by Type

    • 7.1 Market segments
      • Chart on Type - Market share 2023-2028 (%)
      • Data Table on Type - Market share 2023-2028 (%)
    • 7.2 Comparison by Type
      • Chart on Comparison by Type
      • Data Table on Comparison by Type
    • 7.3 Ultrasonic - Market size and forecast 2023-2028
      • Chart on Ultrasonic - Market size and forecast 2023-2028 ($ million)
      • Data Table on Ultrasonic - Market size and forecast 2023-2028 ($ million)
      • Chart on Ultrasonic - Year-over-year growth 2023-2028 (%)
      • Data Table on Ultrasonic - Year-over-year growth 2023-2028 (%)
    • 7.4 Magnetic - Market size and forecast 2023-2028
      • Chart on Magnetic - Market size and forecast 2023-2028 ($ million)
      • Data Table on Magnetic - Market size and forecast 2023-2028 ($ million)
      • Chart on Magnetic - Year-over-year growth 2023-2028 (%)
      • Data Table on Magnetic - Year-over-year growth 2023-2028 (%)
    • 7.5 Differential pressure - Market size and forecast 2023-2028
      • Chart on Differential pressure - Market size and forecast 2023-2028 ($ million)
      • Data Table on Differential pressure - Market size and forecast 2023-2028 ($ million)
      • Chart on Differential pressure - Year-over-year growth 2023-2028 (%)
      • Data Table on Differential pressure - Year-over-year growth 2023-2028 (%)
    • 7.6 Others - Market size and forecast 2023-2028
      • Chart on Others - Market size and forecast 2023-2028 ($ million)
      • Data Table on Others - Market size and forecast 2023-2028 ($ million)
      • Chart on Others - Year-over-year growth 2023-2028 (%)
      • Data Table on Others - Year-over-year growth 2023-2028 (%)
    • 7.7 Market opportunity by Type
      • Market opportunity by Type ($ million)
      • Data Table on Market opportunity by Type ($ million)

    8 Market Segmentation by Technology Type

    • 8.1 Market segments
      • Chart on Technology Type - Market share (2023-2028) (%)
      • Data Table on Technology Type - Market share (2023-2028) (%)
    • 8.2 Comparison by Technology Type
      • Chart on Comparison by Technology Type
      • Data Table on Comparison by Technology Type
    • 8.3 Ultrasonic - Market size and forecast (2023-2028)
      • Chart on Ultrasonic - Market size and forecast (2023-2028) ($ million)
      • Data Table on Ultrasonic - Market size and forecast (2023-2028) ($ million)
      • Chart on Ultrasonic - Year-over-year growth (2023-2028) (%)
      • Data Table on Ultrasonic - Year-over-year growth (2023-2028) (%)
    • 8.4 Magnetic - Market size and forecast (2023-2028)
      • Chart on Magnetic - Market size and forecast (2023-2028) ($ million)
      • Data Table on Magnetic - Market size and forecast (2023-2028) ($ million)
      • Chart on Magnetic - Year-over-year growth (2023-2028) (%)
      • Data Table on Magnetic - Year-over-year growth (2023-2028) (%)
    • 8.5 Coriolis - Market size and forecast (2023-2028)
      • Chart on Coriolis - Market size and forecast (2023-2028) ($ million)
      • Data Table on Coriolis - Market size and forecast (2023-2028) ($ million)
      • Chart on Coriolis - Year-over-year growth (2023-2028) (%)
      • Data Table on Coriolis - Year-over-year growth (2023-2028) (%)
    • 8.6 Vortex - Market size and forecast (2023-2028)
      • Chart on Vortex - Market size and forecast (2023-2028) ($ million)
      • Data Table on Vortex - Market size and forecast (2023-2028) ($ million)
      • Chart on Vortex - Year-over-year growth (2023-2028) (%)
      • Data Table on Vortex - Year-over-year growth (2023-2028) (%)
    • 8.7 Market opportunity by Technology Type
      • Market opportunity by Technology Type ($ million)
      • Data Table on Market opportunity by Technology Type ($ million)

    9 Market Segmentation by Product Type

    • 9.1 Market segments
      • Chart on Product Type - Market share (2023-2028) (%)
      • Data Table on Product Type - Market share (2023-2028) (%)
    • 9.2 Comparison by Product Type
      • Chart on Comparison by Product Type
      • Data Table on Comparison by Product Type
    • 9.3 Differential Pressure - Market size and forecast (2023-2028)
      • Chart on Differential Pressure - Market size and forecast (2023-2028) ($ million)
      • Data Table on Differential Pressure - Market size and forecast (2023-2028) ($ million)
      • Chart on Differential Pressure - Year-over-year growth (2023-2028) (%)
      • Data Table on Differential Pressure - Year-over-year growth (2023-2028) (%)
    • 9.4 Positive Displacement - Market size and forecast (2023-2028)
      • Chart on Positive Displacement - Market size and forecast (2023-2028) ($ million)
      • Data Table on Positive Displacement - Market size and forecast (2023-2028) ($ million)
      • Chart on Positive Displacement - Year-over-year growth (2023-2028) (%)
      • Data Table on Positive Displacement - Year-over-year growth (2023-2028) (%)
    • 9.5 Velocity - Market size and forecast (2023-2028)
      • Chart on Velocity - Market size and forecast (2023-2028) ($ million)
      • Data Table on Velocity - Market size and forecast (2023-2028) ($ million)
      • Chart on Velocity - Year-over-year growth (2023-2028) (%)
      • Data Table on Velocity - Year-over-year growth (2023-2028) (%)
    • 9.6 Open Channel - Market size and forecast (2023-2028)
      • Chart on Open Channel - Market size and forecast (2023-2028) ($ million)
      • Data Table on Open Channel - Market size and forecast (2023-2028) ($ million)
      • Chart on Open Channel - Year-over-year growth (2023-2028) (%)
      • Data Table on Open Channel - Year-over-year growth (2023-2028) (%)
    • 9.7 Market opportunity by Product Type
      • Market opportunity by Product Type ($ million)
      • Data Table on Market opportunity by Product Type ($ million)

    10 Market Segmentation by Application

    • 10.1 Market segments
      • Chart on Application - Market share (2023-2028) (%)
      • Data Table on Application - Market share (2023-2028) (%)
    • 10.2 Comparison by Application
      • Chart on Comparison by Application
      • Data Table on Comparison by Application
    • 10.3 Oil and Gas - Market size and forecast (2023-2028)
      • Chart on Oil and Gas - Market size and forecast (2023-2028) ($ million)
      • Data Table on Oil and Gas - Market size and forecast (2023-2028) ($ million)
      • Chart on Oil and Gas - Year-over-year growth (2023-2028) (%)
      • Data Table on Oil and Gas - Year-over-year growth (2023-2028) (%)
    • 10.4 Water and Wastewater - Market size and forecast (2023-2028)
      • Chart on Water and Wastewater - Market size and forecast (2023-2028) ($ million)
      • Data Table on Water and Wastewater - Market size and forecast (2023-2028) ($ million)
      • Chart on Water and Wastewater - Year-over-year growth (2023-2028) (%)
      • Data Table on Water and Wastewater - Year-over-year growth (2023-2028) (%)
    • 10.5 Chemicals - Market size and forecast (2023-2028)
      • Chart on Chemicals - Market size and forecast (2023-2028) ($ million)
      • Data Table on Chemicals - Market size and forecast (2023-2028) ($ million)
      • Chart on Chemicals - Year-over-year growth (2023-2028) (%)
      • Data Table on Chemicals - Year-over-year growth (2023-2028) (%)
    • 10.6 Power Generation - Market size and forecast (2023-2028)
      • Chart on Power Generation - Market size and forecast (2023-2028) ($ million)
      • Data Table on Power Generation - Market size and forecast (2023-2028) ($ million)
      • Chart on Power Generation - Year-over-year growth (2023-2028) (%)
      • Data Table on Power Generation - Year-over-year growth (2023-2028) (%)
    • 10.7 Market opportunity by Application
      • Market opportunity by Application ($ million)
      • Data Table on Market opportunity by Application ($ million)

    11 Customer Landscape

    • 11.1 Customer landscape overview
      • Analysis of price sensitivity, lifecycle, customer purchase basket, adoption rates, and purchase criteria

    12 Geographic Landscape

    • 12.1 Geographic segmentation
      • Chart on Market share by geography 2023-2028 (%)
      • Data Table on Market share by geography 2023-2028 (%)
    • 12.2 Geographic comparison
      • Chart on Geographic comparison
      • Data Table on Geographic comparison
    • 12.3 Europe - Market size and forecast 2023-2028
      • Chart on Europe - Market size and forecast 2023-2028 ($ million)
      • Data Table on Europe - Market size and forecast 2023-2028 ($ million)
      • Chart on Europe - Year-over-year growth 2023-2028 (%)
      • Data Table on Europe - Year-over-year growth 2023-2028 (%)
    • 12.4 North America - Market size and forecast 2023-2028
      • Chart on North America - Market size and forecast 2023-2028 ($ million)
      • Data Table on North America - Market size and forecast 2023-2028 ($ million)
      • Chart on North America - Year-over-year growth 2023-2028 (%)
      • Data Table on North America - Year-over-year growth 2023-2028 (%)
    • 12.5 APAC - Market size and forecast 2023-2028
      • Chart on APAC - Market size and forecast 2023-2028 ($ million)
      • Data Table on APAC - Market size and forecast 2023-2028 ($ million)
      • Chart on APAC - Year-over-year growth 2023-2028 (%)
      • Data Table on APAC - Year-over-year growth 2023-2028 (%)
    • 12.6 South America - Market size and forecast 2023-2028
      • Chart on South America - Market size and forecast 2023-2028 ($ million)
      • Data Table on South America - Market size and forecast 2023-2028 ($ million)
      • Chart on South America - Year-over-year growth 2023-2028 (%)
      • Data Table on South America - Year-over-year growth 2023-2028 (%)
    • 12.7 Middle East and Africa - Market size and forecast 2023-2028
      • Chart on Middle East and Africa - Market size and forecast 2023-2028 ($ million)
      • Data Table on Middle East and Africa - Market size and forecast 2023-2028 ($ million)
      • Chart on Middle East and Africa - Year-over-year growth 2023-2028 (%)
      • Data Table on Middle East and Africa - Year-over-year growth 2023-2028 (%)
    • 12.8 Germany - Market size and forecast 2023-2028
      • Chart on Germany - Market size and forecast 2023-2028 ($ million)
      • Data Table on Germany - Market size and forecast 2023-2028 ($ million)
      • Chart on Germany - Year-over-year growth 2023-2028 (%)
      • Data Table on Germany - Year-over-year growth 2023-2028 (%)
    • 12.9 US - Market size and forecast 2023-2028
      • Chart on US - Market size and forecast 2023-2028 ($ million)
      • Data Table on US - Market size and forecast 2023-2028 ($ million)
      • Chart on US - Year-over-year growth 2023-2028 (%)
      • Data Table on US - Year-over-year growth 2023-2028 (%)
    • 12.10 UK - Market size and forecast 2023-2028
      • Chart on UK - Market size and forecast 2023-2028 ($ million)
      • Data Table on UK - Market size and forecast 2023-2028 ($ million)
      • Chart on UK - Year-over-year growth 2023-2028 (%)
      • Data Table on UK - Year-over-year growth 2023-2028 (%)
    • 12.11 China - Market size and forecast 2023-2028
      • Chart on China - Market size and forecast 2023-2028 ($ million)
      • Data Table on China - Market size and forecast 2023-2028 ($ million)
      • Chart on China - Year-over-year growth 2023-2028 (%)
      • Data Table on China - Year-over-year growth 2023-2028 (%)
    • 12.12 India - Market size and forecast 2023-2028
      • Chart on India - Market size and forecast 2023-2028 ($ million)
      • Data Table on India - Market size and forecast 2023-2028 ($ million)
      • Chart on India - Year-over-year growth 2023-2028 (%)
      • Data Table on India - Year-over-year growth 2023-2028 (%)
    • 12.13 Market opportunity by geography
      • Market opportunity by geography ($ million)
      • Data Tables on Market opportunity by geography ($ million)
    • 12.14 Canada - Market size and forecast (2023-2028)
      • Chart on Canada - Market size and forecast (2023-2028) ($ million)
      • Data Table on Canada - Market size and forecast (2023-2028) ($ million)
      • Chart on Canada - Year-over-year growth (2023-2028) (%)
      • Data Table on Canada - Year-over-year growth (2023-2028) (%)
    • 12.15 Italy - Market size and forecast (2023-2028)
      • Chart on Italy - Market size and forecast (2023-2028) ($ million)
      • Data Table on Italy - Market size and forecast (2023-2028) ($ million)
      • Chart on Italy - Year-over-year growth (2023-2028) (%)
      • Data Table on Italy - Year-over-year growth (2023-2028) (%)
    • 12.16 France - Market size and forecast (2023-2028)
      • Chart on France - Market size and forecast (2023-2028) ($ million)
      • Data Table on France - Market size and forecast (2023-2028) ($ million)
      • Chart on France - Year-over-year growth (2023-2028) (%)
      • Data Table on France - Year-over-year growth (2023-2028) (%)
    • 12.17 Japan - Market size and forecast (2023-2028)
      • Chart on Japan - Market size and forecast (2023-2028) ($ million)
      • Data Table on Japan - Market size and forecast (2023-2028) ($ million)
      • Chart on Japan - Year-over-year growth (2023-2028) (%)
      • Data Table on Japan - Year-over-year growth (2023-2028) (%)
    • 12.18 Brazil - Market size and forecast (2023-2028)
      • Chart on Brazil - Market size and forecast (2023-2028) ($ million)
      • Data Table on Brazil - Market size and forecast (2023-2028) ($ million)
      • Chart on Brazil - Year-over-year growth (2023-2028) (%)
      • Data Table on Brazil - Year-over-year growth (2023-2028) (%)
    • 12.19 Egypt - Market size and forecast (2023-2028)
      • Chart on Egypt - Market size and forecast (2023-2028) ($ million)
      • Data Table on Egypt - Market size and forecast (2023-2028) ($ million)
      • Chart on Egypt - Year-over-year growth (2023-2028) (%)
      • Data Table on Egypt - Year-over-year growth (2023-2028) (%)
    • 12.20 UAE - Market size and forecast (2023-2028)
      • Chart on UAE - Market size and forecast (2023-2028) ($ million)
      • Data Table on UAE - Market size and forecast (2023-2028) ($ million)
      • Chart on UAE - Year-over-year growth (2023-2028) (%)
      • Data Table on UAE - Year-over-year growth (2023-2028) (%)
    • 12.21 Oman - Market size and forecast (2023-2028)
      • Chart on Oman - Market size and forecast (2023-2028) ($ million)
      • Data Table on Oman - Market size and forecast (2023-2028) ($ million)
      • Chart on Oman - Year-over-year growth (2023-2028) (%)
      • Data Table on Oman - Year-over-year growth (2023-2028) (%)
    • 12.22 Argentina - Market size and forecast (2023-2028)
      • Chart on Argentina - Market size and forecast (2023-2028) ($ million)
      • Data Table on Argentina - Market size and forecast (2023-2028) ($ million)
      • Chart on Argentina - Year-over-year growth (2023-2028) (%)
      • Data Table on Argentina - Year-over-year growth (2023-2028) (%)
    • 12.23 KSA - Market size and forecast (2023-2028)
      • Chart on KSA - Market size and forecast (2023-2028) ($ million)
      • Data Table on KSA - Market size and forecast (2023-2028) ($ million)
      • Chart on KSA - Year-over-year growth (2023-2028) (%)
      • Data Table on KSA - Year-over-year growth (2023-2028) (%)
    • 12.24 Rest of World (ROW) - Market size and forecast (2023-2028)
      • Chart on Rest of World (ROW) - Market size and forecast (2023-2028) ($ million)
      • Data Table on Rest of World (ROW) - Market size and forecast (2023-2028) ($ million)
      • Chart on Rest of World (ROW) - Year-over-year growth (2023-2028) (%)
      • Data Table on Rest of World (ROW) - Year-over-year growth (2023-2028) (%)

    13 Drivers, Challenges, and Opportunity/Restraints

    • 13.1 Market drivers
      • 13.2 Market challenges
        • 13.3 Impact of drivers and challenges
          • Impact of drivers and challenges in 2023 and 2028
        • 13.4 Market opportunities/restraints

          14 Competitive Landscape

          • 14.1 Overview
            • 14.2 Competitive Landscape
              • Overview on criticality of inputs and factors of differentiation
            • 14.3 Landscape disruption
              • Overview on factors of disruption
            • 14.4 Industry risks
              • Impact of key risks on business

            15 Competitive Analysis

            • 15.1 Companies profiled
              • Companies covered
            • 15.2 Market positioning of companies
              • Matrix on companies position and classification
            • 15.3 ABB Ltd.
              • ABB Ltd. - Overview
              • ABB Ltd. - Product / Service
              • ABB Ltd. - Key offerings
            • 15.4 Azbil Corp.
              • Azbil Corp. - Overview
              • Azbil Corp. - Product / Service
              • Azbil Corp. - Key offerings
            • 15.5 Badger Meter Inc.
              • Badger Meter Inc. - Overview
              • Badger Meter Inc. - Product / Service
              • Badger Meter Inc. - Key offerings
            • 15.6 Brooks Instrument
              • Brooks Instrument - Overview
              • Brooks Instrument - Product / Service
              • Brooks Instrument - Key offerings
            • 15.7 Emerson Electric Co.
              • Emerson Electric Co. - Overview
              • Emerson Electric Co. - Product / Service
              • Emerson Electric Co. - Key offerings
            • 15.8 Endress+Hauser AG
              • Endress+Hauser AG - Overview
              • Endress+Hauser AG - Product / Service
              • Endress+Hauser AG - Key offerings
            • 15.9 General Electric Co.
              • General Electric Co. - Overview
              • General Electric Co. - Product / Service
              • General Electric Co. - Key offerings
            • 15.10 Hitachi Ltd.
              • Hitachi Ltd. - Overview
              • Hitachi Ltd. - Product / Service
              • Hitachi Ltd. - Key offerings
            • 15.11 Honeywell International Inc.
              • Honeywell International Inc. - Overview
              • Honeywell International Inc. - Product / Service
              • Honeywell International Inc. - Key offerings
            • 15.12 Horiba Ltd.
              • Horiba Ltd. - Overview
              • Horiba Ltd. - Product / Service
              • Horiba Ltd. - Key offerings
            • 15.13 Invensys Ltd.
              • Invensys Ltd. - Overview
              • Invensys Ltd. - Product / Service
              • Invensys Ltd. - Key offerings
            • 15.14 KROHNE Messtechnik GmbH
              • KROHNE Messtechnik GmbH - Overview
              • KROHNE Messtechnik GmbH - Product / Service
              • KROHNE Messtechnik GmbH - Key offerings
            • 15.15 OMEGA Engineering Inc.
              • OMEGA Engineering Inc. - Overview
              • OMEGA Engineering Inc. - Product / Service
              • OMEGA Engineering Inc. - Key offerings
            • 15.16 Schneider Electric SE
              • Schneider Electric SE - Overview
              • Schneider Electric SE - Product / Service
              • Schneider Electric SE - Key offerings
            • 15.17 Siemens AG
              • Siemens AG - Overview
              • Siemens AG - Product / Service
              • Siemens AG - Key offerings
            • 15.18 Teledyne Technologies Inc.
              • Teledyne Technologies Inc. - Overview
              • Teledyne Technologies Inc. - Product / Service
              • Teledyne Technologies Inc. - Key offerings
            • 15.19 Tokyo Keiso Co. Ltd.
              • Tokyo Keiso Co. Ltd. - Overview
              • Tokyo Keiso Co. Ltd. - Product / Service
              • Tokyo Keiso Co. Ltd. - Key offerings
            • 15.20 Toshiba Corp.
              • Toshiba Corp. - Overview
              • Toshiba Corp. - Product / Service
              • Toshiba Corp. - Key offerings
            • 15.21 VSE Volumentechnik GmbH
              • VSE Volumentechnik GmbH - Overview
              • VSE Volumentechnik GmbH - Product / Service
              • VSE Volumentechnik GmbH - Key offerings
            • 15.22 Yokogawa Electric Corp.
              • Yokogawa Electric Corp. - Overview
              • Yokogawa Electric Corp. - Product / Service
              • Yokogawa Electric Corp. - Key offerings
            • 15.23 ABB Ltd.
              • ABB Ltd. - Overview
              • ABB Ltd. - Product / Service
              • ABB Ltd. - Key offerings
            • 15.24 Apator SA
              • Apator SA - Overview
              • Apator SA - Product / Service
              • Apator SA - Key offerings
            • 15.25 Azbil Corp.
              • Azbil Corp. - Overview
              • Azbil Corp. - Product / Service
              • Azbil Corp. - Key offerings
            • 15.26 Badger Meter Inc.
              • Badger Meter Inc. - Overview
              • Badger Meter Inc. - Product / Service
              • Badger Meter Inc. - Key offerings
            • 15.27 Electronet Equipments Pvt. Ltd.
              • Electronet Equipments Pvt. Ltd. - Overview
              • Electronet Equipments Pvt. Ltd. - Product / Service
              • Electronet Equipments Pvt. Ltd. - Key offerings
            • 15.28 Emerson Electric Co.
              • Emerson Electric Co. - Overview
              • Emerson Electric Co. - Product / Service
              • Emerson Electric Co. - Key offerings
            • 15.29 Endress Hauser Group Services AG
              • Endress Hauser Group Services AG - Overview
              • Endress Hauser Group Services AG - Product / Service
              • Endress Hauser Group Services AG - Key offerings
            • 15.30 Forbes Marshall Pvt. Ltd.
              • Forbes Marshall Pvt. Ltd. - Overview
              • Forbes Marshall Pvt. Ltd. - Product / Service
              • Forbes Marshall Pvt. Ltd. - Key offerings
            • 15.31 General Electric Co.
              • General Electric Co. - Overview
              • General Electric Co. - Product / Service
              • General Electric Co. - Key offerings
            • 15.32 Honeywell International Inc.
              • Honeywell International Inc. - Overview
              • Honeywell International Inc. - Product / Service
              • Honeywell International Inc. - Key offerings
            • 15.33 KROHNE Messtechnik GmbH
              • KROHNE Messtechnik GmbH - Overview
              • KROHNE Messtechnik GmbH - Product / Service
              • KROHNE Messtechnik GmbH - Key offerings
            • 15.34 Landis Gyr AG
              • Landis Gyr AG - Overview
              • Landis Gyr AG - Product / Service
              • Landis Gyr AG - Key offerings
            • 15.35 Max Machinery Inc.
              • Max Machinery Inc. - Overview
              • Max Machinery Inc. - Product / Service
              • Max Machinery Inc. - Key offerings
            • 15.36 Omega Engineering Inc.
              • Omega Engineering Inc. - Overview
              • Omega Engineering Inc. - Product / Service
              • Omega Engineering Inc. - Key offerings
            • 15.37 Osaki Electric Co. Ltd.
              • Osaki Electric Co. Ltd. - Overview
              • Osaki Electric Co. Ltd. - Product / Service
              • Osaki Electric Co. Ltd. - Key offerings
            • 15.38 Schneider Electric SE
              • Schneider Electric SE - Overview
              • Schneider Electric SE - Product / Service
              • Schneider Electric SE - Key offerings
            • 15.39 SICK AG
              • SICK AG - Overview
              • SICK AG - Product / Service
              • SICK AG - Key offerings
            • 15.40 Siemens AG
              • Siemens AG - Overview
              • Siemens AG - Product / Service
              • Siemens AG - Key offerings
            • 15.41 Toshiba Corp.
              • Toshiba Corp. - Overview
              • Toshiba Corp. - Product / Service
              • Toshiba Corp. - Key offerings
            • 15.42 Yokogawa Electric Corp.
              • Yokogawa Electric Corp. - Overview
              • Yokogawa Electric Corp. - Product / Service
              • Yokogawa Electric Corp. - Key offerings

            16 Appendix

            • 16.1 Scope of the report
              • 16.2 Inclusions and exclusions checklist
                • Inclusions checklist
                • Exclusions checklist
              • 16.3 Currency conversion rates for US$
                • Currency conversion rates for US$
              • 16.4 Research methodology
                • Research methodology
              • 16.5 Data procurement
                • Information sources
              • 16.6 Data validation
                • Data validation
              • 16.7 Validation techniques employed for market sizing
                • Validation techniques employed for market sizing
              • 16.8 Data synthesis
                • Data synthesis
              • 16.9 360 degree market analysis
                • 360 degree market analysis
              • 16.10 List of abbreviations
                • List of abbreviations

              Research Methodology

              Technavio presents a detailed picture of the market by way of study, synthesis, and summation of data from multiple sources. The analysts have presented the various facets of the market with a particular focus on identifying the key industry influencers. The data thus presented is comprehensive, reliable, and the result of extensive research, both primary and secondary.

              INFORMATION SOURCES

              Primary sources

              • Manufacturers and suppliers
              • Channel partners
              • Industry experts
              • Strategic decision makers

              Secondary sources

              • Industry journals and periodicals
              • Government data
              • Financial reports of key industry players
              • Historical data
              • Press releases

              DATA ANALYSIS

              Data Synthesis

              • Collation of data
              • Estimation of key figures
              • Analysis of derived insights

              Data Validation

              • Triangulation with data models
              • Reference against proprietary databases
              • Corroboration with industry experts

              REPORT WRITING

              Qualitative

              • Market drivers
              • Market challenges
              • Market trends
              • Five forces analysis

              Quantitative

              • Market size and forecast
              • Market segmentation
              • Geographical insights
              • Competitive landscape

              Interested in this report?

              Get your sample now to see our research methodology and insights!

              Download Now

              Frequently Asked Questions

              Flow Meter market growth will increase by $ 3025.6 mn during 2024-2028.

              The Flow Meter market is expected to grow at a CAGR of 5.98% during 2024-2028.

              Flow Meter market is segmented by End-user( Industrial, Commercial, Residential) Technology Type( Ultrasonic, Magnetic, Coriolis, Vortex, MEA)

              ABB Ltd., Azbil Corp., Badger Meter Inc., Brooks Instrument, Emerson Electric Co., Endress+Hauser AG, General Electric Co., Hitachi Ltd., Honeywell International Inc., Horiba Ltd., Invensys Ltd., KROHNE Messtechnik GmbH, OMEGA Engineering Inc., Schneider Electric SE, Siemens AG, Teledyne Technologies Inc., Tokyo Keiso Co. Ltd., Toshiba Corp., VSE Volumentechnik GmbH, Yokogawa Electric Corp. are a few of the key vendors in the Flow Meter market.

              APAC will register the highest growth rate of 29% among the other regions. Therefore, the Flow Meter market in APAC is expected to garner significant business opportunities for the vendors during the forecast period.

              US, Canada, Germany, UK, Italy, France, China, India, Japan, Brazil, Egypt, UAE, Oman, Argentina, KSA, UAE, Brazil, Rest of World (ROW)

              • Rising awareness on benefits associated with flow metersOne of the key drivers of the growth of the global flow meter market is the benefits associated with flow meters in different end-user industries. Flow meters are also used for educational purposes in university science and engineering programs. They are also used in housing projects to track the amount of water used.Engineers have created liquid flow meters that can withstand extreme variables such as outdoor temperature and pressure regardless of weather conditions and give accurate results. The use of flow meters provides benefits besides measurements is the driving factor this market.
              • such as in helping to control the velocity of fluids and their use. It can also save water from being wasted by detecting leakage in pipes.Some key benefits of flow meters are given below:Coriolis flow meterMeasure mass flow is the driving factor this market.
              • liquid density is the driving factor this market.
              • and temperatureHave the additional measuring capability of density and temperatureAllow the bi-directional flow of liquidsSet measuring range according to flow rate and densityUltrasonic flow meterMeasure both liquids and gasesLow maintenanceNo extra pressure dropsConcentration is the driving factor this market.
              • temperature is the driving factor this market.
              • and density do not affect transit time metersNo obstructed flow channelElectromagnetic flow meterNot constrained by Reynolds number or flow profilesWithstand changes in density is the driving factor this market.
              • viscosity is the driving factor this market.
              • temperature is the driving factor this market.
              • and electrical conductivityNot affected by contamination of liquidsEasy to maintain with a low maintenance costCapable of operating in both directionsThus is the driving factor this market.
              • the benefits associated with flow meters will boost the growth of the global flow meter market during the forecast period. is the driving factor this market.

              The Flow Meter market vendors should focus on grabbing business opportunities from the Industrial segment as it accounted for the largest market share in the base year.
              RIA - Research AI Assistant
              Ask RIA