
Pressure Sensors Market Size 2024-2028
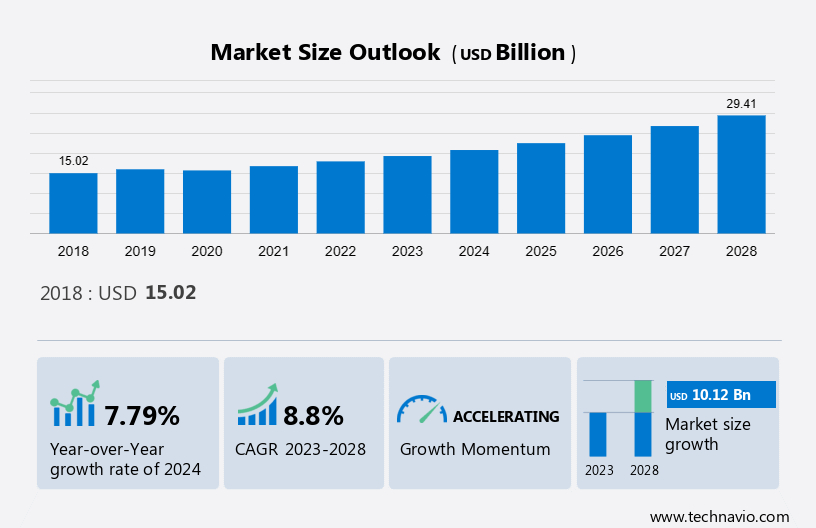
The pressure sensors market size is forecast to increase by USD 10.12 billion at a CAGR of 8.8% between 2023 and 2028. The market is witnessing significant growth due to the advancements in sensor technologies, leading to the emergence of combination sensors that can measure both gases and liquids. These sensors offer improved accuracy and reliability, making them ideal for various industries such as automotive, oil and gas, and healthcare. Pressure sensors come in various types, including pressure transducers, pressure transmitters, pressure indicators, piezometers, manometers, and others. The electrical output signal from these sensors can be analog or digital, with different pressure sensitive elements such as piezoresistive, capacitive, and electromagnetic being used. However, challenges persist in the market, including concerns associated with interference and cross-sensitivity, which require ongoing research and development efforts to mitigate their impact. Electronic components play a crucial role in enhancing the performance of pressure sensors, enabling them to meet the evolving demands of various end-users.
Pressure sensors play a crucial role in various industries, including household appliances, automotive, and wearable devices. In household appliances, pressure sensors are used in washing machines and refrigerators to monitor and maintain optimal operating conditions. In the automotive sector, they are essential components in Tire Pressure Monitoring Systems (TPMS) and airbag systems, ensuring passenger safety by monitoring the physical quantity of pressure in tires and gas bags. The light vehicle markets, including electric cars, are witnessing significant growth in the adoption of pressure sensors. These sensors are used in braking systems, cooling systems, and fuel systems to ensure efficient performance and safety.
Moreover, inductive technology and photoelectric technology are commonly used in pressure sensors due to their high accuracy and reliability. Differential pressure sensors are widely used in various industries to measure the difference in pressure between two points. These sensors convert mechanical pressure from gases or liquids into electrical signals, which are then used as inputs for various control systems. The material and environmental characteristics of pressure sensors are critical factors in their design and functionality. Overall, The market is expected to grow significantly due to the increasing demand for efficient and reliable pressure sensing solutions in various applications.
Market Segmentation
The market research report provides comprehensive data (region-wise segment analysis), with forecasts and estimates in "USD billion" for the period 2024-2028, as well as historical data from 2018-2022 for the following segments.
- Type
- Wired
- Wireless
- Product
- Absolute pressure sensors
- Differential pressure sensors
- Gauge pressure sensors
- Others
- Geography
- APAC
- China
- Japan
- North America
- US
- Europe
- Germany
- UK
- South America
- Middle East and Africa
- APAC
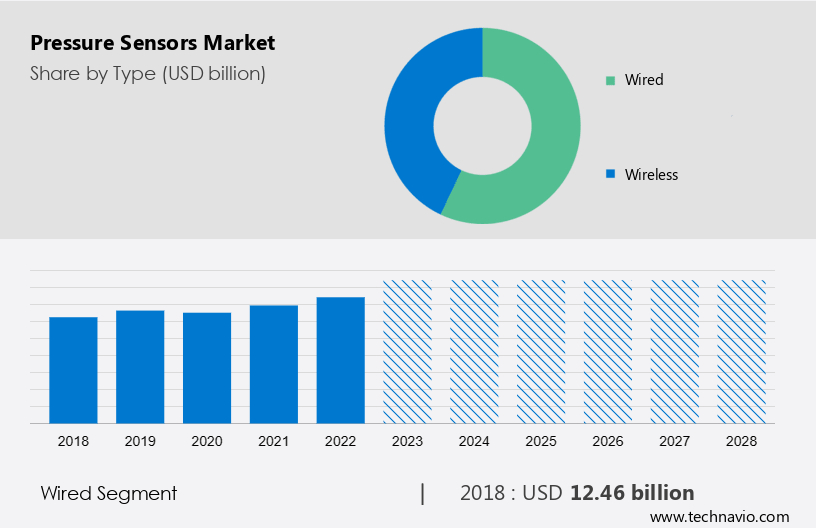
By Type Insights
The wired segment is estimated to witness significant growth during the forecast period. Wired pressure sensors are essential components in industrial automation, providing real-time pressure data for process control and monitoring. These sensors play a significant role in various industries, including manufacturing and oil and gas, by ensuring optimal operating conditions. In manufacturing environments, wired pressure sensors are utilized to monitor and control processes, enhancing efficiency and precision. The automotive industry also benefits from the use of wired pressure sensors in manufacturing applications. The oil and gas sector heavily relies on these sensors for monitoring pipeline pressure, reservoir management, and other critical applications. The expansion of the oil and gas industry fuels the demand for advanced pressure sensing solutions.
Moreover, wired pressure sensors come in various types, such as pressure transducers, pressure transmitters, pressure indicators, piezometers, manometers, and others. These sensors employ different sensing technologies, including piezoresistive, capacitive, and electromagnetic, to convert pressure into an electrical output signal. The electrical output signal can be analog or digital, depending on the specific application requirements. The use of wired pressure sensors in industrial processes offers numerous advantages, including high accuracy, reliability, and strength, making them indispensable in modern industrial automation systems.
Get a glance at the market share of various segments Request Free Sample
The wired segment was valued at USD 12.46 billion in 2018 and showed a gradual increase during the forecast period.
Regional Insights
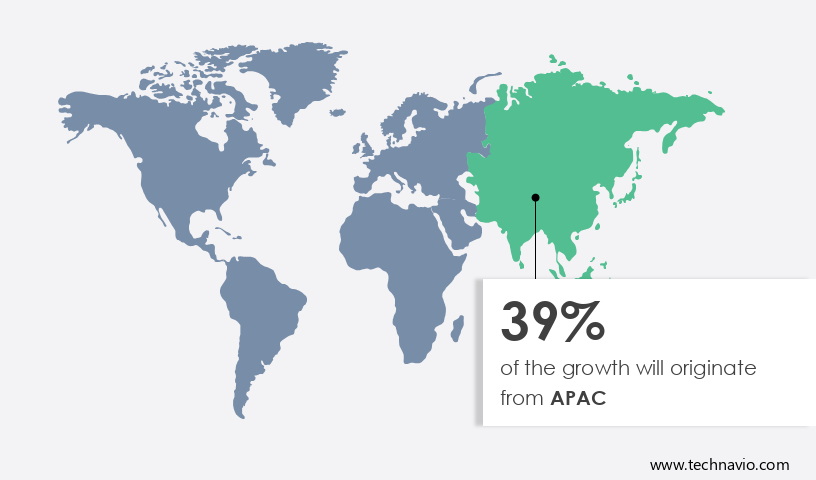
APAC is estimated to contribute 39% to the growth of the global market during the forecast period. Technavio's analysts have elaborately explained the regional trends and drivers that shape the market during the forecast period.
For more insights on the market share of various regions Request Free Sample
The global market for pressure sensors has experienced significant growth due to the increasing demand in various industries, particularly in the automotive, electronics, and manufacturing sectors. This expansion is driven by the rapid industrial automation in countries such as China, Japan, South Korea, and India. Pressure sensors are essential components in monitoring and controlling processes, and their applications include tire pressure monitoring systems (TPMS), engine control systems, fuel systems, and more. The automotive industry in the Asia Pacific (APAC) region, specifically in China and India, is experiencing rapid growth, leading to a growth in demand for pressure sensors. Furthermore, the increasing popularity of consumer electronics and smart devices in APAC is fueling the demand for pressure sensors in various applications.
Moreover, pressure sensors come in various types, including pressure transducers, pressure transmitters, pressure indicators, piezometers, manometers, and others. These sensors employ different technologies, such as piezoresistive, capacitive, and electromagnetic, to generate electrical output signals in response to the pressure of gases and liquids.
Our pressure sensors market researchers analyzed the data with 2023 as the base year, along with the key drivers, trends, and challenges. A holistic analysis of drivers will help companies refine their marketing strategies to gain a competitive advantage.
Market Driver
The advancements in sensor technologies is the key driver of the market. Pressure sensors, a crucial component in measuring physical quantities such as mechanical pressure and gases, have witnessed significant advancements due to the integration of Silicon Microstructures through Micro-electro-mechanical systems (MEMS) technology. MEMS pressure sensors, recognized for their miniaturized size, low power consumption, and cost-effectiveness, have permeated various sectors including consumer electronics, automotive, and industrial applications. Exhaust Gas Recirculation systems in automobiles and TPMS (Tire Pressure Monitoring Systems) are prime examples of MEMS pressure sensors' utilization. In the petrochemical industry, these sensors play a vital role in process control and safety. The medical industry also benefits from pressure sensors in medical devices and wearables.
Further, these sensors are evolving to become more intelligent, featuring embedded microcontrollers and communication capabilities, enabling integration into IoT ecosystems for real-time data collection, analysis, and communication. Optical and acoustic pressure sensing technologies offer alternative methods for traditional pressure sensing applications. With continuous advancements in material science and sensor design, the future of pressure sensors looks promising.
Market Trends
The emergence of combination sensors is the upcoming trend in the market. Pressure sensors, which measure physical quantities related to mechanical pressure or gases, play a crucial role in various industries, including the petrochemical industry, automotive, and medical sector. These sensors, often fabricated using advanced silicon microstructures, convert input pressures into electrical signals for further analysis. In the automotive industry, pressure sensors are integral components of the TPMS (Tire Pressure Monitoring System) and Exhaust Gas Recirculation systems. In the medical industry, pressure sensors are employed in medical equipment such as blood pressure monitors and respiratory devices. Combination sensors, which integrate pressure sensing capabilities with other sensor types like temperature, humidity, and gas sensors, expand the application scope of pressure sensors.
For instance, integrating pressure and temperature sensors in HVAC systems ensures efficient energy management and improved system performance. In environmental monitoring, pressure and gas sensors, in combination, offer a comprehensive solution for assessing air quality and ensuring industrial safety. These sensors' environmental characteristics and material selection are critical factors in their successful implementation.
Market Challenge
The concerns associated with interference and cross-sensitivity is a key challenge affecting market growth. Pressure sensors play a crucial role in measuring physical quantities such as mechanical pressure and gases in various industries, including the petrochemical sector and medical field. Silicon microstructures are commonly used in the manufacturing of these sensors due to their durability and precision. However, these sensors are subjected to environmental characteristics that can impact their performance. Changes in temperature can lead to thermal expansion or contraction, affecting sensitivity. Humidity and moisture can influence pressure sensor readings, particularly in applications with exposure to fluctuating moisture levels. In industrial settings or applications with high levels of vibration, pressure sensors may experience interference, which can affect their accuracy.
However, mechanical stress and sudden shocks or impacts can cause physical damage, leading to calibration issues and increased sensitivity to environmental changes. Additionally, electromagnetic interference from electronic devices or radiofrequency sources can impact sensor signals and inputs, acting as an unwanted transducer. Therefore, it is essential to consider these environmental factors when selecting and implementing pressure sensors in various applications.
Exclusive Customer Landscape
The market forecasting report includes the adoption lifecycle of the market, covering from the innovator's stage to the laggard's stage. It focuses on adoption rates in different regions based on penetration. Furthermore, the report also includes key purchase criteria and drivers of price sensitivity to help companies evaluate and develop their market growth analysis strategies.

Customer Landscape
Key Companies & Market Insights
Companies are implementing various strategies, such as strategic alliances, partnerships, mergers and acquisitions, geographical expansion, and product/service launches, to enhance their presence in the market.
Avnet Inc. - The company offers pressure sensors such as NPA 500B 005G, MPXM2102AS, and MPXHZ6250AC6T1.
The market research and growth report includes detailed analyses of the competitive landscape of the market and information about key companies, including:
- Balluff GmbH
- DENSO Corp.
- General Electric Co.
- Glamox Group
- GlobalSpec LLC
- Infineon Technologies AG
- Melexis NV
- MICRO SENSOR CO. LTD.
- Millar Inc.
- NXP Semiconductors NV
- OMRON Corp.
- Questex Media Group LLC
- Robert Bosch GmbH
- Schneider Electric SE
- Sensata Technologies Inc.
- STMicroelectronics International N.V.
- TDK Corp.
- TE Connectivity Ltd.
- Texas Instruments Inc.
- Zhengzhou Winsen Electronics Technology Co. Ltd.
Qualitative and quantitative analysis of companies has been conducted to help clients understand the wider business environment as well as the strengths and weaknesses of key market players. Data is qualitatively analyzed to categorize companies as pure play, category-focused, industry-focused, and diversified; it is quantitatively analyzed to categorize companies as dominant, leading, strong, tentative, and weak.
Research Analyst Overview
Pressure sensors are essential components used to measure and monitor physical quantities such as mechanical pressure in gases and liquids. These sensors play a crucial role in various industries, including household appliances, automotive, and medical, among others. In household appliances, pressure sensors are used in washing machines and refrigerators for efficient operation. In the automotive sector, they are employed in tire pressure monitoring systems (TPMS), braking systems, cooling systems, fuel systems, and automotive safety regulations like passenger airbags and side airbags. The technological transformation in the automotive industry, driven by the adoption of electric vehicles (EVs), self-driving cars, and hybrid vehicles, is leading to supplier expansion strategies.
Moreover, pressure sensors find applications in electric cars, Luna, and exhaust gas recirculation systems. In the petrochemical industry, they are used in various processes to monitor and control pressure. Pressure sensors come in various types, including differential pressure sensors, piezoresistive pressure sensors, and sensors based on inductive technology, photoelectric technology, and electromagnetic pressure sensors. The market for pressure sensors is expected to grow due to increasing demand from automotive applications, medical applications, consumer goods, and industrial industry. The integration of cyber-physical systems, cloud robotics, and cloud computing in various applications is also driving the market growth. Pressure sensors convert mechanical pressure into electrical output signals using a pressure-sensitive element.
In conclusion, they are essential components in various applications, including medical wearables, consumer electronics, the aviation industry, and smart packaging solutions. The increasing use of wireless sensors, Bluetooth connectivity, and smart appliances, homes, cars, and clothing is also boosting the market. However, price erosion due to the increasing competition and the emergence of new technologies may pose a challenge to market growth.
|
Market Scope |
|
|
Report Coverage |
Details |
|
Page number |
166 |
|
Base year |
2023 |
|
Historic period |
2018-2022 |
|
Forecast period |
2024-2028 |
|
Growth momentum & CAGR |
Accelerate at a CAGR of 8.8% |
|
Market growth 2024-2028 |
USD 10.12 billion |
|
Market structure |
Fragmented |
|
YoY growth 2023-2024(%) |
7.79 |
|
Regional analysis |
APAC, North America, Europe, South America, and Middle East and Africa |
|
Performing market contribution |
APAC at 39% |
|
Key countries |
US, China, Japan, Germany, and UK |
|
Competitive landscape |
Leading Companies, Market Positioning of Companies, Competitive Strategies, and Industry Risks |
|
Key companies profiled |
Avnet Inc., Balluff GmbH, DENSO Corp., General Electric Co., Glamox Group, GlobalSpec LLC, Infineon Technologies AG, Melexis NV, MICRO SENSOR CO. LTD., Millar Inc., NXP Semiconductors NV, OMRON Corp., Questex Media Group LLC, Robert Bosch GmbH, Schneider Electric SE, Sensata Technologies Inc., STMicroelectronics International N.V., TDK Corp., TE Connectivity Ltd., Texas Instruments Inc., and Zhengzhou Winsen Electronics Technology Co. Ltd. |
|
Market dynamics |
Parent market analysis, market growth inducers and obstacles, market forecast, fast-growing and slow-growing segment analysis, COVID-19 impact and recovery analysis and future consumer dynamics, market condition analysis for the forecast period |
|
Customization purview |
If our market report has not included the data that you are looking for, you can reach out to our analysts and get segments customized. |
What are the Key Data Covered in this Market Research and Growth Report?
- CAGR of the market during the forecast period
- Detailed information on factors that will drive the market growth and forecasting between 2024 and 2028
- Precise estimation of the size of the market and its contribution of the market in focus to the parent market
- Accurate predictions about upcoming market growth and trends and changes in consumer behaviour
- Growth of the market across APAC, North America, Europe, South America, and Middle East and Africa
- Thorough analysis of the market's competitive landscape and detailed information about companies
- Comprehensive analysis of factors that will challenge the growth of market companies
We can help! Our analysts can customize this market research report to meet your requirements. Get in touch
 RIA -
RIA - 
