Food And Beverage Warehousing Market Size 2025-2029
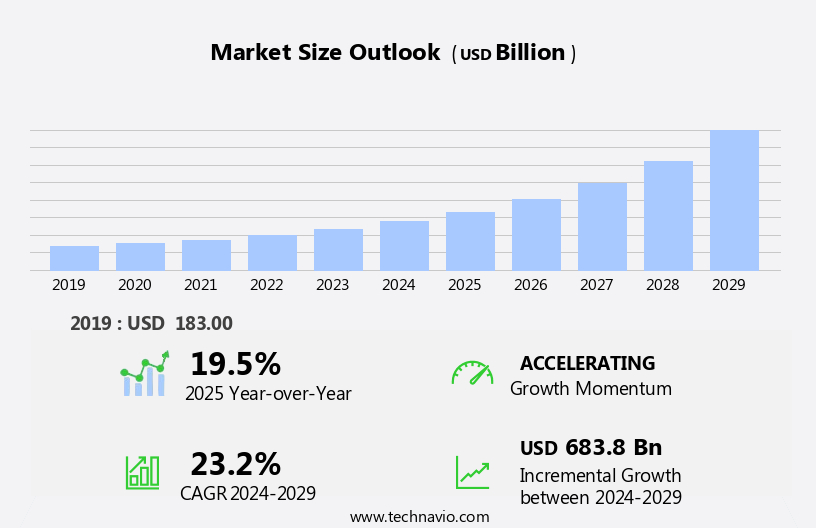
The food and beverage warehousing market size is forecast to increase by USD 683.8 billion at a CAGR of 23.2% between 2024 and 2029.
- The Food and Beverage (F&B) warehousing market is experiencing significant growth due to the increasing demand for food delivery services and the adoption of automation technologies. Automated Storage and Retrieval Systems (ASRS) and robotics are becoming increasingly popular in F&B warehousing, enabling efficient handling of pallets and reducing labor costs. Public warehousing is also gaining traction, providing cost-effective solutions for businesses with seasonal or fluctuating inventory needs. Key trends In the F&B warehousing market include the implementation of LED lighting, warehouse management systems (WMS), and renewable energy sources to minimize energy consumption. Frozen desserts, confectionery, and seafood require specialized cold storage facilities, driving the demand for advanced temperature control systems.
What will be the Size of the Food And Beverage Warehousing Market During the Forecast Period?

Request Free Sample
- The market encompasses the storage and handling of finished goods, including meat, fish & seafood, dairy & frozen desserts, vegetables, grains, beverages, and other perishable and temperature-sensitive items. This market is a critical component of the food supply chain, ensuring timely delivery and inventory management for businesses and consumers. Market dynamics are influenced by several factors. Monetary policy tightening can impact storage costs and the availability of financing for warehousing operations. Climate disasters and other supply chain disruptions can affect inventory levels and product traceability, necessitating the need for resilient warehousing solutions. Perishability and temperature sensitivity are significant considerations in food and beverage warehousing.
- Refrigeration and stock keeping units play essential roles in maintaining freshness and product quality. Processing factories and warehouses must adhere to stringent regulations to ensure supply chain transparency and food safety. The market is a substantial and growing sector, driven by increasing consumer demand for fresh and diverse food offerings. Disinflation and economic conditions can impact pricing and demand for warehousing services. Overall, the market is expected to continue evolving to meet the demands of a dynamic and complex food supply chain.
How is this Food And Beverage Warehousing Industry segmented and which is the largest segment?
The food and beverage warehousing industry research report provides comprehensive data (region-wise segment analysis), with forecasts and estimates in "USD billion" for the period 2025-2029, as well as historical data from 2019-2023 for the following segments.
- Application
- Meat/ fish/ seafood
- Dairy and frozen desserts
- Bakery/ confectionery/ beverages
- Fruits and vegetables
- Others
- End-user
- Processing factories
- Distributors
- Retailers
- Type
- Technology
- Fully automated
- Semi-automated
- Manual
- Geography
- North America
- Europe
- APAC
- China
- India
- Japan
- South Korea
- South America
- Middle East and Africa
By Application Insights
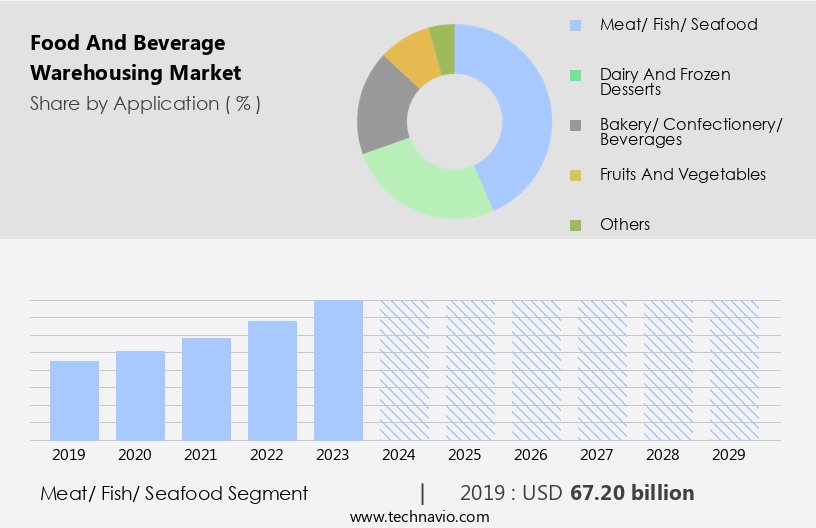
- The meat/ fish/ seafood segment is estimated to witness significant growth during the forecast period.
The market encompasses the storage and handling of finished goods, including meat, fish, seafood, dairy and frozen desserts, beverages, fruits, vegetables, grains, and processed food products. Due to the perishable nature of many food items, temperature-controlled storage, such as cold storage facilities and refrigerated warehousing services, is essential. The meat, fish, and seafood segment is anticipated to expand due to rising global demand and the need for temperature-sensitive storage. Perishability and temperature sensitivity are critical factors in food warehousing, necessitating advanced refrigeration technologies and stringent inventory management. E-commerce growth and the increasing popularity of meal preparation kits have also boosted the market.

Get a glance at the Food And Beverage Warehousing Industry report of share of various segments Request Free Sample
The meat/ fish/ seafood segment was valued at USD 67.20 billion in 2019 and showed a gradual increase during the forecast period.
Regional Analysis
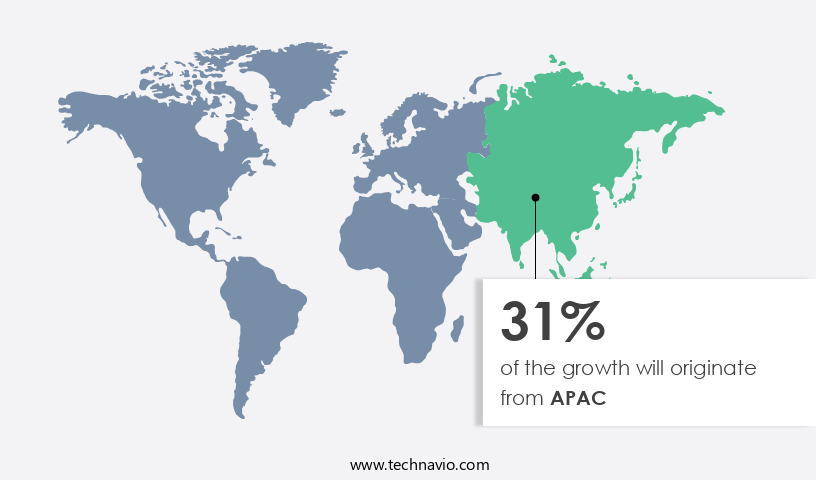
- APAC is estimated to contribute 31% to the growth of the global market during the forecast period.
Technavio's analysts have elaborately explained the regional trends and drivers that shape the market during the forecast period.

For more insights on the market share of various regions, Request Free Sample
The North American market is characterized by a mature and sizeable industry, with the United States leading the market due to its large consumer base, high disposable income, and the presence of key players. Effective private-and-public partnerships further bolster the market's growth. The increasing demand for perishable items, such as meat, fish & seafood, dairy & frozen desserts, fruits, and vegetables, is driving the market's expansion. Cold storage facilities and temperature-controlled warehouses are essential for maintaining the freshness and product traceability of these temperature-sensitive and perishable goods. E-commerce and the growing popularity of meal preparation kits are also contributing to the market's growth.
Market Dynamics
Our researchers analyzed the data with 2024 as the base year, along with the key drivers, trends, and challenges. A holistic analysis of drivers will help companies refine their marketing strategies to gain a competitive advantage.
What are the key market drivers leading to the rise In the adoption of Food And Beverage Warehousing Industry?
Demand for warehouse automation is the key driver of the market.
- In the food and beverages industry, retailers and wholesalers prioritize productivity and cost-effectiveness In their supply chain operations. Perishability and temperature sensitivity are significant factors, as many products, such as meat, fish and seafood, dairy and frozen desserts, beverages, fruits, vegetables, grains, and processed food products, require temperature-controlled storage and timely delivery to maintain freshness. Seasonal sales of certain products necessitate additional labor. Manual management of slow-moving items consumes valuable storage space. These challenges have led warehousing firms to explore automation solutions. Temperature-controlled facilities, including cold storage and refrigerated warehousing services, play a crucial role in preserving the quality of perishable goods.
- E-commerce growth and the increasing popularity of meal preparation kits further prioritize the importance of efficient inventory management and product traceability. Monetary policy tightening and climate disasters can impact the food supply chain, making it essential for warehousing providers to adapt to market dynamics and mitigate risks associated with disinflation and temperature sensitivity.
What are the market trends shaping the Food And Beverage Warehousing Industry?
Business strategies adopted by companies is the upcoming market trend.
- The market experiences growth due to several market dynamics. Companies are expanding their warehouse facilities and investing in advanced technologies for temperature-controlled storage, particularly for perishable items like meat, fish & seafood, dairy & frozen desserts, fruits, vegetables, and beverages. This ensures the preservation of freshness and product traceability. In addition, e-commerce sales of meal preparation kits and processed food products have increased, increasing the demand for efficient and reliable warehousing services. Monetary policy tightening and climate disasters pose challenges to the market, but the industry remains resilient. Temperature sensitivity and perishability necessitate the use of refrigeration and cold storage facilities.
- Partnerships with retailers and stock keeping units are essential for companies to expand their business and distribution networks. For instance, Americold Realty Trust recently announced plans to develop a new Import-Export Hub in Canada, demonstrating the strategic expansion of warehousing facilities to cater to global demand.
What challenges does the Food And Beverage Warehousing Industry face during its growth?
Power consumption in cold storage is a key challenge affecting the industry growth.
- The market experiences significant growth due to the increasing demand for finished goods, particularly In the sectors of meat, fish and seafood, dairy and frozen desserts, bakery, confectionery, fruits, vegetables, grains, and beverages. To meet this demand, warehousing companies are expanding their cold storage facilities, which are essential for preserving the freshness and perishability of these products. Temperature-sensitivity and climate disasters pose challenges to this market, necessitating temperature-controlled storage solutions. E-commerce and retailers also contribute to the market's growth by requiring efficient inventory management and product traceability. Rainbow pallets and meal preparation kits further boost demand for warehousing services.
- However, energy consumption and labor requirements are significant concerns for market participants. Energy efficiency can be improved through the use of Variable Frequency Drives (VFDs) in refrigeration systems. Monetary policy tightening and disinflation may impact the market's growth, but the overall outlook remains positive. Temperature-controlled warehousing services are crucial In the food supply chain, ensuring the timely and safe delivery of perishable goods from processing factories to retailers. Meat exports also contribute to the market's expansion.
Exclusive Customer Landscape
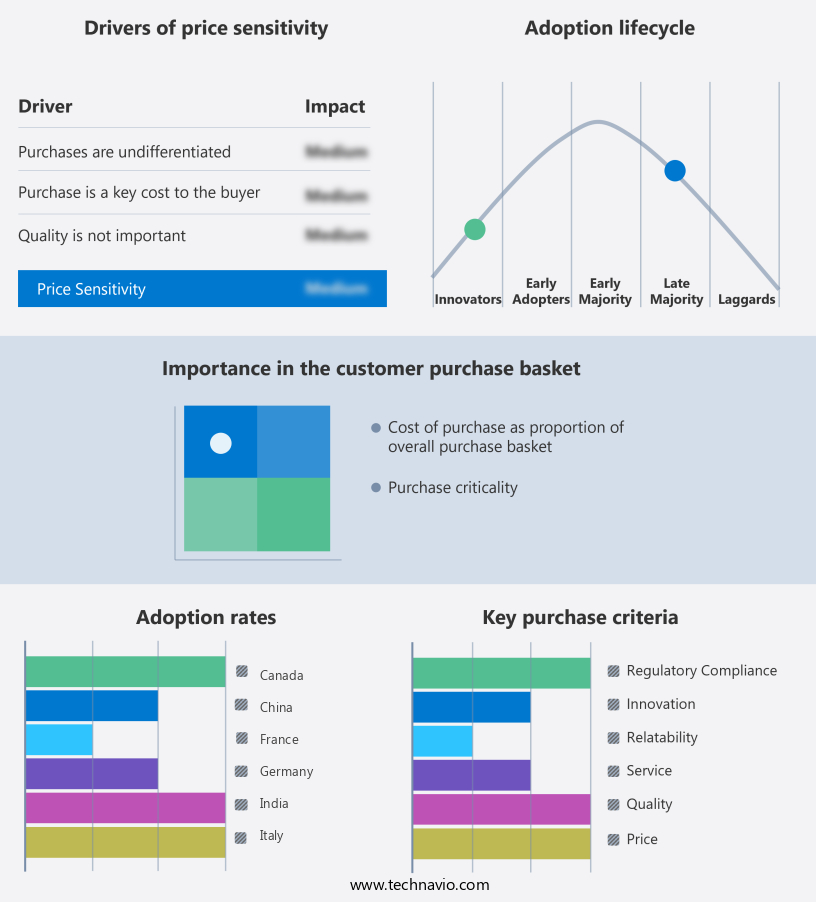
The food and beverage warehousing market forecasting report includes the adoption lifecycle of the market, covering from the innovator's stage to the laggard's stage. It focuses on adoption rates in different regions based on penetration. Furthermore, the food and beverage warehousing market report also includes key purchase criteria and drivers of price sensitivity to help companies evaluate and develop their market growth analysis strategies.

Customer Landscape
Key Companies & Market Insights
Companies are implementing various strategies, such as strategic alliances, food and beverage warehousing market forecast, partnerships, mergers and acquisitions, geographical expansion, and product/service launches, to enhance their presence In the industry.
Agility Public Warehousing Co. K.S.C.P - The company offers food and beverage warehousing through AC or Freezer logistics infrastructure and storage facilities for retail businesses.
The industry research and growth report includes detailed analyses of the competitive landscape of the market and information about key companies, including:
- Ahearn and Soper Inc.
- AIT Worldwide Logistics Inc.
- Amazon.com Inc.
- Americold Realty Trust Inc.
- Burris Logistics Co.
- Cargo partner GmbH
- Conestoga Cold Storage
- Congebec Logistics Inc.
- Lineage Logistics Holdings LLC
- Net Logistik S.A. de C.V
- Nichirei Corp.
- Penske Corp.
- Ryder System Inc.
- Snowman Logistics Limited
- Toyota Industries Corp.
- United States Cold Storage
- VersaCold Logistics Services
- Walmart Inc.
- Warehousing Express Logistics Pvt. Ltd.
Qualitative and quantitative analysis of companies has been conducted to help clients understand the wider business environment as well as the strengths and weaknesses of key industry players. Data is qualitatively analyzed to categorize companies as pure play, category-focused, industry-focused, and diversified; it is quantitatively analyzed to categorize companies as dominant, leading, strong, tentative, and weak.
Research Analyst Overview
The market plays a crucial role in ensuring the smooth functioning of the global food supply chain. With an increasing focus on product traceability and freshness, warehousing solutions have evolved to cater to the unique requirements of perishable foods and temperature-sensitive beverages. Finished goods storage is a vital aspect of the food and beverage warehousing industry. These facilities provide temperature-controlled environments to maintain the quality and freshness of various product categories, including meat, fish and seafood, dairy and frozen desserts, bakery and confectionery, fruits and vegetables, grains, and beverages. The use of advanced refrigeration technologies and climate control systems enables the preservation of perishable items, thereby reducing wastage and ensuring timely delivery to retailers.
In addition, e-commerce has significantly impacted the food and beverage warehousing sector, leading to the growth of specialized services focused on meal preparation kits and rainbow pallets. Meal preparation kits require specific handling and storage conditions to maintain the quality of ingredients, while rainbow pallets offer space-efficient storage solutions for a diverse range of products. The market is influenced by several factors. Monetary policy tightening can increase operational costs for warehousing providers, leading to potential price increases for their services. Climate disasters and other unforeseen events can disrupt supply chains, necessitating alternative warehousing solutions. Disinflation, on the other hand, can lead to decreased demand for warehousing services as producers may choose to reduce inventory levels.
Moreover, temperature sensitivity and perishability are key considerations In the market. Cold storage facilities have gained popularity due to their ability to maintain low temperatures, ensuring the preservation of perishable items such as meat, fish, and dairy products. Processing factories also rely on temperature-controlled storage to maintain the quality of their raw materials and finished goods. Meat exports and fish and seafood are significant contributors to the market. These products require specialized handling and storage conditions to maintain their quality and freshness during transportation and warehousing. Refrigerated warehousing services are essential for ensuring the timely and efficient handling of these commodities.
Therefore, the market plays a critical role in the global food supply chain by providing temperature-controlled storage solutions for perishable items and temperature-sensitive beverages. Factors such as monetary policy, climate disasters, and disinflation influence the market dynamics, necessitating adaptability and innovation from warehousing providers. The industry continues to evolve, with a focus on e-commerce, meal preparation kits, and space-efficient storage solutions.
|
Market Scope
|
|
Report Coverage
|
Details
|
|
Page number
|
245
|
|
Base year
|
2024
|
|
Historic period
|
2019-2023 |
|
Forecast period
|
2025-2029
|
|
Growth momentum & CAGR
|
Accelerate at a CAGR of 23.2%
|
|
Market growth 2025-2029
|
USD 683.8 billion
|
|
Market structure
|
Fragmented
|
|
YoY growth 2024-2025(%)
|
19.5
|
|
Key countries
|
US, Canada, Germany, UK, France, Italy, South Korea, China, Japan, and India
|
|
Competitive landscape
|
Leading Companies, market growth and forecasting , Market Positioning of Companies, Competitive Strategies, and Industry Risks
|
Request Free Sample
What are the Key Data Covered in this Food And Beverage Warehousing Market Research and Growth Report?
- CAGR of the Food And Beverage Warehousing industry during the forecast period
- Detailed information on factors that will drive the growth and forecasting between 2025 and 2029
- Precise estimation of the size of the market and its contribution of the industry in focus to the parent market
- Accurate predictions about upcoming growth and trends and changes in consumer behaviour
- Growth of the market across North America, Europe, APAC, South America, and Middle East and Africa
- Thorough analysis of the market's competitive landscape and detailed information about companies
- Comprehensive analysis of factors that will challenge the food and beverage warehousing market growth of industry companies
We can help! Our analysts can customize this food and beverage warehousing market research report to meet your requirements.
Get in touch
1 Executive Summary
- 1.1 Market overview
- Executive Summary - Chart on Market Overview
- Executive Summary - Data Table on Market Overview
- Executive Summary - Chart on Global Market Characteristics
- Executive Summary - Chart on Market by Geography
- Executive Summary - Chart on Market Segmentation by Application
- Executive Summary - Chart on Market Segmentation by End-user
- Executive Summary - Chart on Market Segmentation by Type
- Executive Summary - Chart on Market Segmentation by Technology
- Executive Summary - Chart on Incremental Growth
- Executive Summary - Data Table on Incremental Growth
- Executive Summary - Chart on Company Market Positioning
2 Technavio Analysis
- 2.1 Analysis of price sensitivity, lifecycle, customer purchase basket, adoption rates, and purchase criteria
- Analysis of price sensitivity, lifecycle, customer purchase basket, adoption rates, and purchase criteria
- 2.2 Criticality of inputs and Factors of differentiation
- Overview on criticality of inputs and factors of differentiation
- 2.3 Factors of disruption
- Overview on factors of disruption
- 2.4 Impact of drivers and challenges
- Impact of drivers and challenges in 2024 and 2029
3 Market Landscape
- 3.1 Market ecosystem
- Parent Market
- Data Table on - Parent Market
- 3.2 Market characteristics
- Market characteristics analysis
4 Market Sizing
- 4.1 Market definition
- Offerings of companies included in the market definition
- 4.2 Market segment analysis
- 4.4 Market outlook: Forecast for 2024-2029
- Chart on Global - Market size and forecast 2024-2029 ($ billion)
- Data Table on Global - Market size and forecast 2024-2029 ($ billion)
- Chart on Global Market: Year-over-year growth 2024-2029 (%)
- Data Table on Global Market: Year-over-year growth 2024-2029 (%)
5 Historic Market Size
- 5.1 Global Food And Beverage Warehousing Market 2019 - 2023
- Historic Market Size - Data Table on Global Food And Beverage Warehousing Market 2019 - 2023 ($ billion)
- 5.2 Application segment analysis 2019 - 2023
- Historic Market Size - Application Segment 2019 - 2023 ($ billion)
- 5.3 End-user segment analysis 2019 - 2023
- Historic Market Size - End-user Segment 2019 - 2023 ($ billion)
- 5.4 Type segment analysis 2019 - 2023
- Historic Market Size - Type Segment 2019 - 2023 ($ billion)
- 5.5 Technology segment analysis 2019 - 2023
- Historic Market Size - Technology Segment 2019 - 2023 ($ billion)
- 5.6 Geography segment analysis 2019 - 2023
- Historic Market Size - Geography Segment 2019 - 2023 ($ billion)
- 5.7 Country segment analysis 2019 - 2023
- Historic Market Size - Country Segment 2019 - 2023 ($ billion)
6 Qualitative Analysis
- 6.1 Impact of AI on Global Food and Beverage Warehousing Market
7 Five Forces Analysis
- 7.1 Five forces summary
- Five forces analysis - Comparison between 2024 and 2029
- 7.2 Bargaining power of buyers
- Bargaining power of buyers - Impact of key factors 2024 and 2029
- 7.3 Bargaining power of suppliers
- Bargaining power of suppliers - Impact of key factors in 2024 and 2029
- 7.4 Threat of new entrants
- Threat of new entrants - Impact of key factors in 2024 and 2029
- 7.5 Threat of substitutes
- Threat of substitutes - Impact of key factors in 2024 and 2029
- 7.6 Threat of rivalry
- Threat of rivalry - Impact of key factors in 2024 and 2029
- 7.7 Market condition
- Chart on Market condition - Five forces 2024 and 2029
8 Market Segmentation by Application
- 8.1 Market segments
- Chart on Application - Market share 2024-2029 (%)
- Data Table on Application - Market share 2024-2029 (%)
- 8.2 Comparison by Application
- Chart on Comparison by Application
- Data Table on Comparison by Application
- 8.3 Meat/ fish/ seafood - Market size and forecast 2024-2029
- Chart on Meat/ fish/ seafood - Market size and forecast 2024-2029 ($ billion)
- Data Table on Meat/ fish/ seafood - Market size and forecast 2024-2029 ($ billion)
- Chart on Meat/ fish/ seafood - Year-over-year growth 2024-2029 (%)
- Data Table on Meat/ fish/ seafood - Year-over-year growth 2024-2029 (%)
- 8.4 Dairy and frozen desserts - Market size and forecast 2024-2029
- Chart on Dairy and frozen desserts - Market size and forecast 2024-2029 ($ billion)
- Data Table on Dairy and frozen desserts - Market size and forecast 2024-2029 ($ billion)
- Chart on Dairy and frozen desserts - Year-over-year growth 2024-2029 (%)
- Data Table on Dairy and frozen desserts - Year-over-year growth 2024-2029 (%)
- 8.5 Bakery/ confectionery/ beverages - Market size and forecast 2024-2029
- Chart on Bakery/ confectionery/ beverages - Market size and forecast 2024-2029 ($ billion)
- Data Table on Bakery/ confectionery/ beverages - Market size and forecast 2024-2029 ($ billion)
- Chart on Bakery/ confectionery/ beverages - Year-over-year growth 2024-2029 (%)
- Data Table on Bakery/ confectionery/ beverages - Year-over-year growth 2024-2029 (%)
- 8.6 Fruits and vegetables - Market size and forecast 2024-2029
- Chart on Fruits and vegetables - Market size and forecast 2024-2029 ($ billion)
- Data Table on Fruits and vegetables - Market size and forecast 2024-2029 ($ billion)
- Chart on Fruits and vegetables - Year-over-year growth 2024-2029 (%)
- Data Table on Fruits and vegetables - Year-over-year growth 2024-2029 (%)
- 8.7 Others - Market size and forecast 2024-2029
- Chart on Others - Market size and forecast 2024-2029 ($ billion)
- Data Table on Others - Market size and forecast 2024-2029 ($ billion)
- Chart on Others - Year-over-year growth 2024-2029 (%)
- Data Table on Others - Year-over-year growth 2024-2029 (%)
- 8.8 Market opportunity by Application
- Market opportunity by Application ($ billion)
- Data Table on Market opportunity by Application ($ billion)
9 Market Segmentation by End-user
- 9.1 Market segments
- Chart on End-user - Market share 2024-2029 (%)
- Data Table on End-user - Market share 2024-2029 (%)
- 9.2 Comparison by End-user
- Chart on Comparison by End-user
- Data Table on Comparison by End-user
- 9.3 Processing factories - Market size and forecast 2024-2029
- Chart on Processing factories - Market size and forecast 2024-2029 ($ billion)
- Data Table on Processing factories - Market size and forecast 2024-2029 ($ billion)
- Chart on Processing factories - Year-over-year growth 2024-2029 (%)
- Data Table on Processing factories - Year-over-year growth 2024-2029 (%)
- 9.4 Distributors - Market size and forecast 2024-2029
- Chart on Distributors - Market size and forecast 2024-2029 ($ billion)
- Data Table on Distributors - Market size and forecast 2024-2029 ($ billion)
- Chart on Distributors - Year-over-year growth 2024-2029 (%)
- Data Table on Distributors - Year-over-year growth 2024-2029 (%)
- 9.5 Retailers - Market size and forecast 2024-2029
- Chart on Retailers - Market size and forecast 2024-2029 ($ billion)
- Data Table on Retailers - Market size and forecast 2024-2029 ($ billion)
- Chart on Retailers - Year-over-year growth 2024-2029 (%)
- Data Table on Retailers - Year-over-year growth 2024-2029 (%)
- 9.6 Market opportunity by End-user
- Market opportunity by End-user ($ billion)
- Data Table on Market opportunity by End-user ($ billion)
10 Market Segmentation by Type
- 10.1 Market segments
- Chart on Type - Market share 2024-2029 (%)
- Data Table on Type - Market share 2024-2029 (%)
- 10.2 Comparison by Type
- Chart on Comparison by Type
- Data Table on Comparison by Type
- 10.3 Frozen - Market size and forecast 2024-2029
- Chart on Frozen - Market size and forecast 2024-2029 ($ billion)
- Data Table on Frozen - Market size and forecast 2024-2029 ($ billion)
- Chart on Frozen - Year-over-year growth 2024-2029 (%)
- Data Table on Frozen - Year-over-year growth 2024-2029 (%)
- 10.4 Refrigerated - Market size and forecast 2024-2029
- Chart on Refrigerated - Market size and forecast 2024-2029 ($ billion)
- Data Table on Refrigerated - Market size and forecast 2024-2029 ($ billion)
- Chart on Refrigerated - Year-over-year growth 2024-2029 (%)
- Data Table on Refrigerated - Year-over-year growth 2024-2029 (%)
- 10.5 Dry - Market size and forecast 2024-2029
- Chart on Dry - Market size and forecast 2024-2029 ($ billion)
- Data Table on Dry - Market size and forecast 2024-2029 ($ billion)
- Chart on Dry - Year-over-year growth 2024-2029 (%)
- Data Table on Dry - Year-over-year growth 2024-2029 (%)
- 10.6 Market opportunity by Type
- Market opportunity by Type ($ billion)
- Data Table on Market opportunity by Type ($ billion)
11 Market Segmentation by Technology
- 11.1 Market segments
- Chart on Technology - Market share 2024-2029 (%)
- Data Table on Technology - Market share 2024-2029 (%)
- 11.2 Comparison by Technology
- Chart on Comparison by Technology
- Data Table on Comparison by Technology
- 11.3 Fully automated - Market size and forecast 2024-2029
- Chart on Fully automated - Market size and forecast 2024-2029 ($ billion)
- Data Table on Fully automated - Market size and forecast 2024-2029 ($ billion)
- Chart on Fully automated - Year-over-year growth 2024-2029 (%)
- Data Table on Fully automated - Year-over-year growth 2024-2029 (%)
- 11.4 Semi-automated - Market size and forecast 2024-2029
- Chart on Semi-automated - Market size and forecast 2024-2029 ($ billion)
- Data Table on Semi-automated - Market size and forecast 2024-2029 ($ billion)
- Chart on Semi-automated - Year-over-year growth 2024-2029 (%)
- Data Table on Semi-automated - Year-over-year growth 2024-2029 (%)
- 11.5 Manual - Market size and forecast 2024-2029
- Chart on Manual - Market size and forecast 2024-2029 ($ billion)
- Data Table on Manual - Market size and forecast 2024-2029 ($ billion)
- Chart on Manual - Year-over-year growth 2024-2029 (%)
- Data Table on Manual - Year-over-year growth 2024-2029 (%)
- 11.6 Market opportunity by Technology
- Market opportunity by Technology ($ billion)
- Data Table on Market opportunity by Technology ($ billion)
12 Customer Landscape
- 12.1 Customer landscape overview
- Analysis of price sensitivity, lifecycle, customer purchase basket, adoption rates, and purchase criteria
13 Geographic Landscape
- 13.1 Geographic segmentation
- Chart on Market share by geography 2024-2029 (%)
- Data Table on Market share by geography 2024-2029 (%)
- 13.2 Geographic comparison
- Chart on Geographic comparison
- Data Table on Geographic comparison
- 13.3 North America - Market size and forecast 2024-2029
- Chart on North America - Market size and forecast 2024-2029 ($ billion)
- Data Table on North America - Market size and forecast 2024-2029 ($ billion)
- Chart on North America - Year-over-year growth 2024-2029 (%)
- Data Table on North America - Year-over-year growth 2024-2029 (%)
- 13.4 Europe - Market size and forecast 2024-2029
- Chart on Europe - Market size and forecast 2024-2029 ($ billion)
- Data Table on Europe - Market size and forecast 2024-2029 ($ billion)
- Chart on Europe - Year-over-year growth 2024-2029 (%)
- Data Table on Europe - Year-over-year growth 2024-2029 (%)
- 13.5 APAC - Market size and forecast 2024-2029
- Chart on APAC - Market size and forecast 2024-2029 ($ billion)
- Data Table on APAC - Market size and forecast 2024-2029 ($ billion)
- Chart on APAC - Year-over-year growth 2024-2029 (%)
- Data Table on APAC - Year-over-year growth 2024-2029 (%)
- 13.6 South America - Market size and forecast 2024-2029
- Chart on South America - Market size and forecast 2024-2029 ($ billion)
- Data Table on South America - Market size and forecast 2024-2029 ($ billion)
- Chart on South America - Year-over-year growth 2024-2029 (%)
- Data Table on South America - Year-over-year growth 2024-2029 (%)
- 13.7 Middle East and Africa - Market size and forecast 2024-2029
- Chart on Middle East and Africa - Market size and forecast 2024-2029 ($ billion)
- Data Table on Middle East and Africa - Market size and forecast 2024-2029 ($ billion)
- Chart on Middle East and Africa - Year-over-year growth 2024-2029 (%)
- Data Table on Middle East and Africa - Year-over-year growth 2024-2029 (%)
- 13.8 US - Market size and forecast 2024-2029
- Chart on US - Market size and forecast 2024-2029 ($ billion)
- Data Table on US - Market size and forecast 2024-2029 ($ billion)
- Chart on US - Year-over-year growth 2024-2029 (%)
- Data Table on US - Year-over-year growth 2024-2029 (%)
- 13.9 Canada - Market size and forecast 2024-2029
- Chart on Canada - Market size and forecast 2024-2029 ($ billion)
- Data Table on Canada - Market size and forecast 2024-2029 ($ billion)
- Chart on Canada - Year-over-year growth 2024-2029 (%)
- Data Table on Canada - Year-over-year growth 2024-2029 (%)
- 13.10 China - Market size and forecast 2024-2029
- Chart on China - Market size and forecast 2024-2029 ($ billion)
- Data Table on China - Market size and forecast 2024-2029 ($ billion)
- Chart on China - Year-over-year growth 2024-2029 (%)
- Data Table on China - Year-over-year growth 2024-2029 (%)
- 13.11 UK - Market size and forecast 2024-2029
- Chart on UK - Market size and forecast 2024-2029 ($ billion)
- Data Table on UK - Market size and forecast 2024-2029 ($ billion)
- Chart on UK - Year-over-year growth 2024-2029 (%)
- Data Table on UK - Year-over-year growth 2024-2029 (%)
- 13.12 Japan - Market size and forecast 2024-2029
- Chart on Japan - Market size and forecast 2024-2029 ($ billion)
- Data Table on Japan - Market size and forecast 2024-2029 ($ billion)
- Chart on Japan - Year-over-year growth 2024-2029 (%)
- Data Table on Japan - Year-over-year growth 2024-2029 (%)
- 13.13 India - Market size and forecast 2024-2029
- Chart on India - Market size and forecast 2024-2029 ($ billion)
- Data Table on India - Market size and forecast 2024-2029 ($ billion)
- Chart on India - Year-over-year growth 2024-2029 (%)
- Data Table on India - Year-over-year growth 2024-2029 (%)
- 13.14 Germany - Market size and forecast 2024-2029
- Chart on Germany - Market size and forecast 2024-2029 ($ billion)
- Data Table on Germany - Market size and forecast 2024-2029 ($ billion)
- Chart on Germany - Year-over-year growth 2024-2029 (%)
- Data Table on Germany - Year-over-year growth 2024-2029 (%)
- 13.15 France - Market size and forecast 2024-2029
- Chart on France - Market size and forecast 2024-2029 ($ billion)
- Data Table on France - Market size and forecast 2024-2029 ($ billion)
- Chart on France - Year-over-year growth 2024-2029 (%)
- Data Table on France - Year-over-year growth 2024-2029 (%)
- 13.16 Italy - Market size and forecast 2024-2029
- Chart on Italy - Market size and forecast 2024-2029 ($ billion)
- Data Table on Italy - Market size and forecast 2024-2029 ($ billion)
- Chart on Italy - Year-over-year growth 2024-2029 (%)
- Data Table on Italy - Year-over-year growth 2024-2029 (%)
- 13.17 South Korea - Market size and forecast 2024-2029
- Chart on South Korea - Market size and forecast 2024-2029 ($ billion)
- Data Table on South Korea - Market size and forecast 2024-2029 ($ billion)
- Chart on South Korea - Year-over-year growth 2024-2029 (%)
- Data Table on South Korea - Year-over-year growth 2024-2029 (%)
- 13.18 Market opportunity by geography
- Market opportunity by geography ($ billion)
- Data Tables on Market opportunity by geography ($ billion)
14 Drivers, Challenges, and Opportunity/Restraints
- 14.3 Impact of drivers and challenges
- Impact of drivers and challenges in 2024 and 2029
- 14.4 Market opportunities/restraints
15 Competitive Landscape
- 15.2 Competitive Landscape
- Overview on criticality of inputs and factors of differentiation
- 15.3 Landscape disruption
- Overview on factors of disruption
- 15.4 Industry risks
- Impact of key risks on business
16 Competitive Analysis
- 16.2 Company ranking index
- 16.3 Market positioning of companies
- Matrix on companies position and classification
- 16.4 Agility Public Warehousing Co. K.S.C.P
- Agility Public Warehousing Co. K.S.C.P - Overview
- Agility Public Warehousing Co. K.S.C.P - Business segments
- Agility Public Warehousing Co. K.S.C.P - Key offerings
- Agility Public Warehousing Co. K.S.C.P - Segment focus
- SWOT
- 16.5 Ahearn and Soper Inc.
- Ahearn and Soper Inc. - Overview
- Ahearn and Soper Inc. - Product / Service
- Ahearn and Soper Inc. - Key offerings
- SWOT
- 16.6 Amazon.com Inc.
- Amazon.com Inc. - Overview
- Amazon.com Inc. - Business segments
- Amazon.com Inc. - Key news
- Amazon.com Inc. - Key offerings
- Amazon.com Inc. - Segment focus
- SWOT
- 16.7 Americold Realty Trust Inc.
- Americold Realty Trust Inc. - Overview
- Americold Realty Trust Inc. - Business segments
- Americold Realty Trust Inc. - Key news
- Americold Realty Trust Inc. - Key offerings
- Americold Realty Trust Inc. - Segment focus
- SWOT
- 16.8 Conestoga Cold Storage
- Conestoga Cold Storage - Overview
- Conestoga Cold Storage - Product / Service
- Conestoga Cold Storage - Key offerings
- SWOT
- 16.9 Congebec Logistics Inc.
- Congebec Logistics Inc. - Overview
- Congebec Logistics Inc. - Product / Service
- Congebec Logistics Inc. - Key offerings
- SWOT
- 16.10 Lineage Logistics Holdings LLC
- Lineage Logistics Holdings LLC - Overview
- Lineage Logistics Holdings LLC - Product / Service
- Lineage Logistics Holdings LLC - Key offerings
- SWOT
- 16.11 Nichirei Corp.
- Nichirei Corp. - Overview
- Nichirei Corp. - Business segments
- Nichirei Corp. - Key offerings
- Nichirei Corp. - Segment focus
- SWOT
- 16.12 Penske Corp.
- Penske Corp. - Overview
- Penske Corp. - Product / Service
- Penske Corp. - Key offerings
- SWOT
- 16.13 Ryder System Inc.
- Ryder System Inc. - Overview
- Ryder System Inc. - Business segments
- Ryder System Inc. - Key offerings
- Ryder System Inc. - Segment focus
- SWOT
- 16.14 Snowman Logistics Limited
- Snowman Logistics Limited - Overview
- Snowman Logistics Limited - Business segments
- Snowman Logistics Limited - Key offerings
- Snowman Logistics Limited - Segment focus
- SWOT
- 16.15 Toyota Industries Corp.
- Toyota Industries Corp. - Overview
- Toyota Industries Corp. - Business segments
- Toyota Industries Corp. - Key news
- Toyota Industries Corp. - Key offerings
- Toyota Industries Corp. - Segment focus
- SWOT
- 16.16 United States Cold Storage
- United States Cold Storage - Overview
- United States Cold Storage - Product / Service
- United States Cold Storage - Key offerings
- SWOT
- 16.17 VersaCold Logistics Services
- VersaCold Logistics Services - Overview
- VersaCold Logistics Services - Product / Service
- VersaCold Logistics Services - Key offerings
- SWOT
- 16.18 Walmart Inc.
- Walmart Inc. - Overview
- Walmart Inc. - Business segments
- Walmart Inc. - Key news
- Walmart Inc. - Key offerings
- Walmart Inc. - Segment focus
- SWOT
17 Appendix
- 17.2 Inclusions and exclusions checklist
- Inclusions checklist
- Exclusions checklist
- 17.3 Currency conversion rates for US$
- Currency conversion rates for US$
- 17.4 Research methodology
- 17.7 Validation techniques employed for market sizing
- Validation techniques employed for market sizing
- 17.9 360 degree market analysis
- 360 degree market analysis
- 17.10 List of abbreviations