Food Supply Chain Market Analysis, Size, and Forecast 2026-2030: APAC (China, Japan, and India), North America (US, Canada, and Mexico), Europe (Germany, UK, and France), South America (Brazil, Argentina, and Colombia), Middle East and Africa (Saudi Arabia, UAE, and South Africa), and Rest of World (ROW)

Food Supply Chain Market Analysis, Size, and Forecast 2026-2030:
APAC (China, Japan, and India), North America (US, Canada, and Mexico), Europe (Germany, UK, and France), South America (Brazil, Argentina, and Colombia), Middle East and Africa (Saudi Arabia, UAE, and South Africa), and Rest of World (ROW)

Published: Dec 2025 282 Pages SKU: IRTNTR80137

Market Overview at a Glance

$67.06 B
Market Opportunity
7.8%
CAGR 2025 - 2030
34%
APAC Growth
$80.69 B
Packaged food segment 2024

Food Supply Chain Market Size 2026-2030

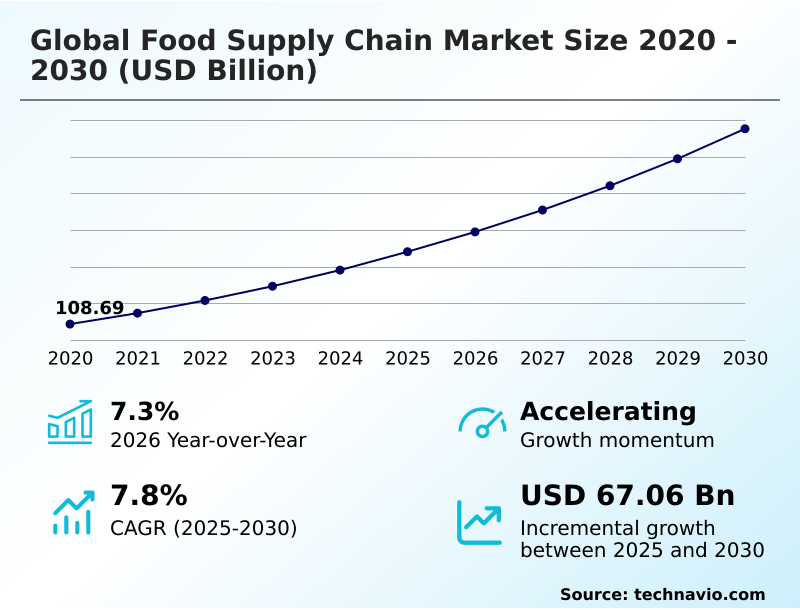
The food supply chain market size is valued to increase by USD 67.06 billion, at a CAGR of 7.8% from 2025 to 2030. Integration of blockchain in food supply chain will drive the food supply chain market.

Major Market Trends & Insights

  • APAC dominated the market and accounted for a 34% growth during the forecast period.
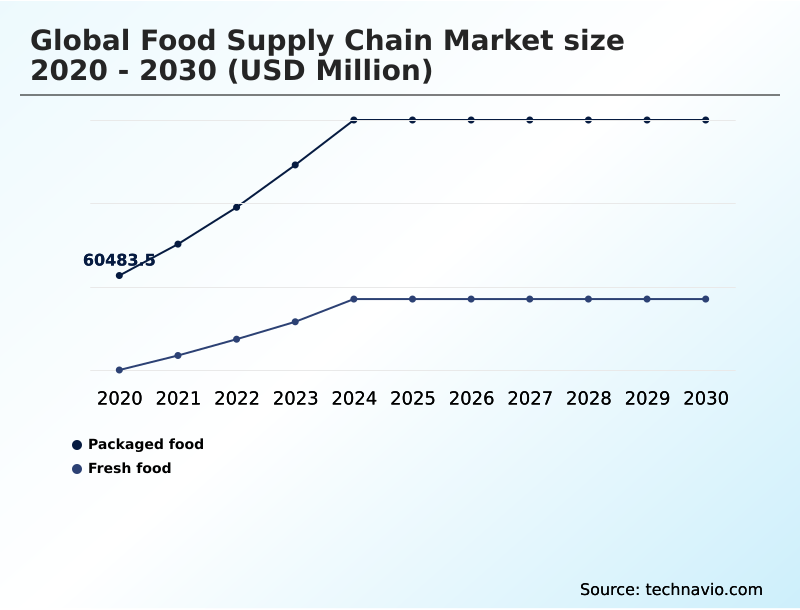
  • By Product Type - Packaged food segment was valued at USD 80.69 billion in 2024
  • By End-user - Households segment accounted for the largest market revenue share in 2024

Market Size & Forecast

  • Market Opportunities: USD 106.52 billion
  • Market Future Opportunities: USD 67.06 billion
  • CAGR from 2025 to 2030 : 7.8%

Market Summary

  • The Food Supply Chain Market is a complex ecosystem focused on ensuring the safe and efficient movement of food from producers to consumers. Key drivers shaping this market include the digitalization of logistics and robust demand for cloud-based management systems.
  • Technologies such as IoT and blockchain are enabling unprecedented transparency, allowing for real-time tracking and verification, which is critical for food safety and regulatory compliance. A primary trend is the shift toward green supply chain management, driven by consumer demand for sustainability and stricter environmental regulations.
  • For instance, a distributor of fresh produce might use a supply chain visibility platform to monitor temperature-controlled shipments, ensuring compliance with food safety regulations and optimizing delivery routes to minimize fuel consumption. This enhances operational efficiency metrics and reduces spoilage.
  • However, the industry faces challenges, including the high maintenance costs of specialized equipment and persistent data security threats in an increasingly interconnected environment. A lack of skilled workforce to manage these advanced systems also constrains growth potential.

What will be the Size of the Food Supply Chain Market during the forecast period?

Get Key Insights on Market Forecast (PDF) Request Free Sample

How is the Food Supply Chain Market Segmented?

The food supply chain industry research report provides comprehensive data (region-wise segment analysis), with forecasts and estimates in "USD million" for the period 2026-2030, as well as historical data from 2020-2024 for the following segments.

  • Product type
    • Packaged food
    • Fresh food
  • End-user
    • Households
    • Commercial
    • Industrial
  • Service type
    • Non cold chain
    • Cold chain
  • Geography
    • APAC
      • China
      • Japan
      • India
    • North America
      • US
      • Canada
      • Mexico
    • Europe
      • Germany
      • UK
      • France
    • South America
      • Brazil
      • Argentina
      • Colombia
    • Middle East and Africa
      • Saudi Arabia
      • UAE
      • South Africa
    • Rest of World (ROW)

By Product Type Insights

The packaged food segment is estimated to witness significant growth during the forecast period.

The packaged food segment is propelled by consumer demand for convenience and extended product viability, necessitating advanced logistical frameworks.

This category's supply chain relies on sophisticated perishable goods logistics, including smart packaging solutions and shelf life extension technology to maintain quality.

Omnichannel retailing logistics and direct-to-consumer food models are creating new complexities, managed through 3PL and 4PL services using route optimization software. Efficiency is paramount, as price sensitivity influences over 70% of purchasing decisions, driving the need for logistics cost reduction.

Consequently, firms focus on e-commerce fulfillment for groceries and tight inventory turnover optimization to protect margins while ensuring food security initiatives are met, making this a highly competitive space.

Request Free Sample

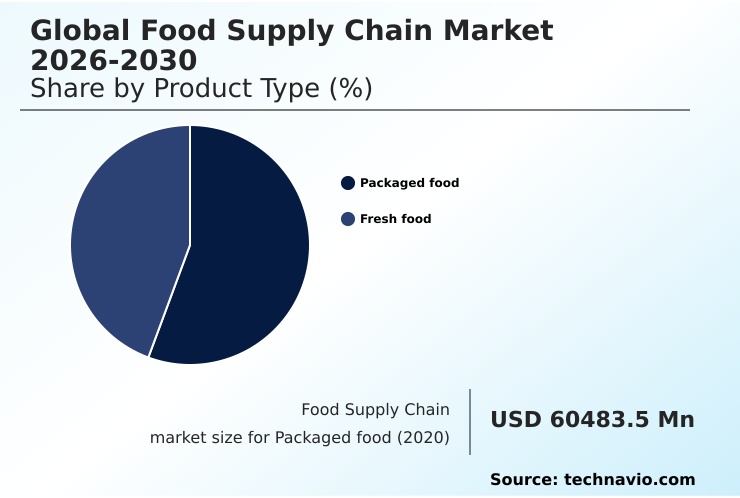
The Packaged food segment was valued at USD 80.69 billion in 2024 and showed a gradual increase during the forecast period.

Request Free Sample

Regional Analysis

APAC is estimated to contribute 34% to the growth of the global market during the forecast period.Technavio’s analysts have elaborately explained the regional trends and drivers that shape the market during the forecast period.

See How Food Supply Chain Market Demand is Rising in APAC Request Free Sample

The global food supply chain is shaped by distinct regional dynamics, with APAC emerging as the primary growth engine, contributing over 34% of the market's incremental expansion.

This is fueled by investments in cold storage infrastructure and the adoption of agile supply chain models to serve a growing urban population. North America follows closely, with its market maturity driving innovation in cross-border logistics and sustainable sourcing practices.

The region’s growth rate trails APAC's by just 0.1 percentage points, underscoring its competitive and highly developed landscape. In Europe, stringent food safety modernization act regulations and a focus on circular economy in food supply are defining operational strategies.

Across all regions, the push for farm-to-fork traceability and food quality assurance is universal, compelling operators to invest in technologies that support global trade and local distribution alike.

Market Dynamics

Our researchers analyzed the data with 2025 as the base year, along with the key drivers, trends, and challenges. A holistic analysis of drivers will help companies refine their marketing strategies to gain a competitive advantage.

  • Modernizing food logistics requires a strategic approach that begins with adopting cloud-based food supply chain platforms and leveraging data analytics for supply chain efficiency. A key technological pillar is the implementation of blockchain for food supply chain traceability, which works in concert with IoT for real-time temperature monitoring to guarantee product integrity.
  • The use of AI in demand forecasting for food is another critical element, directly influencing warehouse automation in food distribution and improving last-mile delivery for perishables. Effective transportation management for frozen foods and optimizing logistics for packaged food are essential for profitability.
  • Concurrently, firms must deploy technology for food fraud detection and use FSMA compliance software for food to meet regulatory demands. These systems provide supply chain solutions for commercial kitchens, aid in managing food supply for households, and enable industrial food supply chain optimization.
  • While the cost of food supply chain maintenance and challenges in global food distribution persist, embracing green supply chain management best practices and reverse logistics in the food industry offers a path to sustainability.
  • For instance, facilities with advanced warehouse automation achieve over 99% order accuracy, a significant improvement over manual processes, thus enhancing food safety with traceability and reducing waste.

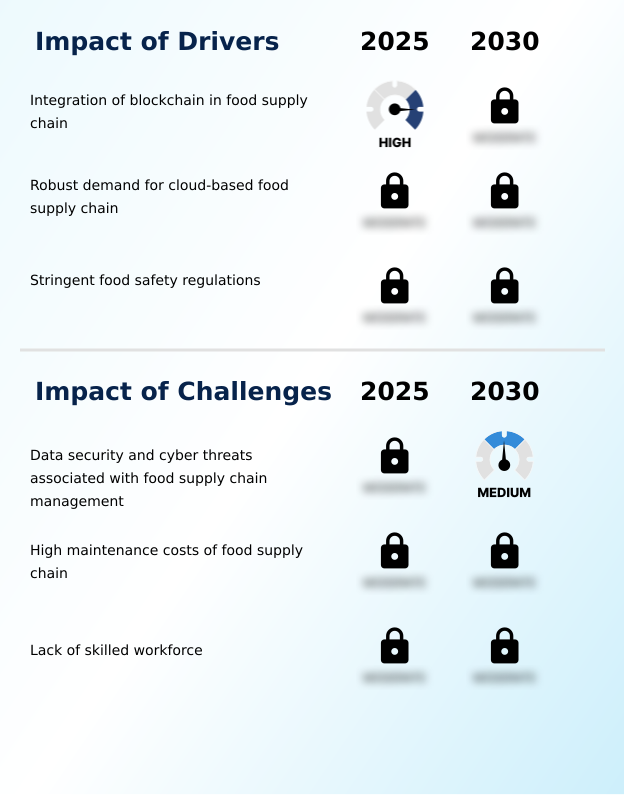
What are the key market drivers leading to the rise in the adoption of Food Supply Chain Industry?

  • The integration of blockchain technology is a key driver, enhancing transparency, traceability, and trust throughout the food supply chain.

  • The market is propelled by drivers that enhance efficiency and trust. The integration of blockchain traceability is paramount, as it can reduce food recall management times by over 90% compared to traditional methods.
  • This technology, combined with real-time temperature monitoring and temperature excursion monitoring, provides an immutable record for farm-to-fork traceability.
  • Demand for cloud-based food supply chain platforms is another major driver, as they lower initial IT setup costs by an average of 40%, making advanced solutions more accessible.
  • These platforms facilitate regulatory compliance automation and real-time collaboration, which are crucial for meeting stringent food safety standards. The need for end-to-end supply chain visibility is driving investment in technologies that deliver actionable insights and improve overall logistics process automation.

What are the market trends shaping the Food Supply Chain Industry?

  • An important trend shaping the market is the rise in mergers and acquisitions. These strategic consolidations are creating more resilient and efficient supply networks.

  • Key trends are reshaping the food supply chain, with digitalization at the forefront. The push for green supply chain management is compelling companies to adopt sustainable practices, with firms focusing on circular economy in food supply reporting brand trust improvements of up to 15%.
  • Mergers and acquisitions are creating more resilient digital logistics networks, consolidating capabilities in advanced analytics in logistics. This consolidation enables better integration of freight brokerage technology and transportation management systems. These strategic moves are not just about scale but also about acquiring specialized expertise in areas like foodservice redistribution and cold storage infrastructure.
  • Adoption of integrated digital platforms has led to a 25% reduction in documentation errors, improving the speed and accuracy of cross-border trade and compliance.

What challenges does the Food Supply Chain Industry face during its growth?

  • A significant challenge affecting industry growth is the vulnerability of digitized food supply chain management systems to data security breaches and cyber threats.

  • The industry grapples with significant challenges that can impede growth and efficiency. Cybersecurity remains a primary concern, as a single data breach can disrupt operations for days, impacting over 80% of connected partners and undermining supply chain risk management efforts. High operational costs, especially for temperature-controlled warehousing and transport, put pressure on margins, making logistics cost reduction a constant battle.
  • The skilled labor shortage further complicates matters, with wages for specialized roles having increased by 15% in recent years. This makes effective supplier audit management and food fraud prevention more difficult to execute. Ensuring food quality assurance and optimizing inventory turnover are ongoing hurdles, particularly for small and medium-sized enterprises with limited resources to invest in advanced technology and training.

Exclusive Technavio Analysis on Customer Landscape

The food supply chain market forecasting report includes the adoption lifecycle of the market, covering from the innovator’s stage to the laggard’s stage. It focuses on adoption rates in different regions based on penetration. Furthermore, the food supply chain market report also includes key purchase criteria and drivers of price sensitivity to help companies evaluate and develop their market growth analysis strategies.

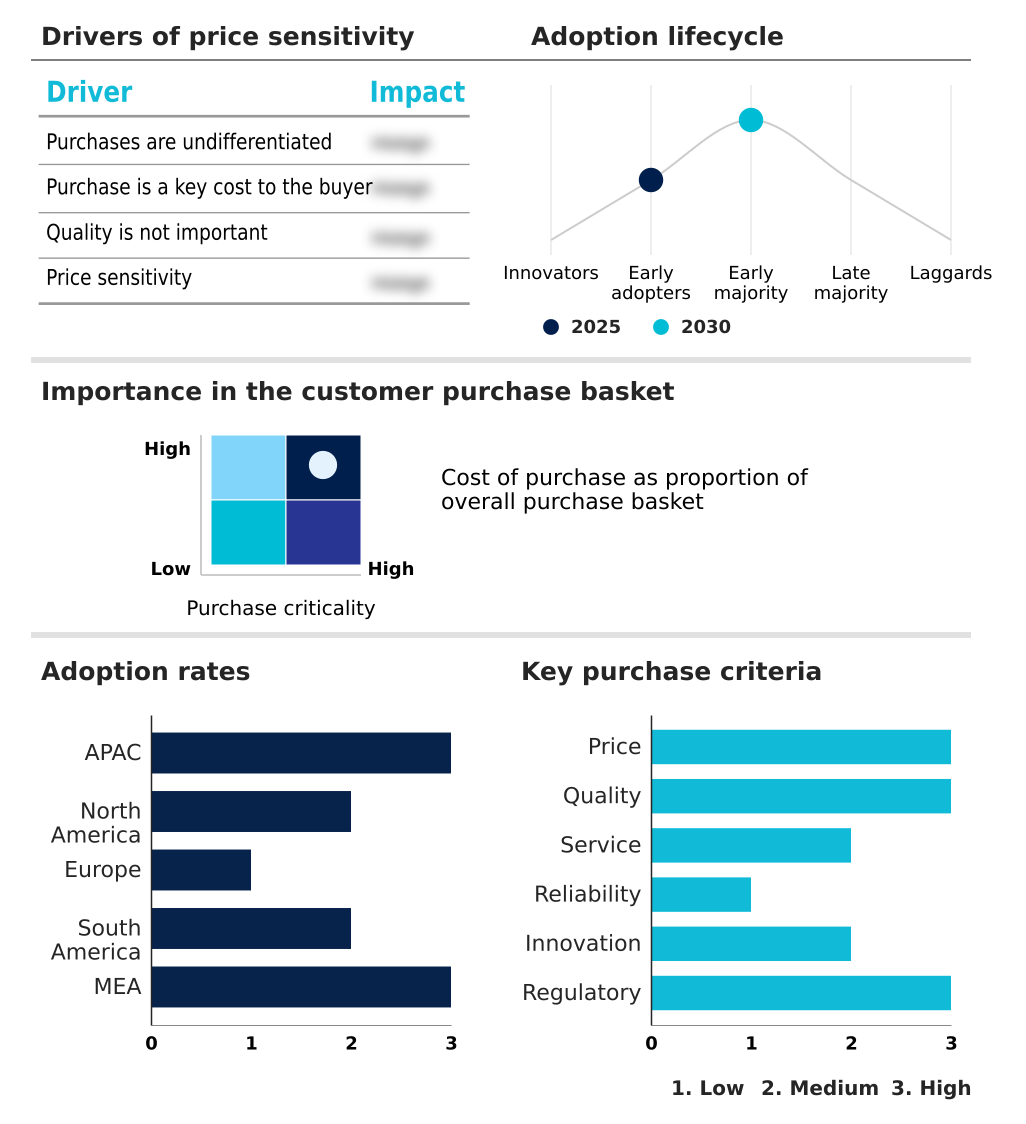
Customer Landscape of Food Supply Chain Industry

Competitive Landscape

Companies are implementing various strategies, such as strategic alliances, food supply chain market forecast, partnerships, mergers and acquisitions, geographical expansion, and product/service launches, to enhance their presence in the industry.

Archer Daniels Midland Co. - Provides integrated food supply chain solutions, spanning ingredient sourcing, complex logistics, and specialized transportation services for global distribution.

The industry research and growth report includes detailed analyses of the competitive landscape of the market and information about key companies, including:

  • Archer Daniels Midland Co.
  • AWL India Pvt. Ltd.
  • Best Food Logistics
  • Burris Logistics Co.
  • C H Robinson Worldwide Inc.
  • Cargill Inc.
  • DACHSER SE
  • Schenker AG
  • Eight Point Distributors
  • Gordon Food Service Inc.
  • IBM Corp.
  • Lineage Inc.
  • Olam Group Ltd.
  • Oracle Corp.
  • Radhakrishna Foodland Pvt Ltd.
  • SAP SE
  • Schneider National Inc.
  • Sysco Corp.
  • VersaCold Logistics Services

Qualitative and quantitative analysis of companies has been conducted to help clients understand the wider business environment as well as the strengths and weaknesses of key industry players. Data is qualitatively analyzed to categorize companies as pure play, category-focused, industry-focused, and diversified; it is quantitatively analyzed to categorize companies as dominant, leading, strong, tentative, and weak.

Recent Development and News in Food supply chain market

  • In October 2024, Global Logistics Corp. announced its acquisition of ColdChain Specialists Inc., a move designed to integrate a robust digital logistics network with specialized perishable goods logistics.
  • In January 2025, AgriTech Innovations launched its 'TrustHarvest' platform, utilizing blockchain traceability to provide end-to-end supply chain visibility for fresh produce and enhance food safety compliance.
  • In March 2025, Transnational Foods and Quantum Analytics entered a strategic partnership to deploy AI-powered demand forecasting analytics, with the goal of reducing food spoilage by over 15%.
  • In May 2025, Oceanic Freight Solutions completed its expansion of temperature-controlled warehousing facilities in three key Southeast Asian ports, significantly boosting its regional cold storage infrastructure.

Dive into Technavio’s robust research methodology, blending expert interviews, extensive data synthesis, and validated models for unparalleled Food Supply Chain Market insights. See full methodology.

Market Scope
Page number 282
Base year 2025
Historic period 2020-2024
Forecast period 2026-2030
Growth momentum & CAGR Accelerate at a CAGR of 7.8%
Market growth 2026-2030 USD 67062.7 million
Market structure Fragmented
YoY growth 2025-2026(%) 7.3%
Key countries China, Japan, India, South Korea, Australia, Indonesia, US, Canada, Mexico, Germany, UK, France, Italy, Spain, The Netherlands, Brazil, Argentina, Colombia, Saudi Arabia, UAE, South Africa, Israel and Turkey
Competitive landscape Leading Companies, Market Positioning of Companies, Competitive Strategies, and Industry Risks

Request Free Sample

Research Analyst Overview

  • The food supply chain market is evolving through the integration of advanced technologies to meet rigorous operational demands. At the forefront is the adoption of cold chain logistics and temperature-controlled distribution, which are critical for perishable goods logistics.
  • Firms utilize a supply chain visibility platform powered by IoT sensors in food transport and predictive analytics for logistics to enable data-driven decision making. Boardroom decisions increasingly focus on investing in compliance management software to align with the Food Safety Modernization Act and other food safety regulations.
  • This strategic alignment, supported by robust quality control systems and food traceability software, has enabled some organizations to improve operational efficiency metrics by over 25%. Core operations are optimized through automated warehousing systems, route optimization software, and sophisticated inventory management systems.
  • The digital logistics network supports everything from foodservice redistribution and procurement management to complex cross-border logistics, intermodal transportation, and customs brokerage services. Trends like green supply chain management and agile supply chain models are reshaping practices, alongside technologies for food waste reduction, smart packaging, and shelf life extension.
  • Managing halal logistics, reverse logistics for food, and supplier relationships through dedicated platforms is now standard, with 3PL and 4PL services providing specialized temperature-controlled warehousing and freight management solutions.

What are the Key Data Covered in this Food Supply Chain Market Research and Growth Report?

  • What is the expected growth of the Food Supply Chain Market between 2026 and 2030?

    • USD 67.06 billion, at a CAGR of 7.8%

  • What segmentation does the market report cover?

    • The report is segmented by Product Type (Packaged food, and Fresh food), End-user (Households, Commercial, and Industrial), Service Type (Non cold chain, and Cold chain) and Geography (APAC, North America, Europe, South America, Middle East and Africa)

  • Which regions are analyzed in the report?

    • APAC, North America, Europe, South America and Middle East and Africa

  • What are the key growth drivers and market challenges?

    • Integration of blockchain in food supply chain, Data security and cyber threats associated with food supply chain management

  • Who are the major players in the Food Supply Chain Market?

    • Archer Daniels Midland Co., AWL India Pvt. Ltd., Best Food Logistics, Burris Logistics Co., C H Robinson Worldwide Inc., Cargill Inc., DACHSER SE, Schenker AG, Eight Point Distributors, Gordon Food Service Inc., IBM Corp., Lineage Inc., Olam Group Ltd., Oracle Corp., Radhakrishna Foodland Pvt Ltd., SAP SE, Schneider National Inc., Sysco Corp. and VersaCold Logistics Services

Market Research Insights

  • The market's dynamism is driven by a focus on supply chain resilience and logistics network optimization. Adopting advanced transportation management systems has enabled logistics cost reduction of up to 15% for early adopters. Simultaneously, warehouse management systems are proving essential for improving inventory turnover optimization, with some businesses achieving a 20% faster cycle time.
  • As food security initiatives become more prominent, the emphasis on end-to-end supply chain visibility intensifies, supported by real-time collaboration platforms. This digital transformation in logistics not only enhances efficiency but also supports complex models like omnichannel retailing logistics and direct-to-consumer food models. Success hinges on integrating these systems to manage risks and meet consumer demand for transparency and speed.

We can help! Our analysts can customize this food supply chain market research report to meet your requirements.

Get in touch

1. Executive Summary

1.1 Market overview

Executive Summary - Chart on Market Overview
Executive Summary - Data Table on Market Overview
Executive Summary - Chart on Global Market Characteristics
Executive Summary - Chart on Market by Geography
Executive Summary - Chart on Market Segmentation by Product Type
Executive Summary - Chart on Market Segmentation by End-user
Executive Summary - Chart on Market Segmentation by Service Type
Executive Summary - Chart on Incremental Growth
Executive Summary - Data Table on Incremental Growth
Executive Summary - Chart on Company Market Positioning

2. Technavio Analysis

2.1 Analysis of price sensitivity, lifecycle, customer purchase basket, adoption rates, and purchase criteria

2.2 Criticality of inputs and Factors of differentiation

Chart on Overview on criticality of inputs and factors of differentiation

2.3 Factors of disruption

Chart on Overview on factors of disruption

2.4 Impact of drivers and challenges

Chart on Impact of drivers and challenges in 2025 and 2030

3. Market Landscape

3.1 Market ecosystem

Chart on Parent Market
Data Table on - Parent Market

3.2 Market characteristics

Chart on Market characteristics analysis

3.3 Value chain analysis

Chart on Value chain analysis

4. Market Sizing

4.1 Market definition

Data Table on Offerings of companies included in the market definition

4.2 Market segment analysis

Market segments

4.3 Market size 2025

4.4 Market outlook: Forecast for 2025-2030

Chart on Global - Market size and forecast 2025-2030 ($ million)
Data Table on Global - Market size and forecast 2025-2030 ($ million)
Chart on Global Market: Year-over-year growth 2025-2030 (%)
Data Table on Global Market: Year-over-year growth 2025-2030 (%)

5. Historic Market Size

5.1 Global Food Supply Chain Market 2020 - 2024

Historic Market Size - Data Table on Global Food Supply Chain Market 2020 - 2024 ($ million)

5.2 Product Type segment analysis 2020 - 2024

Historic Market Size - Product Type Segment 2020 - 2024 ($ million)

5.3 End-user segment analysis 2020 - 2024

Historic Market Size - End-user Segment 2020 - 2024 ($ million)

5.4 Service Type segment analysis 2020 - 2024

Historic Market Size - Service Type Segment 2020 - 2024 ($ million)

5.5 Geography segment analysis 2020 - 2024

Historic Market Size - Geography Segment 2020 - 2024 ($ million)

5.6 Country segment analysis 2020 - 2024

Historic Market Size - Country Segment 2020 - 2024 ($ million)

6. Qualitative Analysis

6.1 The AI impact on Global Food Supply Chain Market

7. Five Forces Analysis

7.1 Five forces summary

Five forces analysis - Comparison between 2025 and 2030

7.2 Bargaining power of buyers

Bargaining power of buyers - Impact of key factors 2025 and 2030

7.3 Bargaining power of suppliers

Bargaining power of suppliers - Impact of key factors in 2025 and 2030

7.4 Threat of new entrants

Threat of new entrants - Impact of key factors in 2025 and 2030

7.5 Threat of substitutes

Threat of substitutes - Impact of key factors in 2025 and 2030

7.6 Threat of rivalry

Threat of rivalry - Impact of key factors in 2025 and 2030

7.7 Market condition

Chart on Market condition - Five forces 2025 and 2030

8. Market Segmentation by Product Type

8.1 Market segments

Chart on Product Type - Market share 2025-2030 (%)
Data Table on Product Type - Market share 2025-2030 (%)

8.2 Comparison by Product Type

Chart on Comparison by Product Type
Data Table on Comparison by Product Type

8.3 Packaged food - Market size and forecast 2025-2030

Chart on Packaged food - Market size and forecast 2025-2030 ($ million)
Data Table on Packaged food - Market size and forecast 2025-2030 ($ million)
Chart on Packaged food - Year-over-year growth 2025-2030 (%)
Data Table on Packaged food - Year-over-year growth 2025-2030 (%)

8.4 Fresh food - Market size and forecast 2025-2030

Chart on Fresh food - Market size and forecast 2025-2030 ($ million)
Data Table on Fresh food - Market size and forecast 2025-2030 ($ million)
Chart on Fresh food - Year-over-year growth 2025-2030 (%)
Data Table on Fresh food - Year-over-year growth 2025-2030 (%)

8.5 Market opportunity by Product Type

Market opportunity by Product Type ($ million)
Data Table on Market opportunity by Product Type ($ million)

9. Market Segmentation by End-user

9.1 Market segments

Chart on End-user - Market share 2025-2030 (%)
Data Table on End-user - Market share 2025-2030 (%)

9.2 Comparison by End-user

Chart on Comparison by End-user
Data Table on Comparison by End-user

9.3 Households - Market size and forecast 2025-2030

Chart on Households - Market size and forecast 2025-2030 ($ million)
Data Table on Households - Market size and forecast 2025-2030 ($ million)
Chart on Households - Year-over-year growth 2025-2030 (%)
Data Table on Households - Year-over-year growth 2025-2030 (%)

9.4 Commercial - Market size and forecast 2025-2030

Chart on Commercial - Market size and forecast 2025-2030 ($ million)
Data Table on Commercial - Market size and forecast 2025-2030 ($ million)
Chart on Commercial - Year-over-year growth 2025-2030 (%)
Data Table on Commercial - Year-over-year growth 2025-2030 (%)

9.5 Industrial - Market size and forecast 2025-2030

Chart on Industrial - Market size and forecast 2025-2030 ($ million)
Data Table on Industrial - Market size and forecast 2025-2030 ($ million)
Chart on Industrial - Year-over-year growth 2025-2030 (%)
Data Table on Industrial - Year-over-year growth 2025-2030 (%)

9.6 Market opportunity by End-user

Market opportunity by End-user ($ million)
Data Table on Market opportunity by End-user ($ million)

10. Market Segmentation by Service Type

10.1 Market segments

Chart on Service Type - Market share 2025-2030 (%)
Data Table on Service Type - Market share 2025-2030 (%)

10.2 Comparison by Service Type

Chart on Comparison by Service Type
Data Table on Comparison by Service Type

10.3 Non cold chain - Market size and forecast 2025-2030

Chart on Non cold chain - Market size and forecast 2025-2030 ($ million)
Data Table on Non cold chain - Market size and forecast 2025-2030 ($ million)
Chart on Non cold chain - Year-over-year growth 2025-2030 (%)
Data Table on Non cold chain - Year-over-year growth 2025-2030 (%)

10.4 Cold chain - Market size and forecast 2025-2030

Chart on Cold chain - Market size and forecast 2025-2030 ($ million)
Data Table on Cold chain - Market size and forecast 2025-2030 ($ million)
Chart on Cold chain - Year-over-year growth 2025-2030 (%)
Data Table on Cold chain - Year-over-year growth 2025-2030 (%)

10.5 Market opportunity by Service Type

Market opportunity by Service Type ($ million)
Data Table on Market opportunity by Service Type ($ million)

11. Customer Landscape

11.1 Customer landscape overview

Analysis of price sensitivity, lifecycle, customer purchase basket, adoption rates, and purchase criteria

12. Geographic Landscape

12.1 Geographic segmentation

Chart on Market share by geography 2025-2030 (%)
Data Table on Market share by geography 2025-2030 (%)

12.2 Geographic comparison

Chart on Geographic comparison
Data Table on Geographic comparison

12.3 APAC - Market size and forecast 2025-2030

Chart on APAC - Market size and forecast 2025-2030 ($ million)
Data Table on APAC - Market size and forecast 2025-2030 ($ million)
Chart on APAC - Year-over-year growth 2025-2030 (%)
Data Table on APAC - Year-over-year growth 2025-2030 (%)
Chart on Regional Comparison - APAC
Data Table on Regional Comparison - APAC

12.3.1 China - Market size and forecast 2025-2030

Chart on China - Market size and forecast 2025-2030 ($ million)
Data Table on China - Market size and forecast 2025-2030 ($ million)
Chart on China - Year-over-year growth 2025-2030 (%)
Data Table on China - Year-over-year growth 2025-2030 (%)

12.3.2 Japan - Market size and forecast 2025-2030

Chart on Japan - Market size and forecast 2025-2030 ($ million)
Data Table on Japan - Market size and forecast 2025-2030 ($ million)
Chart on Japan - Year-over-year growth 2025-2030 (%)
Data Table on Japan - Year-over-year growth 2025-2030 (%)

12.3.3 India - Market size and forecast 2025-2030

Chart on India - Market size and forecast 2025-2030 ($ million)
Data Table on India - Market size and forecast 2025-2030 ($ million)
Chart on India - Year-over-year growth 2025-2030 (%)
Data Table on India - Year-over-year growth 2025-2030 (%)

12.3.4 South Korea - Market size and forecast 2025-2030

Chart on South Korea - Market size and forecast 2025-2030 ($ million)
Data Table on South Korea - Market size and forecast 2025-2030 ($ million)
Chart on South Korea - Year-over-year growth 2025-2030 (%)
Data Table on South Korea - Year-over-year growth 2025-2030 (%)

12.3.5 Australia - Market size and forecast 2025-2030

Chart on Australia - Market size and forecast 2025-2030 ($ million)
Data Table on Australia - Market size and forecast 2025-2030 ($ million)
Chart on Australia - Year-over-year growth 2025-2030 (%)
Data Table on Australia - Year-over-year growth 2025-2030 (%)

12.3.6 Indonesia - Market size and forecast 2025-2030

Chart on Indonesia - Market size and forecast 2025-2030 ($ million)
Data Table on Indonesia - Market size and forecast 2025-2030 ($ million)
Chart on Indonesia - Year-over-year growth 2025-2030 (%)
Data Table on Indonesia - Year-over-year growth 2025-2030 (%)

12.4 North America - Market size and forecast 2025-2030

Chart on North America - Market size and forecast 2025-2030 ($ million)
Data Table on North America - Market size and forecast 2025-2030 ($ million)
Chart on North America - Year-over-year growth 2025-2030 (%)
Data Table on North America - Year-over-year growth 2025-2030 (%)
Chart on Regional Comparison - North America
Data Table on Regional Comparison - North America

12.4.1 US - Market size and forecast 2025-2030

Chart on US - Market size and forecast 2025-2030 ($ million)
Data Table on US - Market size and forecast 2025-2030 ($ million)
Chart on US - Year-over-year growth 2025-2030 (%)
Data Table on US - Year-over-year growth 2025-2030 (%)

12.4.2 Canada - Market size and forecast 2025-2030

Chart on Canada - Market size and forecast 2025-2030 ($ million)
Data Table on Canada - Market size and forecast 2025-2030 ($ million)
Chart on Canada - Year-over-year growth 2025-2030 (%)
Data Table on Canada - Year-over-year growth 2025-2030 (%)

12.4.3 Mexico - Market size and forecast 2025-2030

Chart on Mexico - Market size and forecast 2025-2030 ($ million)
Data Table on Mexico - Market size and forecast 2025-2030 ($ million)
Chart on Mexico - Year-over-year growth 2025-2030 (%)
Data Table on Mexico - Year-over-year growth 2025-2030 (%)

12.5 Europe - Market size and forecast 2025-2030

Chart on Europe - Market size and forecast 2025-2030 ($ million)
Data Table on Europe - Market size and forecast 2025-2030 ($ million)
Chart on Europe - Year-over-year growth 2025-2030 (%)
Data Table on Europe - Year-over-year growth 2025-2030 (%)
Chart on Regional Comparison - Europe
Data Table on Regional Comparison - Europe

12.5.1 Germany - Market size and forecast 2025-2030

Chart on Germany - Market size and forecast 2025-2030 ($ million)
Data Table on Germany - Market size and forecast 2025-2030 ($ million)
Chart on Germany - Year-over-year growth 2025-2030 (%)
Data Table on Germany - Year-over-year growth 2025-2030 (%)

12.5.2 UK - Market size and forecast 2025-2030

Chart on UK - Market size and forecast 2025-2030 ($ million)
Data Table on UK - Market size and forecast 2025-2030 ($ million)
Chart on UK - Year-over-year growth 2025-2030 (%)
Data Table on UK - Year-over-year growth 2025-2030 (%)

12.5.3 France - Market size and forecast 2025-2030

Chart on France - Market size and forecast 2025-2030 ($ million)
Data Table on France - Market size and forecast 2025-2030 ($ million)
Chart on France - Year-over-year growth 2025-2030 (%)
Data Table on France - Year-over-year growth 2025-2030 (%)

12.5.4 Italy - Market size and forecast 2025-2030

Chart on Italy - Market size and forecast 2025-2030 ($ million)
Data Table on Italy - Market size and forecast 2025-2030 ($ million)
Chart on Italy - Year-over-year growth 2025-2030 (%)
Data Table on Italy - Year-over-year growth 2025-2030 (%)

12.5.5 Spain - Market size and forecast 2025-2030

Chart on Spain - Market size and forecast 2025-2030 ($ million)
Data Table on Spain - Market size and forecast 2025-2030 ($ million)
Chart on Spain - Year-over-year growth 2025-2030 (%)
Data Table on Spain - Year-over-year growth 2025-2030 (%)

12.5.6 The Netherlands - Market size and forecast 2025-2030

Chart on The Netherlands - Market size and forecast 2025-2030 ($ million)
Data Table on The Netherlands - Market size and forecast 2025-2030 ($ million)
Chart on The Netherlands - Year-over-year growth 2025-2030 (%)
Data Table on The Netherlands - Year-over-year growth 2025-2030 (%)

12.6 South America - Market size and forecast 2025-2030

Chart on South America - Market size and forecast 2025-2030 ($ million)
Data Table on South America - Market size and forecast 2025-2030 ($ million)
Chart on South America - Year-over-year growth 2025-2030 (%)
Data Table on South America - Year-over-year growth 2025-2030 (%)
Chart on Regional Comparison - South America
Data Table on Regional Comparison - South America

12.6.1 Brazil - Market size and forecast 2025-2030

Chart on Brazil - Market size and forecast 2025-2030 ($ million)
Data Table on Brazil - Market size and forecast 2025-2030 ($ million)
Chart on Brazil - Year-over-year growth 2025-2030 (%)
Data Table on Brazil - Year-over-year growth 2025-2030 (%)

12.6.2 Argentina - Market size and forecast 2025-2030

Chart on Argentina - Market size and forecast 2025-2030 ($ million)
Data Table on Argentina - Market size and forecast 2025-2030 ($ million)
Chart on Argentina - Year-over-year growth 2025-2030 (%)
Data Table on Argentina - Year-over-year growth 2025-2030 (%)

12.6.3 Colombia - Market size and forecast 2025-2030

Chart on Colombia - Market size and forecast 2025-2030 ($ million)
Data Table on Colombia - Market size and forecast 2025-2030 ($ million)
Chart on Colombia - Year-over-year growth 2025-2030 (%)
Data Table on Colombia - Year-over-year growth 2025-2030 (%)

12.7 Middle East and Africa - Market size and forecast 2025-2030

Chart on Middle East and Africa - Market size and forecast 2025-2030 ($ million)
Data Table on Middle East and Africa - Market size and forecast 2025-2030 ($ million)
Chart on Middle East and Africa - Year-over-year growth 2025-2030 (%)
Data Table on Middle East and Africa - Year-over-year growth 2025-2030 (%)
Chart on Regional Comparison - Middle East and Africa
Data Table on Regional Comparison - Middle East and Africa

12.7.1 Saudi Arabia - Market size and forecast 2025-2030

Chart on Saudi Arabia - Market size and forecast 2025-2030 ($ million)
Data Table on Saudi Arabia - Market size and forecast 2025-2030 ($ million)
Chart on Saudi Arabia - Year-over-year growth 2025-2030 (%)
Data Table on Saudi Arabia - Year-over-year growth 2025-2030 (%)

12.7.2 UAE - Market size and forecast 2025-2030

Chart on UAE - Market size and forecast 2025-2030 ($ million)
Data Table on UAE - Market size and forecast 2025-2030 ($ million)
Chart on UAE - Year-over-year growth 2025-2030 (%)
Data Table on UAE - Year-over-year growth 2025-2030 (%)

12.7.3 South Africa - Market size and forecast 2025-2030

Chart on South Africa - Market size and forecast 2025-2030 ($ million)
Data Table on South Africa - Market size and forecast 2025-2030 ($ million)
Chart on South Africa - Year-over-year growth 2025-2030 (%)
Data Table on South Africa - Year-over-year growth 2025-2030 (%)

12.7.4 Israel - Market size and forecast 2025-2030

Chart on Israel - Market size and forecast 2025-2030 ($ million)
Data Table on Israel - Market size and forecast 2025-2030 ($ million)
Chart on Israel - Year-over-year growth 2025-2030 (%)
Data Table on Israel - Year-over-year growth 2025-2030 (%)

12.7.5 Turkey - Market size and forecast 2025-2030

Chart on Turkey - Market size and forecast 2025-2030 ($ million)
Data Table on Turkey - Market size and forecast 2025-2030 ($ million)
Chart on Turkey - Year-over-year growth 2025-2030 (%)
Data Table on Turkey - Year-over-year growth 2025-2030 (%)

12.8 Market opportunity by geography

Market opportunity by geography ($ million)
Data Tables on Market opportunity by geography ($ million)

13. Drivers, Challenges, and Opportunity

13.1 Market drivers

Integration of blockchain in food supply chain
Robust demand for cloud-based food supply chain
Stringent food safety regulations

13.2 Market challenges

Data security and cyber threats associated with food supply chain management
High maintenance costs of food supply chain
Lack of skilled workforce

13.3 Impact of drivers and challenges

Impact of drivers and challenges in 2025 and 2030

13.4 Market opportunities

Increasing mergers and acquisitions among market companies
Digitalization of food supply chain
Emergence of green food supply chain management

14. Competitive Landscape

14.1 Overview

14.2

Overview on criticality of inputs and factors of differentiation

14.3 Landscape disruption

Overview on factors of disruption

14.4 Industry risks

Impact of key risks on business

15. Competitive Analysis

15.1 Companies profiled

Companies covered

15.2 Company ranking index

15.3 Market positioning of companies

Matrix on companies position and classification

15.4 Archer Daniels Midland Co.

Archer Daniels Midland Co. - Overview
Archer Daniels Midland Co. - Business segments
Archer Daniels Midland Co. - Key news
Archer Daniels Midland Co. - Key offerings
Archer Daniels Midland Co. - Segment focus
SWOT

15.5 AWL India Pvt. Ltd.

AWL India Pvt. Ltd. - Overview
AWL India Pvt. Ltd. - Product / Service
AWL India Pvt. Ltd. - Key offerings
SWOT

15.6 Best Food Logistics

Best Food Logistics - Overview
Best Food Logistics - Product / Service
Best Food Logistics - Key offerings
SWOT

15.7 Burris Logistics Co.

Burris Logistics Co. - Overview
Burris Logistics Co. - Product / Service
Burris Logistics Co. - Key offerings
SWOT

15.8 C H Robinson Worldwide Inc.

C H Robinson Worldwide Inc. - Overview
C H Robinson Worldwide Inc. - Product / Service
C H Robinson Worldwide Inc. - Key news
C H Robinson Worldwide Inc. - Key offerings
SWOT

15.9 Cargill Inc.

Cargill Inc. - Overview
Cargill Inc. - Product / Service
Cargill Inc. - Key offerings
SWOT

15.10 DACHSER SE

DACHSER SE - Overview
DACHSER SE - Product / Service
DACHSER SE - Key offerings
SWOT

15.11 Schenker AG

Schenker AG - Overview
Schenker AG - Product / Service
Schenker AG - Key offerings
SWOT

15.12 Eight Point Distributors

Eight Point Distributors - Overview
Eight Point Distributors - Product / Service
Eight Point Distributors - Key offerings
SWOT

15.13 Gordon Food Service Inc.

Gordon Food Service Inc. - Overview
Gordon Food Service Inc. - Product / Service
Gordon Food Service Inc. - Key offerings
SWOT

15.14 Olam Group Ltd.

Olam Group Ltd. - Overview
Olam Group Ltd. - Business segments
Olam Group Ltd. - Key offerings
Olam Group Ltd. - Segment focus
SWOT

15.15 Radhakrishna Foodland Pvt Ltd.

Radhakrishna Foodland Pvt Ltd. - Overview
Radhakrishna Foodland Pvt Ltd. - Product / Service
Radhakrishna Foodland Pvt Ltd. - Key offerings
SWOT

15.16 Schneider National Inc.

Schneider National Inc. - Overview
Schneider National Inc. - Business segments
Schneider National Inc. - Key news
Schneider National Inc. - Key offerings
Schneider National Inc. - Segment focus
SWOT

15.17 Sysco Corp.

Sysco Corp. - Overview
Sysco Corp. - Business segments
Sysco Corp. - Key news
Sysco Corp. - Key offerings
Sysco Corp. - Segment focus
SWOT

15.18 VersaCold Logistics Services

VersaCold Logistics Services - Overview
VersaCold Logistics Services - Product / Service
VersaCold Logistics Services - Key offerings
SWOT

16. Appendix

16.1 Scope of the report

Market definition
Objectives
Notes and caveats

16.2 Inclusions and exclusions checklist

Inclusions checklist
Exclusions checklist

16.3 Currency conversion rates for US$

16.4 Research methodology

16.5 Data procurement

Information sources

16.6 Data validation

16.7 Validation techniques employed for market sizing

16.8 Data synthesis

16.9 360 degree market analysis

16.10 List of abbreviations

Research Methodology

Technavio presents a detailed picture of the market by way of study, synthesis, and summation of data from multiple sources. The analysts have presented the various facets of the market with a particular focus on identifying the key industry influencers. The data thus presented is comprehensive, reliable, and the result of extensive research, both primary and secondary.

INFORMATION SOURCES

Primary sources

  • Manufacturers and suppliers
  • Channel partners
  • Industry experts
  • Strategic decision makers

Secondary sources

  • Industry journals and periodicals
  • Government data
  • Financial reports of key industry players
  • Historical data
  • Press releases

DATA ANALYSIS

Data Synthesis

  • Collation of data
  • Estimation of key figures
  • Analysis of derived insights

Data Validation

  • Triangulation with data models
  • Reference against proprietary databases
  • Corroboration with industry experts

REPORT WRITING

Qualitative

  • Market drivers
  • Market challenges
  • Market trends
  • Five forces analysis

Quantitative

  • Market size and forecast
  • Market segmentation
  • Geographical insights
  • Competitive landscape

Interested in this report?

Get your sample now to see our research methodology and insights!

Download Now

Frequently Asked Questions

Food Supply Chain market growth will increase by USD 67062.7 million during 2026-2030.

The Food Supply Chain market is expected to grow at a CAGR of 7.8% during 2026-2030.

Food Supply Chain market is segmented by Product type (Packaged food, Fresh food) End-user (Households, Commercial, Industrial) Service type (Non cold chain, Cold chain)

Archer Daniels Midland Co., AWL India Pvt. Ltd., Best Food Logistics, Burris Logistics Co., C H Robinson Worldwide Inc., Cargill Inc., DACHSER SE, Schenker AG, Eight Point Distributors, Gordon Food Service Inc., IBM Corp., Lineage Inc., Olam Group Ltd., Oracle Corp., Radhakrishna Foodland Pvt Ltd., SAP SE, Schneider National Inc., Sysco Corp., VersaCold Logistics Services are a few of the key vendors in the Food Supply Chain market.

APAC will register the highest growth rate of 34% among the other regions. Therefore, the Food Supply Chain market in APAC is expected to garner significant business opportunities for the vendors during the forecast period.

China, Japan, India, South Korea, Australia, Indonesia, US, Canada, Mexico, Germany, UK, France, Italy, Spain, The Netherlands, Brazil, Argentina, Colombia, Saudi Arabia, UAE, South Africa, Israel, Turkey

  • Integration of blockchain in food supply chain is the driving factor this market.

The Food Supply Chain market vendors should focus on grabbing business opportunities from the Product type segment as it accounted for the largest market share in the base year.