US Food Service Market Analysis, Size, and Forecast 2026-2030

US Food Service Market Analysis, Size, and Forecast 2026-2030

Published: Mar 2026 207 Pages SKU: IRTNTR70236

Market Overview at a Glance

$10214 B
Market Opportunity
51.8%
CAGR 2025 - 2030
34.5%
YoY growth 2025-2026(%)
$345.3 B
Fast food service segment 2024

US Food Service Market Size 2026-2030

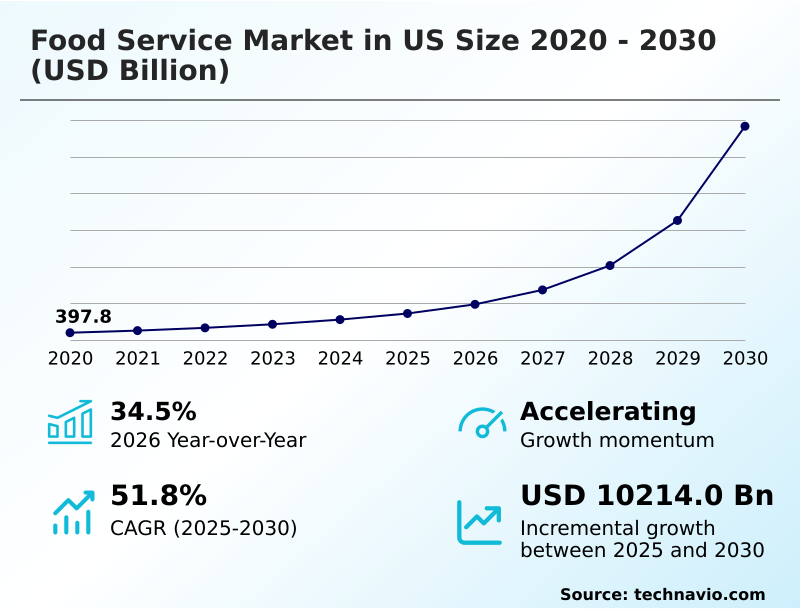
The us food service market size is valued to increase by USD 10214 billion, at a CAGR of 51.8% from 2025 to 2030. Increased snacking and indulgence consumption will drive the us food service market.

Major Market Trends & Insights

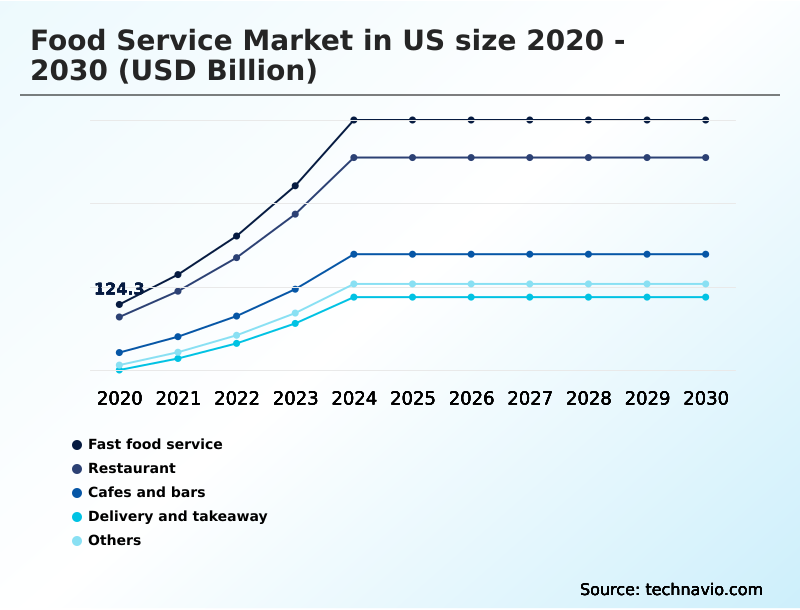
  • By Type - Fast food service segment was valued at USD 345.3 billion in 2024
  • By Solution - Conventional segment accounted for the largest market revenue share in 2024

Market Size & Forecast

  • Market Opportunities: USD 11262.1 billion
  • Market Future Opportunities: USD 10214 billion
  • CAGR from 2025 to 2030 : 51.8%

Market Summary

  • The food service market in US is undergoing a significant transformation, driven by the convergence of digital technology and evolving consumer behaviors. Key drivers include the demand for convenience, which is met by the proliferation of food delivery apps and digital ordering platforms, and a growing emphasis on health, leading to more allergen-free dining and plant-based menu options.
  • A primary trend is the rise of virtual brands and ghost kitchens, which lower market entry barriers and allow for rapid menu experimentation without the overhead of a traditional restaurant. For example, a business can leverage centralized commissary units to prepare meals for multiple delivery-only concepts, optimizing supply chains and reducing waste.
  • However, the industry faces challenges from persistent labor shortages and rising operational costs, pushing operators toward automation solutions like voice ordering systems and kitchen display systems. Increased at-home cooking also presents a challenge, compelling food service providers to enhance the experiential dining value proposition to attract customers.
  • Success in this environment requires a dual focus on operational efficiency through technology and creating unique, high-quality customer experiences that cannot be replicated at home.

What will be the Size of the US Food Service Market during the forecast period?

Get Key Insights on Market Forecast (PDF) Request Free Sample

How is the US Food Service Market Segmented?

The us food service industry research report provides comprehensive data (region-wise segment analysis), with forecasts and estimates in "USD billion" for the period 2026-2030, as well as historical data from 2020-2024 for the following segments.

  • Type
    • Fast food service
    • Restaurant
    • Cafes and bars
    • Delivery and takeaway
    • Others
  • Solution
    • Conventional
    • Centralized
    • Ready-prepared
    • Assembly-serve
  • Sector
    • Commercial
    • Non-commercial
  • Business segment
    • Chains
    • Independent
  • Geography
    • North America
      • US

By Type Insights

The fast food service segment is estimated to witness significant growth during the forecast period.

The fast food service segment in the US is defined by its focus on convenience, value, and rapid adoption of technology.

This sector is increasingly shaped by the integration of mobile ordering platforms and sophisticated menu engineering to appeal to price-sensitive consumers. Operators are implementing data-driven menu engineering to refine value propositions and manage rising input costs.

The use of AI-driven ovens and other automation is becoming standard for improving consistency and throughput.

While large chains dominate, independent operators are gaining ground by focusing on niche offerings, with some achieving profit margins of 10.5% by optimizing their operational models and leveraging localized supply chains.

This dynamic underscores a broader industry pivot toward digital-first interactions and operational efficiency in the food service market in US.

Request Free Sample

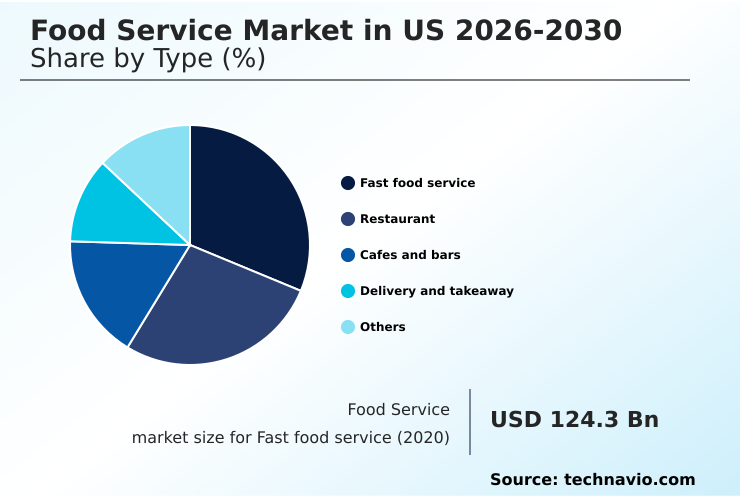
The Fast food service segment was valued at USD 345.3 billion in 2024 and showed a gradual increase during the forecast period.

Request Free Sample

Market Dynamics

Our researchers analyzed the data with 2025 as the base year, along with the key drivers, trends, and challenges. A holistic analysis of drivers will help companies refine their marketing strategies to gain a competitive advantage.

  • Navigating the modern food service market in US 2026-2030 requires a deep understanding of evolving operational models and consumer demands. An analysis of centralized vs conventional kitchen models reveals critical trade-offs between standardization and flexibility.
  • Technology adoption in QSR operations is no longer optional, with a focus on drive-thru efficiency improvement techniques and the integration of robotics in food assembly and service to manage rising labor costs. The impact of ghost kitchens on real estate is profound, creating new opportunities for virtual brand portfolio management.
  • As operators optimize food delivery logistics, a key focus is maintaining food quality in takeaway packaging. Strategies for allergen-free menu development and a secure supply chain for plant-based offerings are essential for capturing health-conscious segments. Furthermore, using consumer data for personalized marketing through loyalty programs integrated with mobile apps is a key differentiator.
  • Data analytics for menu pricing and hyperlocal marketing for independent restaurants help maintain competitiveness. The cost-benefit of subscription models is also a key consideration, alongside sustainability in food service packaging and ensuring compliance with food safety regulations.
  • Businesses leveraging technology for reducing food waste report efficiency gains that are often double those of businesses using manual methods, showcasing the tangible benefits of strategic technology adoption for enhancing customer experience in casual dining.

What are the key market drivers leading to the rise in the adoption of US Food Service Industry?

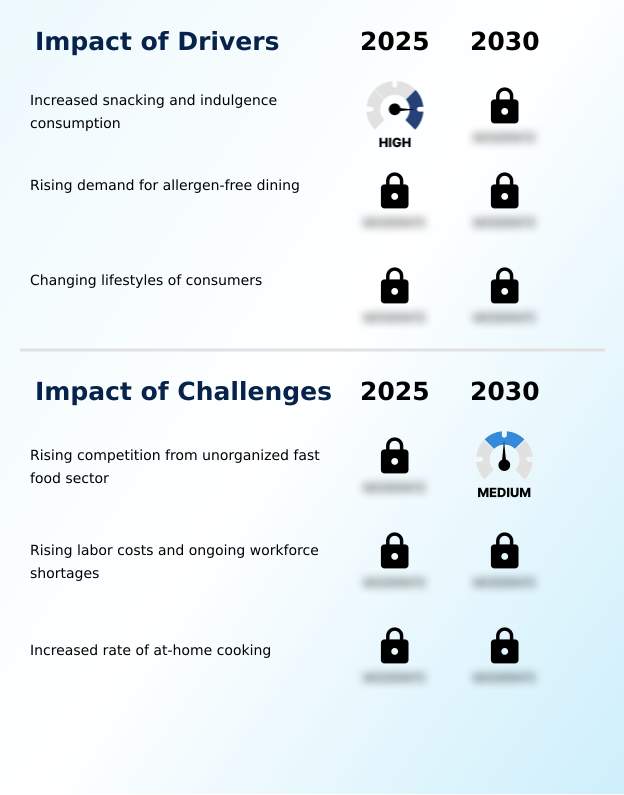
  • An increase in snacking and indulgent food consumption, driven by modern on-the-go lifestyles, is a primary driver for the food service market.

  • Market growth is significantly fueled by changing consumer lifestyles that prioritize convenience and personalized health.
  • The adoption of digital ordering platforms and contactless payments has become standard, with nearly 91% of consumers owning smartphones, which serve as the primary gateway to these services. This digital shift supports the demand for fast-casual formats and quick-service restaurants.
  • Concurrently, the increasing focus on wellness is driving the expansion of allergen-free dining and plant-based menu options.
  • Food service operators that transparently label menus and implement strict cross-contamination protocols have seen customer loyalty from households with allergies increase by up to 20%. These drivers compel businesses to innovate their service models and menu offerings continually.

What are the market trends shaping the US Food Service Industry?

  • The growing diversity of the US population is fueling a significant trend in the food service market, as consumers increasingly seek authentic ethnic cuisines and global flavors.

  • Key trends reshaping the food service market include the rise of virtual kitchens and the expansion of experiential dining concepts. The proliferation of ghost kitchens and virtual brands, powered by food delivery apps, allows operators to reach new customers with lower overhead, with some platforms reducing market entry costs by over 50% compared to traditional brick-and-mortar locations.
  • These delivery-only concepts thrive on efficiency. Simultaneously, full-service establishments are focusing on social media engagement to promote unique dining experiences that cannot be replicated at home. The clean label movement continues to gain traction, pushing for more transparency in menus.
  • This blend of high-tech convenience and high-touch experience defines the current competitive landscape, where data-driven menu engineering informs both value and premium offerings.

What challenges does the US Food Service Industry face during its growth?

  • Heightened competition from the unorganized fast food sector, including food trucks and ghost kitchens, presents a key challenge to the growth of established food service chains.

  • The primary challenges in the food service market center on operational costs and intense competition. Persistent labor shortages are forcing chained operations and independent outlets alike to invest in technology for labor scheduling and service automation, as high staff turnover can inflate training-related expenses by over 25%. Advanced kitchen display systems and other technologies are being deployed to improve efficiency.
  • Simultaneously, rising competition from the unorganized sector, which leverages hyperlocal marketing and lean operational models, puts pressure on pricing and margins. The need for constant food safety management and supply chain optimization adds another layer of complexity, demanding significant capital and strategic planning to maintain profitability in a fragmented market.

Exclusive Technavio Analysis on Customer Landscape

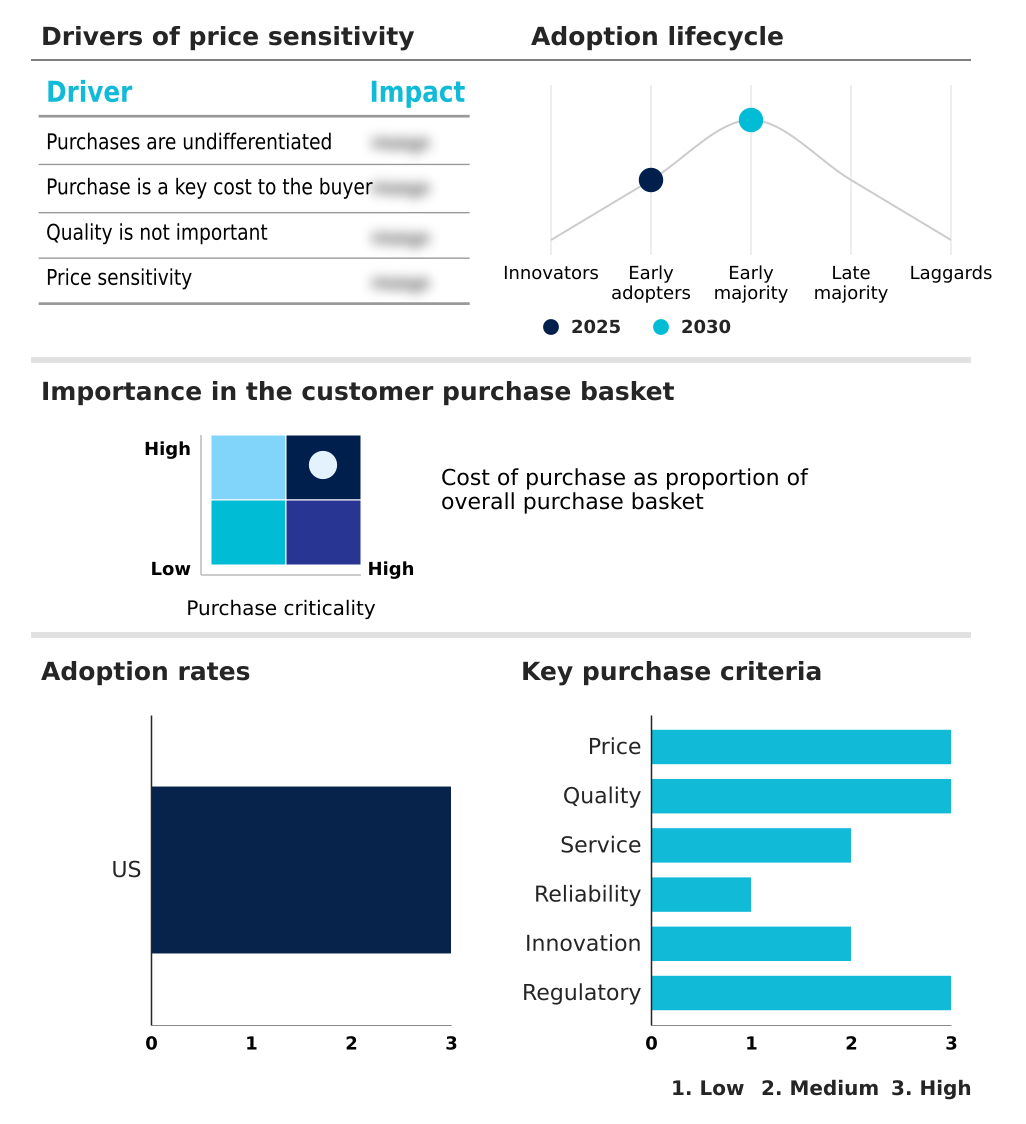
The us food service market forecasting report includes the adoption lifecycle of the market, covering from the innovator’s stage to the laggard’s stage. It focuses on adoption rates in different regions based on penetration. Furthermore, the us food service market report also includes key purchase criteria and drivers of price sensitivity to help companies evaluate and develop their market growth analysis strategies.

Customer Landscape of US Food Service Industry

Competitive Landscape

Companies are implementing various strategies, such as strategic alliances, us food service market forecast, partnerships, mergers and acquisitions, geographical expansion, and product/service launches, to enhance their presence in the industry.

American Dairy Queen Corp. - Offerings include a diverse range of quick-service, fast-casual, and delivery-focused dining options, emphasizing convenience, menu variety, and customizable meal experiences for consumers.

The industry research and growth report includes detailed analyses of the competitive landscape of the market and information about key companies, including:

  • American Dairy Queen Corp.
  • Chick fil A Inc.
  • Chipotle Mexican Grill Inc.
  • Dominos Pizza Inc.
  • Five Guys Enterprises LLC
  • Inspire Brands Inc.
  • Jack in the Box Inc.
  • Jersey Mikes Franchise Systems
  • Jimmy Johns Franchisor SPV LLC
  • McDonald Corp.
  • MTY Food Group Inc.
  • Papa Johns International Inc.
  • Penn Station Inc.
  • Pret A Manger
  • Restaurant Brands Inc.
  • Starbucks Corp.
  • The Subway Group
  • The Wendys Co.
  • YUM Brands Inc.

Qualitative and quantitative analysis of companies has been conducted to help clients understand the wider business environment as well as the strengths and weaknesses of key industry players. Data is qualitatively analyzed to categorize companies as pure play, category-focused, industry-focused, and diversified; it is quantitatively analyzed to categorize companies as dominant, leading, strong, tentative, and weak.

Recent Development and News in Us food service market

  • In April, 2025, Presto Phoenix launched its voice AI phone-ordering division at the Restaurant Leadership Conference, providing a solution to address labor shortages and enhance order accuracy for the quick-service restaurant sector.
  • In October, 2024, YUM Brands Inc. announced a leadership transition, appointing a new chief executive officer to spearhead its global unit development and accelerate the deployment of proprietary technology platforms across its brand portfolio.
  • In November, 2024, Chipotle Mexican Grill Inc. celebrated the opening of its 4,000th location, a milestone in its strategy to expand its footprint and improve transaction speed through the continued rollout of its Chipotlane drive-thru format.
  • In February, 2025, Starbucks Corp. presented its comprehensive transformation plan at an investor event, outlining initiatives focused on a reimagined loyalty program and the use of artificial intelligence to optimize store throughput and customer personalization.

Dive into Technavio’s robust research methodology, blending expert interviews, extensive data synthesis, and validated models for unparalleled US Food Service Market insights. See full methodology.

Market Scope
Page number 207
Base year 2025
Historic period 2020-2024
Forecast period 2026-2030
Growth momentum & CAGR Accelerate at a CAGR of 51.8%
Market growth 2026-2030 USD 10214.0 billion
Market structure Fragmented
YoY growth 2025-2026(%) 34.5%
Key countries US
Competitive landscape Leading Companies, Market Positioning of Companies, Competitive Strategies, and Industry Risks

Request Free Sample

Research Analyst Overview

  • The food service market in US is navigating a period of intense operational recalibration. The rise of ghost kitchens and the broader cloud kitchen sector is compelling operators to rethink physical footprints, with many pivoting to drive-thru-only formats or delivery-centric models.
  • Technology is at the core of this shift, with voice ordering systems and kitchen display systems becoming integral for efficiency. The assembly-serve model, supported by automated chilling technology and advanced rethermalization carts, allows for service with minimal on-site labor. Establishments are using sophisticated inventory management software and menu engineering to combat rising costs.
  • In response to consumer health trends, allergen-free dining protocols and diverse plant-based menu options are now mainstream. This evolution is evident as independent full-service establishments that master these operational and menu strategies have successfully returned to double-digit profit margins, reaching 10.5%.
  • The market is also defined by the expansion of virtual brands facilitated by food delivery apps and contactless payments, a trend that directly impacts boardroom decisions on brand portfolio strategy and investment in AI-driven ovens and robotic arms for future growth.

What are the Key Data Covered in this US Food Service Market Research and Growth Report?

  • What is the expected growth of the US Food Service Market between 2026 and 2030?

    • USD 10214 billion, at a CAGR of 51.8%

  • What segmentation does the market report cover?

    • The report is segmented by Type (Fast food service, Restaurant, Cafes and bars, Delivery and takeaway, and Others), Solution (Conventional, Centralized, Ready-prepared, and Assembly-serve), Sector (Commercial, and Non-commercial), Business Segment (Chains, and Independent) and Geography (North America)

  • Which regions are analyzed in the report?

    • North America

  • What are the key growth drivers and market challenges?

    • Increased snacking and indulgence consumption, Rising competition from unorganized fast food sector

  • Who are the major players in the US Food Service Market?

    • American Dairy Queen Corp., Chick fil A Inc., Chipotle Mexican Grill Inc., Dominos Pizza Inc., Five Guys Enterprises LLC, Inspire Brands Inc., Jack in the Box Inc., Jersey Mikes Franchise Systems, Jimmy Johns Franchisor SPV LLC, McDonald Corp., MTY Food Group Inc., Papa Johns International Inc., Penn Station Inc., Pret A Manger, Restaurant Brands Inc., Starbucks Corp., The Subway Group, The Wendys Co. and YUM Brands Inc.

Market Research Insights

  • The food service market is defined by a dynamic interplay of technology adoption and shifting consumer expectations. The move toward digital-first interactions is nearly universal, supported by data showing that 91% of the population owns a smartphone, which directly enables mobile ordering and subscription-based models.
  • Operators are refining their value propositions to capture loyalty, with effective loyalty programs demonstrably boosting customer retention. Establishments that implement clear cross-contamination protocols for allergen-sensitive diners report up to a 20% increase in repeat business from affected consumer groups.
  • The customer journey is increasingly managed through data analytics, allowing for personalized promotions and streamlined service, which has become a critical differentiator in a crowded marketplace. This focus on technology-driven personalization and safety is reshaping the competitive landscape.

We can help! Our analysts can customize this us food service market research report to meet your requirements.

Get in touch

1. Executive Summary

1.1 Market overview

Executive Summary - Chart on Market Overview
Executive Summary - Data Table on Market Overview
Executive Summary - Chart on Country Market Characteristics
Executive Summary - Chart on Market Segmentation by Type
Executive Summary - Chart on Market Segmentation by Solution
Executive Summary - Chart on Market Segmentation by Sector
Executive Summary - Chart on Market Segmentation by Business Segment
Executive Summary - Chart on Company Market Positioning

2. Technavio Analysis

2.1 Analysis of price sensitivity, lifecycle, customer purchase basket, adoption rates, and purchase criteria

2.2 Criticality of inputs and Factors of differentiation

Overview on criticality of inputs and factors of differentiation

2.3 Factors of disruption

Overview on factors of disruption

2.4 Impact of drivers and challenges

Impact of drivers and challenges in 2025 and 2030

3. Market Landscape

3.1 Market ecosystem

Chart on Parent Market
Data Table on - Parent Market

3.2 Market characteristics

Chart on Market characteristics analysis

3.3 Value chain analysis

Chart on Value chain analysis

4. Market Sizing

4.1 Market definition

Data Table on Offerings of companies included in the market definition

4.2 Market segment analysis

Market segments

4.3 Market size 2025

4.4 Market outlook: Forecast for 2025-2030

Chart on US - Market size and forecast 2025-2030 ($ billion)
Data Table on US - Market size and forecast 2025-2030 ($ billion)
Chart on US: Year-over-year growth 2025-2030 (%)
Data Table on US: Year-over-year growth 2025-2030 (%)

5. Historic Market Size

5.1 Food Service Market in US 2020 - 2024

Historic Market Size - Data Table on Food Service Market in US 2020 - 2024 ($ billion)

5.2 Type segment analysis 2020 - 2024

Historic Market Size - Type Segment 2020 - 2024 ($ billion)

5.3 Solution segment analysis 2020 - 2024

Historic Market Size - Solution Segment 2020 - 2024 ($ billion)

5.4 Sector segment analysis 2020 - 2024

Historic Market Size - Sector Segment 2020 - 2024 ($ billion)

5.5 Business segment analysis 2020 - 2024

Historic Market Size - Business Segment 2020 - 2024 ($ billion)

6. Qualitative Analysis

6.1 Impact of AI on Food Service Market in US

7. Five Forces Analysis

7.1 Five forces summary

Five forces analysis - Comparison between 2025 and 2030

7.2 Bargaining power of buyers

Bargaining power of buyers - Impact of key factors 2025 and 2030

7.3 Bargaining power of suppliers

Bargaining power of suppliers - Impact of key factors in 2025 and 2030

7.4 Threat of new entrants

Threat of new entrants - Impact of key factors in 2025 and 2030

7.5 Threat of substitutes

Threat of substitutes - Impact of key factors in 2025 and 2030

7.6 Threat of rivalry

Threat of rivalry - Impact of key factors in 2025 and 2030

7.7 Market condition

Chart on Market condition - Five forces 2025 and 2030

8. Market Segmentation by Type

8.1 Market segments

Chart on Type - Market share 2025-2030 (%)
Data Table on Type - Market share 2025-2030 (%)

8.2 Comparison by Type

Chart on Comparison by Type
Data Table on Comparison by Type

8.3 Fast food service - Market size and forecast 2025-2030

Chart on Fast food service - Market size and forecast 2025-2030 ($ billion)
Data Table on Fast food service - Market size and forecast 2025-2030 ($ billion)
Chart on Fast food service - Year-over-year growth 2025-2030 (%)
Data Table on Fast food service - Year-over-year growth 2025-2030 (%)

8.4 Restaurant - Market size and forecast 2025-2030

Chart on Restaurant - Market size and forecast 2025-2030 ($ billion)
Data Table on Restaurant - Market size and forecast 2025-2030 ($ billion)
Chart on Restaurant - Year-over-year growth 2025-2030 (%)
Data Table on Restaurant - Year-over-year growth 2025-2030 (%)

8.5 Cafes and bars - Market size and forecast 2025-2030

Chart on Cafes and bars - Market size and forecast 2025-2030 ($ billion)
Data Table on Cafes and bars - Market size and forecast 2025-2030 ($ billion)
Chart on Cafes and bars - Year-over-year growth 2025-2030 (%)
Data Table on Cafes and bars - Year-over-year growth 2025-2030 (%)

8.6 Delivery and takeaway - Market size and forecast 2025-2030

Chart on Delivery and takeaway - Market size and forecast 2025-2030 ($ billion)
Data Table on Delivery and takeaway - Market size and forecast 2025-2030 ($ billion)
Chart on Delivery and takeaway - Year-over-year growth 2025-2030 (%)
Data Table on Delivery and takeaway - Year-over-year growth 2025-2030 (%)

8.7 Others - Market size and forecast 2025-2030

Chart on Others - Market size and forecast 2025-2030 ($ billion)
Data Table on Others - Market size and forecast 2025-2030 ($ billion)
Chart on Others - Year-over-year growth 2025-2030 (%)
Data Table on Others - Year-over-year growth 2025-2030 (%)

8.8 Market opportunity by Type

Market opportunity by Type ($ billion)
Data Table on Market opportunity by Type ($ billion)

9. Market Segmentation by Solution

9.1 Market segments

Chart on Solution - Market share 2025-2030 (%)
Data Table on Solution - Market share 2025-2030 (%)

9.2 Comparison by Solution

Chart on Comparison by Solution
Data Table on Comparison by Solution

9.3 Conventional - Market size and forecast 2025-2030

Chart on Conventional - Market size and forecast 2025-2030 ($ billion)
Data Table on Conventional - Market size and forecast 2025-2030 ($ billion)
Chart on Conventional - Year-over-year growth 2025-2030 (%)
Data Table on Conventional - Year-over-year growth 2025-2030 (%)

9.4 Centralized - Market size and forecast 2025-2030

Chart on Centralized - Market size and forecast 2025-2030 ($ billion)
Data Table on Centralized - Market size and forecast 2025-2030 ($ billion)
Chart on Centralized - Year-over-year growth 2025-2030 (%)
Data Table on Centralized - Year-over-year growth 2025-2030 (%)

9.5 Ready-prepared - Market size and forecast 2025-2030

Chart on Ready-prepared - Market size and forecast 2025-2030 ($ billion)
Data Table on Ready-prepared - Market size and forecast 2025-2030 ($ billion)
Chart on Ready-prepared - Year-over-year growth 2025-2030 (%)
Data Table on Ready-prepared - Year-over-year growth 2025-2030 (%)

9.6 Assembly-serve - Market size and forecast 2025-2030

Chart on Assembly-serve - Market size and forecast 2025-2030 ($ billion)
Data Table on Assembly-serve - Market size and forecast 2025-2030 ($ billion)
Chart on Assembly-serve - Year-over-year growth 2025-2030 (%)
Data Table on Assembly-serve - Year-over-year growth 2025-2030 (%)

9.7 Market opportunity by Solution

Market opportunity by Solution ($ billion)
Data Table on Market opportunity by Solution ($ billion)

10. Market Segmentation by Sector

10.1 Market segments

Chart on Sector - Market share 2025-2030 (%)
Data Table on Sector - Market share 2025-2030 (%)

10.2 Comparison by Sector

Chart on Comparison by Sector
Data Table on Comparison by Sector

10.3 Commercial - Market size and forecast 2025-2030

Chart on Commercial - Market size and forecast 2025-2030 ($ billion)
Data Table on Commercial - Market size and forecast 2025-2030 ($ billion)
Chart on Commercial - Year-over-year growth 2025-2030 (%)
Data Table on Commercial - Year-over-year growth 2025-2030 (%)

10.4 Non-commercial - Market size and forecast 2025-2030

Chart on Non-commercial - Market size and forecast 2025-2030 ($ billion)
Data Table on Non-commercial - Market size and forecast 2025-2030 ($ billion)
Chart on Non-commercial - Year-over-year growth 2025-2030 (%)
Data Table on Non-commercial - Year-over-year growth 2025-2030 (%)

10.5 Market opportunity by Sector

Market opportunity by Sector ($ billion)
Data Table on Market opportunity by Sector ($ billion)

11. Market Segmentation by Business Segment

11.1 Market segments

Chart on Market Segmentation by Business Segment - Market share 2025-2030 (%)
Data Table on Market Segmentation by Business Segment - Market share 2025-2030 (%)

11.2 Comparison by Market Segmentation by Business Segment

Chart on Comparison by Market Segmentation by Business Segment
Data Table on Comparison by Market Segmentation by Business Segment

11.3 Chains - Market size and forecast 2025-2030

Chart on Chains - Market size and forecast 2025-2030 ($ billion)
Data Table on Chains - Market size and forecast 2025-2030 ($ billion)
Chart on Chains - Year-over-year growth 2025-2030 (%)
Data Table on Chains - Year-over-year growth 2025-2030 (%)

11.4 Independent - Market size and forecast 2025-2030

Chart on Independent - Market size and forecast 2025-2030 ($ billion)
Data Table on Independent - Market size and forecast 2025-2030 ($ billion)
Chart on Independent - Year-over-year growth 2025-2030 (%)
Data Table on Independent - Year-over-year growth 2025-2030 (%)

11.5 Market opportunity by Market Segmentation by Business Segment

Market opportunity by Market Segmentation by Business Segment ($ billion)
Data Table on Market opportunity by Market Segmentation by Business Segment ($ billion)

12. Customer Landscape

12.1 Customer landscape overview

Analysis of price sensitivity, lifecycle, customer purchase basket, adoption rates, and purchase criteria

13. Drivers, Challenges, and Opportunity

13.1 Market drivers

Increased snacking and indulgence consumption
Rising demand for allergen-free dining
Changing lifestyles of consumers

13.2 Market challenges

Rising competition from unorganized fast food sector
Rising labor costs and ongoing workforce shortages
Increased rate of at-home cooking

13.3 Impact of drivers and challenges

Impact of drivers and challenges in 2025 and 2030

13.4 Market opportunities

Highly diverse population indulging in ethnic cuisine
Increasing demand for gluten-free fast foods
Rise of virtual kitchens and ghost kitchens

14. Competitive Landscape

14.1 Overview

14.2

Overview on criticality of inputs and factors of differentiation

14.3 Landscape disruption

Overview on factors of disruption

14.4 Industry risks

Impact of key risks on business

15. Competitive Analysis

15.1 Companies profiled

Companies covered

15.2 Company ranking index

15.3 Market positioning of companies

Matrix on companies position and classification

15.4 American Dairy Queen Corp.

American Dairy Queen Corp. - Overview
American Dairy Queen Corp. - Product / Service
American Dairy Queen Corp. - Key offerings
SWOT

15.5 Chick fil A Inc.

Chick fil A Inc. - Overview
Chick fil A Inc. - Product / Service
Chick fil A Inc. - Key offerings
SWOT

15.6 Chipotle Mexican Grill Inc.

Chipotle Mexican Grill Inc. - Overview
Chipotle Mexican Grill Inc. - Product / Service
Chipotle Mexican Grill Inc. - Key offerings
SWOT

15.7 Inspire Brands Inc.

Inspire Brands Inc. - Overview
Inspire Brands Inc. - Product / Service
Inspire Brands Inc. - Key offerings
SWOT

15.8 Jack in the Box Inc.

Jack in the Box Inc. - Overview
Jack in the Box Inc. - Business segments
Jack in the Box Inc. - Key offerings
Jack in the Box Inc. - Segment focus
SWOT

15.9 McDonald Corp.

McDonald Corp. - Overview
McDonald Corp. - Business segments
McDonald Corp. - Key offerings
McDonald Corp. - Segment focus
SWOT

15.10 MTY Food Group Inc.

MTY Food Group Inc. - Overview
MTY Food Group Inc. - Business segments
MTY Food Group Inc. - Key offerings
MTY Food Group Inc. - Segment focus
SWOT

15.11 Papa Johns International Inc.

Papa Johns International Inc. - Overview
Papa Johns International Inc. - Business segments
Papa Johns International Inc. - Key offerings
Papa Johns International Inc. - Segment focus
SWOT

15.12 Penn Station Inc.

Penn Station Inc. - Overview
Penn Station Inc. - Product / Service
Penn Station Inc. - Key offerings
SWOT

15.13 Pret A Manger

Pret A Manger - Overview
Pret A Manger - Product / Service
Pret A Manger - Key offerings
SWOT

15.14 Restaurant Brands Inc.

Restaurant Brands Inc. - Overview
Restaurant Brands Inc. - Business segments
Restaurant Brands Inc. - Key news
Restaurant Brands Inc. - Key offerings
Restaurant Brands Inc. - Segment focus
SWOT

15.15 Starbucks Corp.

Starbucks Corp. - Overview
Starbucks Corp. - Business segments
Starbucks Corp. - Key news
Starbucks Corp. - Key offerings
Starbucks Corp. - Segment focus
SWOT

15.16 The Subway Group

The Subway Group - Overview
The Subway Group - Product / Service
The Subway Group - Key news
The Subway Group - Key offerings
SWOT

15.17 The Wendys Co.

The Wendys Co. - Overview
The Wendys Co. - Business segments
The Wendys Co. - Key news
The Wendys Co. - Key offerings
The Wendys Co. - Segment focus
SWOT

15.18 YUM Brands Inc.

YUM Brands Inc. - Overview
YUM Brands Inc. - Business segments
YUM Brands Inc. - Key offerings
YUM Brands Inc. - Segment focus
SWOT

16. Appendix

16.1 Scope of the report

Market definition
Objectives
Notes and caveats

16.2 Inclusions and exclusions checklist

Inclusions checklist
Exclusions checklist

16.3 Currency conversion rates for US$

16.4 Research methodology

16.5 Data procurement

Information sources

16.6 Data validation

16.7 Validation techniques employed for market sizing

16.8 Data synthesis

16.9 360 degree market analysis

16.10 List of abbreviations

Research Methodology

Technavio presents a detailed picture of the market by way of study, synthesis, and summation of data from multiple sources. The analysts have presented the various facets of the market with a particular focus on identifying the key industry influencers. The data thus presented is comprehensive, reliable, and the result of extensive research, both primary and secondary.

INFORMATION SOURCES

Primary sources

  • Manufacturers and suppliers
  • Channel partners
  • Industry experts
  • Strategic decision makers

Secondary sources

  • Industry journals and periodicals
  • Government data
  • Financial reports of key industry players
  • Historical data
  • Press releases

DATA ANALYSIS

Data Synthesis

  • Collation of data
  • Estimation of key figures
  • Analysis of derived insights

Data Validation

  • Triangulation with data models
  • Reference against proprietary databases
  • Corroboration with industry experts

REPORT WRITING

Qualitative

  • Market drivers
  • Market challenges
  • Market trends
  • Five forces analysis

Quantitative

  • Market size and forecast
  • Market segmentation
  • Geographical insights
  • Competitive landscape

Interested in this report?

Get your sample now to see our research methodology and insights!

Download Now

Frequently Asked Questions

US Food Service market growth will increase by USD 10214.0 billion during 2026-2030.

The US Food Service market is expected to grow at a CAGR of 51.8% during 2026-2030.

US Food Service market is segmented by Type (Fast food service, Restaurant, Cafes and bars, Delivery and takeaway, Others) Solution (Conventional, Centralized, Ready-prepared, Assembly-serve) Sector (Commercial, Non-commercial) Business segment (Chains, Independent)

American Dairy Queen Corp., Chick fil A Inc., Chipotle Mexican Grill Inc., Dominos Pizza Inc., Five Guys Enterprises LLC, Inspire Brands Inc., Jack in the Box Inc., Jersey Mikes Franchise Systems, Jimmy Johns Franchisor SPV LLC, McDonald Corp., MTY Food Group Inc., Papa Johns International Inc., Penn Station Inc., Pret A Manger, Restaurant Brands Inc., Starbucks Corp., The Subway Group, The Wendys Co., YUM Brands Inc. are a few of the key vendors in the US Food Service market.

North America will register the highest growth rate of 100% among the other regions. Therefore, the US Food Service market in North America is expected to garner significant business opportunities for the vendors during the forecast period.

US

  • Increased snacking and indulgence consumption is the driving factor this market.

The US Food Service market vendors should focus on grabbing business opportunities from the Type segment as it accounted for the largest market share in the base year.
RIA - Research AI Assistant
Ask RIA