Frozen Fish And Seafood Market Analysis Europe, APAC, North America, South America, Middle East and Africa - US, France, Germany, China, Spain - Size and Forecast 2024-2028

Frozen Fish And Seafood Market Analysis Europe, APAC, North America, South America, Middle East and Africa - US, France, Germany, China, Spain - Size and Forecast 2024-2028

Published: Aug 2024 168 Pages SKU: IRTNTR45449

Market Overview at a Glance

$34.6 B
Market Opportunity
8.07%
CAGR
7.26
YoY growth 2023-2024(%)

Frozen Fish And Seafood Market Size 2024-2028

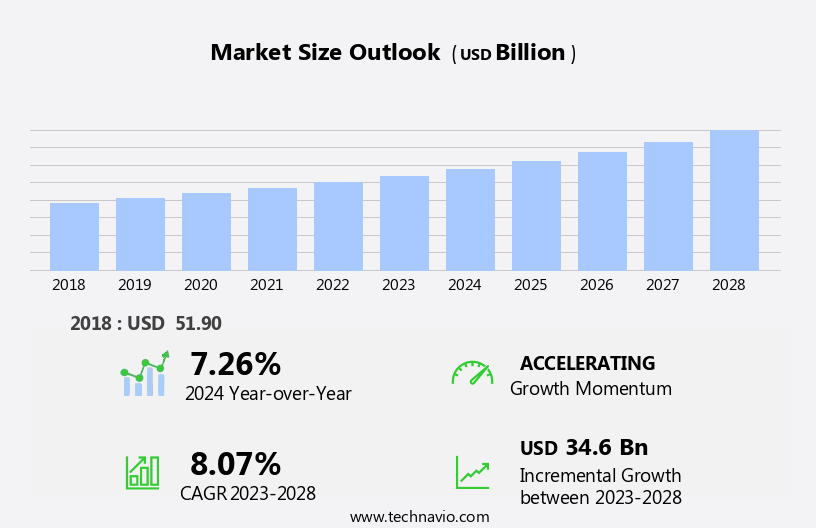
The frozen fish and seafood market size is forecast to increase by USD 34.6 billion at a CAGR of 8.07% between 2023 and 2028.

  • The market is experiencing significant growth, driven by the increasing demand for convenience and innovation in packaging solutions. Consumers are increasingly turning to frozen fish and seafood as a convenient alternative to fresh options, particularly in regions with limited access to fresh seafood or for those seeking to reduce food waste. Moreover, advancements in frozen food technology have led to improved packaging methods, ensuring the preservation of taste, texture, and nutritional value. However, this market is not without challenges. Stiff competition from fresh and canned fish and seafood presents a significant hurdle for market growth.
  • Consumers often perceive fresh options to be of higher quality and more authentic in taste. Additionally, the perception of frozen food as less healthy than fresh alternatives can limit market penetration. Companies in the market must focus on addressing these consumer perceptions through targeted marketing and product innovation to capitalize on the growing demand for convenience and expand their market share.

What will be the Size of the Frozen Fish And Seafood Market during the forecast period?

Frozen Fish And Seafood Market Size

 Request Free Sample

  • The market in the United States is a dynamic and expanding sector, driven by several key factors. Consumer lifestyle trends, such as health consciousness and convenience, have fueled the demand for high-quality, convenient, and time-saving food options. The market's size is substantial, with a significant portion of seafood and fish being consumed in frozen form. Microorganisms and food wastage are critical considerations in the frozen fish and seafood industry. Premium seafood companies are investing in advanced technologies to ensure the freshness and safety of their products. Culinary applications, such as meal planning and culinary experimentation, continue to drive innovation in the market.
  • The frozen seafood products segment, including fish, shellfish, and aquatic delicacies, is a major contributor to the market's growth. The availability of a diverse range of offerings, from The Sirena's premium offerings to High Liner Foods' value-added options, caters to various consumer preferences and budgets. The frozen seafood market is a global industry, with export destinations spanning the globe. reports that the market is expected to grow at a steady pace, driven by increasing consumer awareness of the nutritional benefits of seafood, particularly its high protein content. The Frozen Food Leaders Association's Seafood Expo showcases the latest trends and innovations in the industry, attracting industry professionals and buyers from around the world.
  • The MRFR database and other market research providers provide valuable insights into the market's size, growth, and direction.

How is this Frozen Fish And Seafood Industry segmented?

The frozen fish and seafood industry research report provides comprehensive data (region-wise segment analysis), with forecasts and estimates in "USD billion" for the period 2024-2028, as well as historical data from 2018-2022 for the following segments.

  • End-user
    • Food processing industry
    • Food service provider
    • Retail and household
    • Animal feed and pet food
  • Distribution Channel
    • Offline
    • Online
  • Geography
    • Europe
      • France
      • Germany
      • Spain
    • APAC
      • China
    • North America
      • US
    • South America
      • Middle East and Africa

      By End-user Insights

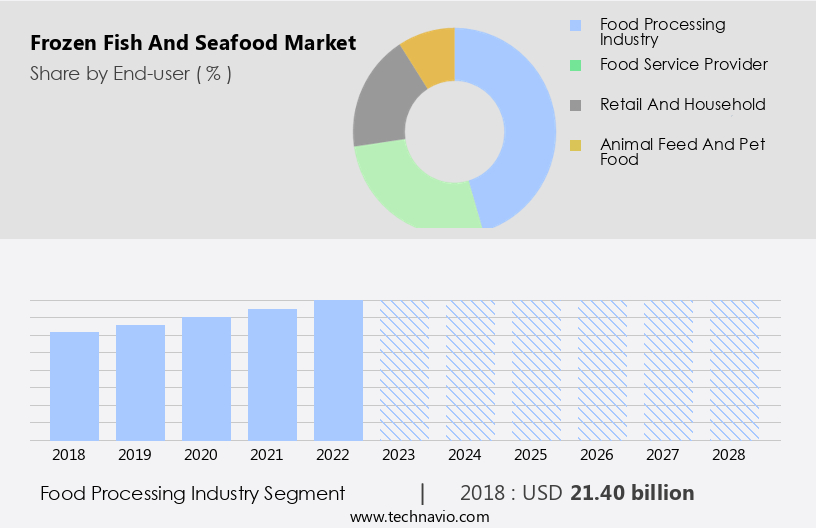
      The food processing industry segment is estimated to witness significant growth during the forecast period.

      The market encompasses the production and distribution of a diverse range of products, including fish fillets, shrimp, surimi, and crab meat. Processing techniques involve freezing, canning, packaging, and value-additions like marination, breading, and seasoning. This segment significantly contributes to market growth, transforming raw seafood into convenient, ready-to-eat options. Food processing companies prioritize innovation in processing technologies, sustainable practices, and new product development to cater to health-conscious consumers and regulatory requirements. Microorganisms are carefully managed during processing to ensure food safety assurance. Sustainability is a key focus, with companies adhering to sustainable fishing practices, eco-friendly fishing methods, and minimizing seafood wastage.

      Shelf life is extended through packaging technologies, preserving the nutritious qualities of aquatic delicacies. Essential nutrients, such as minerals, proteins, vitamins, and omega-3 fatty acids, are preserved, making seafood a nutritious option. Culinary innovations and convenience are driving factors, with time-saving food options and convenience stores increasing the availability of frozen seafood products. Frozen fish and seafood companies cater to various retail channels, including departmental stores, B2B, and export destinations. Consumer lifestyles and demand for sustainable, lower-priced options have led to the growth of the market. The industry also includes the production of frozen mollusks, pre-cooked seafood, and ready-to-eat seafood.

      Despite the convenience and benefits, food waste remains a concern, particularly in the raw frozen segment. The frozen food leader, High Liner Foods, and other players in the market are addressing this issue through defrosting processes and cold storage facilities.

      Frozen Fish And Seafood Market Size

      Get a glance at the market report of share of various segments Request Free Sample

      The Food processing industry segment was valued at USD 21.40 billion in 2018 and showed a gradual increase during the forecast period.

      Regional Analysis

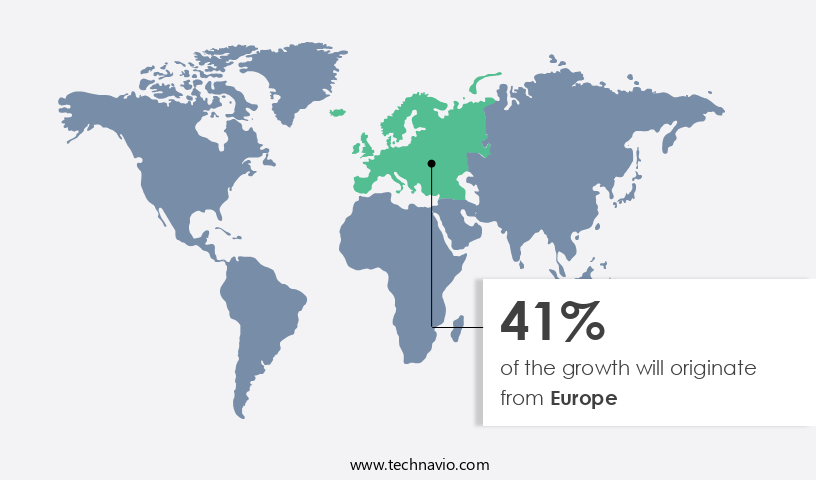
      Europe is estimated to contribute 41% to the growth of the global market during the forecast period.Technavio’s analysts have elaborately explained the regional trends and drivers that shape the market during the forecast period.

      Frozen Fish And Seafood Market Share by Geography

      For more insights on the market size of various regions, Request Free Sample

      The European the market is experiencing growth due to the increasing demand for nutritious and sustainable seafood options. This trend is driven by consumer lifestyles that prioritize health consciousness and responsible food choices. Sustainability is a key factor in the market, with a focus on sustainable fishing practices and eco-friendly production methods. Seafood Expo events and fish farming bodies promote sustainable seafood options, reducing seafood wastage and ensuring food safety assurance. High Liner Foods and other frozen food leaders offer diverse product offerings, including frozen fish, mollusks, and crustaceans, with varying protein content and essential nutrients like omega-3 fatty acids.

      Shelf life and packaging technologies enable the availability of time-saving food options for busy consumers. Culinary innovations and convenience have led to the popularity of pre-cooked seafood and ready-to-eat options. The market is subject to regulatory requirements and consumer expectations for transparency and traceability. Food safety concerns and product recalls have increased the importance of food safety assurance and the use of powder seaweed extracts as natural preservatives. Sustainable practices, such as cold storage facilities and transportation infrastructure, are essential to maintaining the quality and freshness of frozen seafood products. Despite these advancements, challenges remain, including food waste in the raw frozen segment and the need for defrosting processes.

      The market is also influenced by environmental issues and the availability of shellfish and other aquatic delicacies in underdeveloped countries. Overall, the European the market is a dynamic and evolving industry, driven by consumer preferences and the need for sustainable and health-conscious options.

      Market Dynamics

      Our researchers analyzed the data with 2023 as the base year, along with the key drivers, trends, and challenges. A holistic analysis of drivers will help companies refine their marketing strategies to gain a competitive advantage.

      What are the key market drivers leading to the rise in the adoption of Frozen Fish And Seafood Industry?

      • Growing desire for convenience is the key driver of the market. 

      • The demand for convenience foods, including frozen fish and seafood, is on the rise due to the busy lifestyles of consumers. companies in this market recognize the importance of convenience in making their products appealing to consumers, who are increasingly opting for packaged items. Whitefish species such as pollock, Alaska pollock, and pangasius are popular choices for convenience food products. Advancements in refrigeration technology, the growing number of single-person and smaller households, and an increasing number of working women contribute to the increasing demand for these types of convenient food options.

      What are the market trends shaping the Frozen Fish And Seafood Industry?

      • Innovation in frozen fish and seafood packaging is the upcoming market trend. 

      • The market is experiencing significant growth due to the increasing consumer preference for protein-rich, nutrient-dense foods. Seafood's high content of vitamins, minerals, and essential fatty acids has made it a popular choice for health-conscious consumers. To maintain the quality and freshness of fish and seafood, proper packaging is essential. This not only prevents spoilage but also attracts consumers with its eye-catching designs. In fact, companies are recognizing the importance of packaging in the market and offering various frozen fish and seafood options in appealing packaging.
      • For instance, Lidl, a leading retailer, introduced eco-friendly packaging made from ocean-bound plastic in February 2020 for their seafood products in the UK. This innovative approach not only benefits the environment but also caters to consumers' demand for sustainable and high-quality seafood.

      What challenges does the Frozen Fish And Seafood Industry face during its growth?

      • Stiff competition from fresh and canned fish and seafood is a key challenge affecting the industry growth. 

      • The market is experiencing significant growth due to increasing health consciousness and the convenience offered by these products. Consumers prefer frozen and canned fish and seafood for their long shelf life and ease of use. However, the perception that frozen food lacks the nutritional value of fresh produce is a challenge for market growth. indicates a global trend towards healthier eating, with a rise in the incidence of health issues such as diabetes, allergies, digestive disorders, and obesity. This shift in consumer behavior is driving demand for convenient, nutritious food options, including frozen fish and seafood.
      • Despite the convenience and long shelf life, consumers often view frozen fish and seafood as less fresh than their fresh counterparts. However, advancements in freezing technology have significantly improved the quality and nutritional value of frozen fish and seafood, making them a viable alternative to fresh produce. In , the market is poised for growth due to increasing health consciousness, convenience, and advancements in freezing technology. While the perception of frozen food as less fresh remains a challenge, ongoing research and innovation in the industry are addressing this concern, making frozen fish and seafood a popular and nutritious choice for consumers.

      Exclusive Customer Landscape

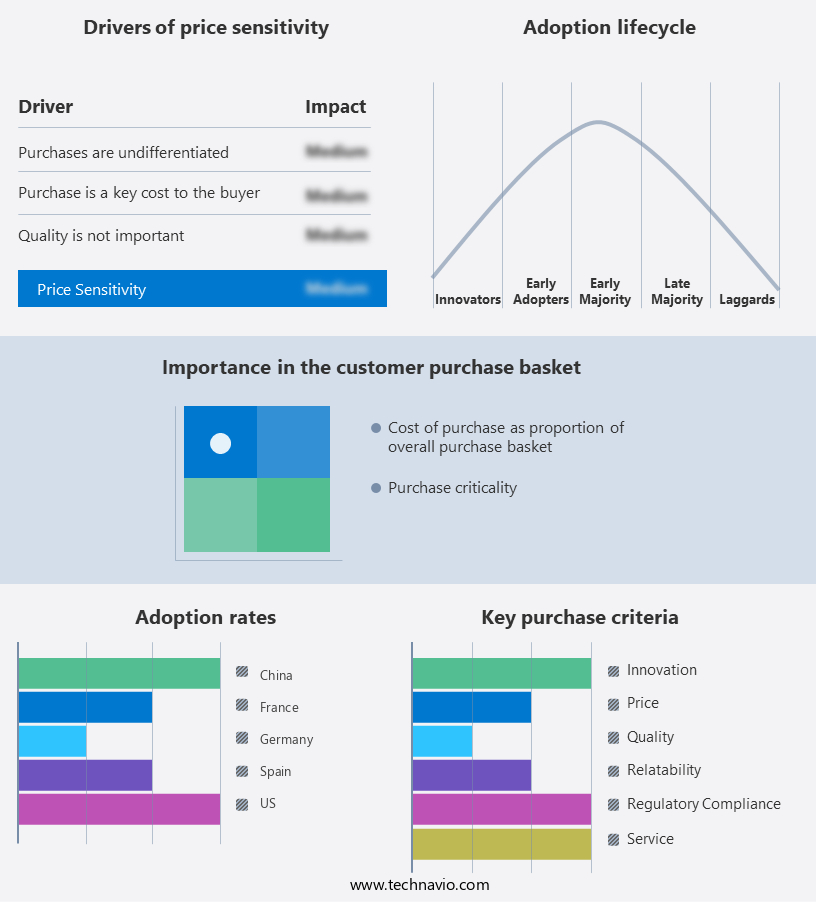
      The frozen fish and seafood market forecasting report includes the adoption lifecycle of the market, covering from the innovator’s stage to the laggard’s stage. It focuses on adoption rates in different regions based on penetration. Furthermore, the frozen fish and seafood market report also includes key purchase criteria and drivers of price sensitivity to help companies evaluate and develop their market growth analysis strategies.

      Frozen Fish And Seafood Market Share by Geography

       Customer Landscape

      Key Companies & Market Insights

      Companies are implementing various strategies, such as strategic alliances, frozen fish and seafood market forecast, partnerships, mergers and acquisitions, geographical expansion, and product/service launches, to enhance their presence in the industry.

      Austevoll Seafood ASA - The company specializes in the distribution of high-quality frozen fish and seafood, including salmon, catering to discerning consumers seeking authentic, sustainably sourced options. Our extensive selection ensures versatility for various culinary applications, providing a premium dining experience at home.

      The industry research and growth report includes detailed analyses of the competitive landscape of the market and information about key companies, including:

      • Austevoll Seafood ASA
      • Faroese Seafood
      • Freiremar SA
      • Grieg Seafood ASA
      • Lee Fish
      • Lee Fishing Co.
      • Metro Seafood Ltd.
      • Midseas Ltd.
      • Mowi ASA
      • Nutreco N.V.
      • Ocean Fresh Seafood
      • Pescafresh
      • Seattle Fish Co.
      • Surapon Foods Public Co. Ltd.
      • Tassal Group
      • Tesco Plc
      • Trident Seafoods Corp.
      • Tropic Star Seafood Inc.
      • True World Foods LLC
      • Wm Morrison Supermarkets Ltd.

      Qualitative and quantitative analysis of companies has been conducted to help clients understand the wider business environment as well as the strengths and weaknesses of key industry players. Data is qualitatively analyzed to categorize companies as pure play, category-focused, industry-focused, and diversified; it is quantitatively analyzed to categorize companies as dominant, leading, strong, tentative, and weak.

      Research Analyst Overview

      The market continues to experience significant growth due to the increasing demand for responsible food choices and nutritious options. Sustainability is a key factor driving this trend, as consumers become more conscious of the impact of their dietary decisions on ocean ecosystems. Frozen fish and seafood offer several advantages over fresh alternatives. Their longer shelf life allows for greater availability and accessibility, reducing food wastage. Additionally, advancements in packaging technologies and transportation methods enable the preservation of essential nutrients, including minerals and vitamins. The frozen fish market is diverse, encompassing a wide range of species from microorganisms to larger aquatic delicacies.

      Frozen mollusks, crustaceans, and fish are popular choices, providing a rich source of protein and omega-3 fatty acids. Sustainable practices, such as eco-friendly fishing and fish farming, are increasingly important considerations for both producers and consumers. Consumer lifestyles have also influenced the market. Convenience is a major factor, with ready-to-eat and pre-cooked options becoming increasingly popular. Time-saving food options cater to busy consumers, while meal planning and culinary innovations offer new and exciting ways to incorporate frozen seafood into daily meals. Regulatory requirements and food safety assurance are essential aspects of the market. Ensuring compliance with regulatory standards and implementing food safety measures are crucial for maintaining consumer trust and confidence.

      The market is a dynamic and competitive landscape. Leading companies are investing in sustainable practices, innovative packaging technologies, and culinary applications to differentiate themselves from competitors. databases provide valuable insights into production capacity, consumer trends, and competitive landscape. Despite the many advantages of frozen fish and seafood, challenges remain. Food safety concerns and product recalls can negatively impact consumer trust and market growth. Sustainable sourcing and responsible production methods are essential to mitigate these risks and maintain the long-term viability of the market. In , the market is a dynamic and growing industry, driven by consumer demand for nutritious, sustainable, and convenient food options.

      Advancements in technology and transportation infrastructure, combined with a focus on responsible sourcing and production, will continue to shape the market's future.

      Market Scope

      Report Coverage

      Details

      Page number

      168

      Base year

      2023

      Historic period

      2018-2022

      Forecast period

      2024-2028

      Growth momentum & CAGR

      Accelerate at a CAGR of 8.07%

      Market growth 2024-2028

      USD 34.6 billion

      Market structure

      Fragmented

      YoY growth 2023-2024(%)

      7.26

      Key countries

      US, France, Germany, China, and Spain

      Competitive landscape

      Leading Companies, Market Positioning of Companies, Competitive Strategies, and Industry Risks

      Request Free Sample

      What are the Key Data Covered in this Frozen Fish And Seafood Market Research and Growth Report?

      • CAGR of the Frozen Fish And Seafood industry during the forecast period
      • Detailed information on factors that will drive the growth and forecasting between 2024 and 2028
      • Precise estimation of the size of the market and its contribution of the industry in focus to the parent market
      • Accurate predictions about upcoming growth and trends and changes in consumer behaviour
      • Growth of the market across Europe, APAC, North America, South America, and Middle East and Africa
      • Thorough analysis of the market’s competitive landscape and detailed information about companies
      • Comprehensive analysis of factors that will challenge the frozen fish and seafood market growth of industry companies

      We can help! Our analysts can customize this frozen fish and seafood market research report to meet your requirements.

      Get in touch


      1 Executive Summary

      • 1.1 Market overview
        • Executive Summary - Chart on Market Overview
        • Executive Summary - Data Table on Market Overview
        • Executive Summary - Chart on Global Market Characteristics
        • Executive Summary - Chart on Market by Geography
        • Executive Summary - Chart on Market Segmentation by End-user
        • Executive Summary - Chart on Market Segmentation by Distribution Channel
        • Executive Summary - Chart on Incremental Growth
        • Executive Summary - Data Table on Incremental Growth
        • Executive Summary - Chart on Company Market Positioning

      2 Market Landscape

      • 2.1 Market ecosystem
        • Parent Market
        • Data Table on - Parent Market
      • 2.2 Market characteristics
        • Market characteristics analysis
      • 2.3 Value chain analysis
        • Value Chain Analysis

      3 Market Sizing

      • 3.1 Market definition
        • Offerings of companies included in the market definition
      • 3.2 Market segment analysis
        • Market segments
      • 3.3 Market size 2023
        • 3.4 Market outlook: Forecast for 2023-2028
          • Chart on Global - Market size and forecast 2023-2028 ($ billion)
          • Data Table on Global - Market size and forecast 2023-2028 ($ billion)
          • Chart on Global Market: Year-over-year growth 2023-2028 (%)
          • Data Table on Global Market: Year-over-year growth 2023-2028 (%)

        4 Historic Market Size

        • 4.1 Global Frozen Fish And Seafood Market 2018 - 2022
          • Historic Market Size - Data Table on Global Frozen Fish And Seafood Market 2018 - 2022 ($ billion)
        • 4.2 End-user segment analysis 2018 - 2022
          • Historic Market Size - End-user Segment 2018 - 2022 ($ billion)
        • 4.3 Distribution Channel segment analysis 2018 - 2022
          • Historic Market Size - Distribution Channel Segment 2018 - 2022 ($ billion)
        • 4.4 Geography segment analysis 2018 - 2022
          • Historic Market Size - Geography Segment 2018 - 2022 ($ billion)
        • 4.5 Country segment analysis 2018 - 2022
          • Historic Market Size - Country Segment 2018 - 2022 ($ billion)

        5 Five Forces Analysis

        • 5.1 Five forces summary
          • Five forces analysis - Comparison between 2023 and 2028
        • 5.2 Bargaining power of buyers
          • Bargaining power of buyers - Impact of key factors 2023 and 2028
        • 5.3 Bargaining power of suppliers
          • Bargaining power of suppliers - Impact of key factors in 2023 and 2028
        • 5.4 Threat of new entrants
          • Threat of new entrants - Impact of key factors in 2023 and 2028
        • 5.5 Threat of substitutes
          • Threat of substitutes - Impact of key factors in 2023 and 2028
        • 5.6 Threat of rivalry
          • Threat of rivalry - Impact of key factors in 2023 and 2028
        • 5.7 Market condition
          • Chart on Market condition - Five forces 2023 and 2028

        6 Market Segmentation by End-user

        • 6.1 Market segments
          • Chart on End-user - Market share 2023-2028 (%)
          • Data Table on End-user - Market share 2023-2028 (%)
        • 6.2 Comparison by End-user
          • Chart on Comparison by End-user
          • Data Table on Comparison by End-user
        • 6.3 Food processing industry - Market size and forecast 2023-2028
          • Chart on Food processing industry - Market size and forecast 2023-2028 ($ billion)
          • Data Table on Food processing industry - Market size and forecast 2023-2028 ($ billion)
          • Chart on Food processing industry - Year-over-year growth 2023-2028 (%)
          • Data Table on Food processing industry - Year-over-year growth 2023-2028 (%)
        • 6.4 Food service provider - Market size and forecast 2023-2028
          • Chart on Food service provider - Market size and forecast 2023-2028 ($ billion)
          • Data Table on Food service provider - Market size and forecast 2023-2028 ($ billion)
          • Chart on Food service provider - Year-over-year growth 2023-2028 (%)
          • Data Table on Food service provider - Year-over-year growth 2023-2028 (%)
        • 6.5 Retail and household - Market size and forecast 2023-2028
          • Chart on Retail and household - Market size and forecast 2023-2028 ($ billion)
          • Data Table on Retail and household - Market size and forecast 2023-2028 ($ billion)
          • Chart on Retail and household - Year-over-year growth 2023-2028 (%)
          • Data Table on Retail and household - Year-over-year growth 2023-2028 (%)
        • 6.6 Animal feed and pet food - Market size and forecast 2023-2028
          • Chart on Animal feed and pet food - Market size and forecast 2023-2028 ($ billion)
          • Data Table on Animal feed and pet food - Market size and forecast 2023-2028 ($ billion)
          • Chart on Animal feed and pet food - Year-over-year growth 2023-2028 (%)
          • Data Table on Animal feed and pet food - Year-over-year growth 2023-2028 (%)
        • 6.7 Market opportunity by End-user
          • Market opportunity by End-user ($ billion)
          • Data Table on Market opportunity by End-user ($ billion)

        7 Market Segmentation by Distribution Channel

        • 7.1 Market segments
          • Chart on Distribution Channel - Market share 2023-2028 (%)
          • Data Table on Distribution Channel - Market share 2023-2028 (%)
        • 7.2 Comparison by Distribution Channel
          • Chart on Comparison by Distribution Channel
          • Data Table on Comparison by Distribution Channel
        • 7.3 Offline - Market size and forecast 2023-2028
          • Chart on Offline - Market size and forecast 2023-2028 ($ billion)
          • Data Table on Offline - Market size and forecast 2023-2028 ($ billion)
          • Chart on Offline - Year-over-year growth 2023-2028 (%)
          • Data Table on Offline - Year-over-year growth 2023-2028 (%)
        • 7.4 Online - Market size and forecast 2023-2028
          • Chart on Online - Market size and forecast 2023-2028 ($ billion)
          • Data Table on Online - Market size and forecast 2023-2028 ($ billion)
          • Chart on Online - Year-over-year growth 2023-2028 (%)
          • Data Table on Online - Year-over-year growth 2023-2028 (%)
        • 7.5 Market opportunity by Distribution Channel
          • Market opportunity by Distribution Channel ($ billion)
          • Data Table on Market opportunity by Distribution Channel ($ billion)

        8 Customer Landscape

        • 8.1 Customer landscape overview
          • Analysis of price sensitivity, lifecycle, customer purchase basket, adoption rates, and purchase criteria

        9 Geographic Landscape

        • 9.1 Geographic segmentation
          • Chart on Market share by geography 2023-2028 (%)
          • Data Table on Market share by geography 2023-2028 (%)
        • 9.2 Geographic comparison
          • Chart on Geographic comparison
          • Data Table on Geographic comparison
        • 9.3 Europe - Market size and forecast 2023-2028
          • Chart on Europe - Market size and forecast 2023-2028 ($ billion)
          • Data Table on Europe - Market size and forecast 2023-2028 ($ billion)
          • Chart on Europe - Year-over-year growth 2023-2028 (%)
          • Data Table on Europe - Year-over-year growth 2023-2028 (%)
        • 9.4 APAC - Market size and forecast 2023-2028
          • Chart on APAC - Market size and forecast 2023-2028 ($ billion)
          • Data Table on APAC - Market size and forecast 2023-2028 ($ billion)
          • Chart on APAC - Year-over-year growth 2023-2028 (%)
          • Data Table on APAC - Year-over-year growth 2023-2028 (%)
        • 9.5 North America - Market size and forecast 2023-2028
          • Chart on North America - Market size and forecast 2023-2028 ($ billion)
          • Data Table on North America - Market size and forecast 2023-2028 ($ billion)
          • Chart on North America - Year-over-year growth 2023-2028 (%)
          • Data Table on North America - Year-over-year growth 2023-2028 (%)
        • 9.6 South America - Market size and forecast 2023-2028
          • Chart on South America - Market size and forecast 2023-2028 ($ billion)
          • Data Table on South America - Market size and forecast 2023-2028 ($ billion)
          • Chart on South America - Year-over-year growth 2023-2028 (%)
          • Data Table on South America - Year-over-year growth 2023-2028 (%)
        • 9.7 Middle East and Africa - Market size and forecast 2023-2028
          • Chart on Middle East and Africa - Market size and forecast 2023-2028 ($ billion)
          • Data Table on Middle East and Africa - Market size and forecast 2023-2028 ($ billion)
          • Chart on Middle East and Africa - Year-over-year growth 2023-2028 (%)
          • Data Table on Middle East and Africa - Year-over-year growth 2023-2028 (%)
        • 9.8 US - Market size and forecast 2023-2028
          • Chart on US - Market size and forecast 2023-2028 ($ billion)
          • Data Table on US - Market size and forecast 2023-2028 ($ billion)
          • Chart on US - Year-over-year growth 2023-2028 (%)
          • Data Table on US - Year-over-year growth 2023-2028 (%)
        • 9.9 France - Market size and forecast 2023-2028
          • Chart on France - Market size and forecast 2023-2028 ($ billion)
          • Data Table on France - Market size and forecast 2023-2028 ($ billion)
          • Chart on France - Year-over-year growth 2023-2028 (%)
          • Data Table on France - Year-over-year growth 2023-2028 (%)
        • 9.10 Germany - Market size and forecast 2023-2028
          • Chart on Germany - Market size and forecast 2023-2028 ($ billion)
          • Data Table on Germany - Market size and forecast 2023-2028 ($ billion)
          • Chart on Germany - Year-over-year growth 2023-2028 (%)
          • Data Table on Germany - Year-over-year growth 2023-2028 (%)
        • 9.11 China - Market size and forecast 2023-2028
          • Chart on China - Market size and forecast 2023-2028 ($ billion)
          • Data Table on China - Market size and forecast 2023-2028 ($ billion)
          • Chart on China - Year-over-year growth 2023-2028 (%)
          • Data Table on China - Year-over-year growth 2023-2028 (%)
        • 9.12 Spain - Market size and forecast 2023-2028
          • Chart on Spain - Market size and forecast 2023-2028 ($ billion)
          • Data Table on Spain - Market size and forecast 2023-2028 ($ billion)
          • Chart on Spain - Year-over-year growth 2023-2028 (%)
          • Data Table on Spain - Year-over-year growth 2023-2028 (%)
        • 9.13 Market opportunity by geography
          • Market opportunity by geography ($ billion)
          • Data Tables on Market opportunity by geography ($ billion)

        10 Drivers, Challenges, and Opportunity/Restraints

        • 10.1 Market drivers
          • 10.2 Market challenges
            • 10.3 Impact of drivers and challenges
              • Impact of drivers and challenges in 2023 and 2028
            • 10.4 Market opportunities/restraints

              11 Competitive Landscape

              • 11.1 Overview
                • 11.2 Competitive Landscape
                  • Overview on criticality of inputs and factors of differentiation
                • 11.3 Landscape disruption
                  • Overview on factors of disruption
                • 11.4 Industry risks
                  • Impact of key risks on business

                12 Competitive Analysis

                • 12.1 Companies profiled
                  • Companies covered
                • 12.2 Market positioning of companies
                  • Matrix on companies position and classification
                • 12.3 Austevoll Seafood ASA
                  • Austevoll Seafood ASA - Overview
                  • Austevoll Seafood ASA - Business segments
                  • Austevoll Seafood ASA - Key offerings
                  • Austevoll Seafood ASA - Segment focus
                • 12.4 Faroese Seafood
                  • Faroese Seafood - Overview
                  • Faroese Seafood - Product / Service
                  • Faroese Seafood - Key offerings
                • 12.5 Freiremar SA
                  • Freiremar SA - Overview
                  • Freiremar SA - Product / Service
                  • Freiremar SA - Key offerings
                • 12.6 Grieg Seafood ASA
                  • Grieg Seafood ASA - Overview
                  • Grieg Seafood ASA - Business segments
                  • Grieg Seafood ASA - Key offerings
                  • Grieg Seafood ASA - Segment focus
                • 12.7 Lee Fish
                  • Lee Fish - Overview
                  • Lee Fish - Product / Service
                  • Lee Fish - Key offerings
                • 12.8 Lee Fishing Co.
                  • Lee Fishing Co. - Overview
                  • Lee Fishing Co. - Product / Service
                  • Lee Fishing Co. - Key offerings
                • 12.9 Metro Seafood Ltd.
                  • Metro Seafood Ltd. - Overview
                  • Metro Seafood Ltd. - Product / Service
                  • Metro Seafood Ltd. - Key offerings
                • 12.10 Midseas Ltd.
                  • Midseas Ltd. - Overview
                  • Midseas Ltd. - Product / Service
                  • Midseas Ltd. - Key offerings
                • 12.11 Mowi ASA
                  • Mowi ASA - Overview
                  • Mowi ASA - Business segments
                  • Mowi ASA - Key offerings
                  • Mowi ASA - Segment focus
                • 12.12 Nutreco N.V.
                  • Nutreco N.V. - Overview
                  • Nutreco N.V. - Product / Service
                  • Nutreco N.V. - Key offerings
                • 12.13 Ocean Fresh Seafood
                  • Ocean Fresh Seafood - Overview
                  • Ocean Fresh Seafood - Product / Service
                  • Ocean Fresh Seafood - Key offerings
                • 12.14 Seattle Fish Co.
                  • Seattle Fish Co. - Overview
                  • Seattle Fish Co. - Product / Service
                  • Seattle Fish Co. - Key offerings
                • 12.15 Tesco Plc
                  • Tesco Plc - Overview
                  • Tesco Plc - Business segments
                  • Tesco Plc - Key news
                  • Tesco Plc - Key offerings
                  • Tesco Plc - Segment focus
                • 12.16 True World Foods LLC
                  • True World Foods LLC - Overview
                  • True World Foods LLC - Product / Service
                  • True World Foods LLC - Key offerings
                • 12.17 Wm Morrison Supermarkets Ltd.
                  • Wm Morrison Supermarkets Ltd. - Overview
                  • Wm Morrison Supermarkets Ltd. - Product / Service
                  • Wm Morrison Supermarkets Ltd. - Key offerings

                13 Appendix

                • 13.1 Scope of the report
                  • 13.2 Inclusions and exclusions checklist
                    • Inclusions checklist
                    • Exclusions checklist
                  • 13.3 Currency conversion rates for US$
                    • Currency conversion rates for US$
                  • 13.4 Research methodology
                    • Research methodology
                  • 13.5 Data procurement
                    • Information sources
                  • 13.6 Data validation
                    • Data validation
                  • 13.7 Validation techniques employed for market sizing
                    • Validation techniques employed for market sizing
                  • 13.8 Data synthesis
                    • Data synthesis
                  • 13.9 360 degree market analysis
                    • 360 degree market analysis
                  • 13.10 List of abbreviations
                    • List of abbreviations

                  Research Methodology

                  Technavio presents a detailed picture of the market by way of study, synthesis, and summation of data from multiple sources. The analysts have presented the various facets of the market with a particular focus on identifying the key industry influencers. The data thus presented is comprehensive, reliable, and the result of extensive research, both primary and secondary.

                  INFORMATION SOURCES

                  Primary sources

                  • Manufacturers and suppliers
                  • Channel partners
                  • Industry experts
                  • Strategic decision makers

                  Secondary sources

                  • Industry journals and periodicals
                  • Government data
                  • Financial reports of key industry players
                  • Historical data
                  • Press releases

                  DATA ANALYSIS

                  Data Synthesis

                  • Collation of data
                  • Estimation of key figures
                  • Analysis of derived insights

                  Data Validation

                  • Triangulation with data models
                  • Reference against proprietary databases
                  • Corroboration with industry experts

                  REPORT WRITING

                  Qualitative

                  • Market drivers
                  • Market challenges
                  • Market trends
                  • Five forces analysis

                  Quantitative

                  • Market size and forecast
                  • Market segmentation
                  • Geographical insights
                  • Competitive landscape

                  Interested in this report?

                  Get your sample now to see our research methodology and insights!

                  Download Now

                  Frequently Asked Questions

                  Frozen Fish And Seafood market growth will increase by $ 34.6 bn during 2024-2028.

                  The Frozen Fish And Seafood market is expected to grow at a CAGR of 8.07% during 2024-2028.

                  Frozen Fish And Seafood market is segmented by End-user( Food processing industry, Food service provider, Retail and household, Animal feed and pet food) Distribution Channel( Offline, Online, North America, South America, MEA)

                  Austevoll Seafood ASA, Faroese Seafood, Freiremar SA, Grieg Seafood ASA, Lee Fish, Lee Fishing Co., Metro Seafood Ltd., Midseas Ltd., Mowi ASA, Nutreco N.V., Ocean Fresh Seafood, Pescafresh, Seattle Fish Co., Surapon Foods Public Co. Ltd., Tassal Group, Tesco Plc, Trident Seafoods Corp., Tropic Star Seafood Inc., True World Foods LLC, Wm Morrison Supermarkets Ltd. are a few of the key vendors in the Frozen Fish And Seafood market.

                  Europe will register the highest growth rate of 41% among the other regions. Therefore, the Frozen Fish And Seafood market in Europe is expected to garner significant business opportunities for the vendors during the forecast period.

                  US, France, Germany, China, Spain

                  • Growing desire for convenienceThe increasingly hectic lifestyles of consumers make them prefer ready-to-eat meals is the driving factor this market.
                  • which can reduce the preparation or cooking time and clean-up time. Convenience is a key factor that is frequently considered by frozen fish and seafood vendors to increase the relevance of their products to consumers is the driving factor this market.
                  • as the majority of consumers look for convenience when opting for any packaged product. The whitefish species that are often used as convenience food products are pollock is the driving factor this market.
                  • Alaska pollock is the driving factor this market.
                  • and pangasius.  With the advancements in refrigeration techniques is the driving factor this market.
                  • a rising number of single-person and smaller households is the driving factor this market.
                  • and a rising number of working women is the driving factor this market.
                  • the demand for convenience foods like frozen fish and seafood is increasing. Moreover is the driving factor this market.
                  • frozen fish and seafood vendors offer convenience in terms of handling and preparation and provide a broad range of options in terms of flavors and recipes and also in desired portions or sizes.  Although the frozen fish and seafood market in China is traditionally dominated by fresh produce is the driving factor this market.
                  • the aforementioned factors provide an opportunity for frozen seafood vendors to grow. However is the driving factor this market.
                  • the vendors should communicate the positive benefits of the long shelf life of frozen fish and seafood to their customers. In more developed markets such as North America and Europe is the driving factor this market.
                  • convenience needs are well established is the driving factor this market.
                  • and shortcuts that enable faster cooking from scratch will become more important in the future. The focus of the frozen fish and seafood industry in developed markets is the driving factor this market.
                  • therefore is the driving factor this market.
                  • must be toward overcoming outdated perceptions of foods with long shelf life. Thus is the driving factor this market.
                  • growing consumer desire for convenient and ready-to-eat meals is expected to drive the growth of the global frozen fish and seafood market during the forecast period. is the driving factor this market.

                  The Frozen Fish And Seafood market vendors should focus on grabbing business opportunities from the Food processing industry segment as it accounted for the largest market share in the base year.