Functional Food Market Analysis, Size, and Forecast 2024-2028: North America (US, Canada, and Mexico), Europe (France, Germany, and UK), Middle East and Africa (UAE), APAC (China, India, Indonesia, Japan, Malaysia, South Korea, and Thailand), South America (Brazil), and Rest of World (ROW)

Functional Food Market Analysis, Size, and Forecast 2024-2028:
North America (US, Canada, and Mexico), Europe (France, Germany, and UK), Middle East and Africa (UAE), APAC (China, India, Indonesia, Japan, Malaysia, South Korea, and Thailand), South America (Brazil), and Rest of World (ROW)

Published: Jan 2024 165 Pages SKU: IRTNTR77201

Market Overview at a Glance

$127.46 B
Market Opportunity
7.66%
CAGR
6.8
YoY growth 2023-2024(%)

Functional Food Market Size 2024-2028

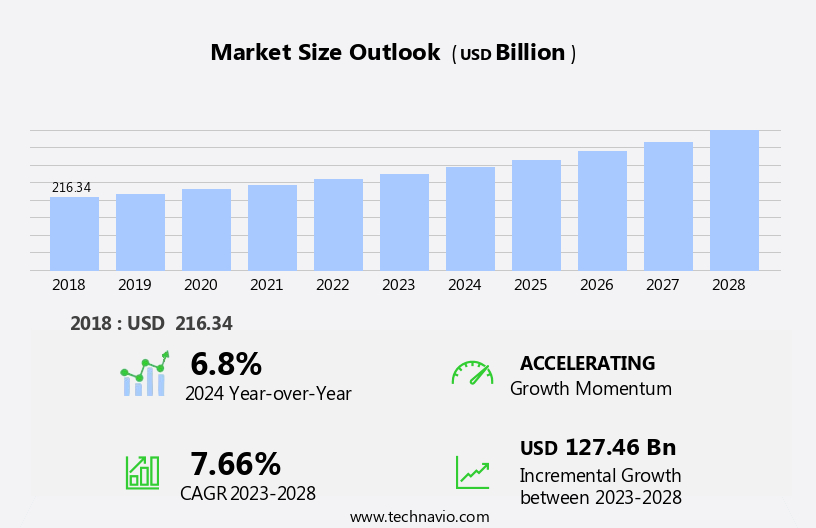
The functional food market size is forecast to increase by USD 127.46 billion, at a CAGR of 7.66% between 2023 and 2028.

  • The market is experiencing significant growth, driven by the rising health consciousness among consumers. The increasing awareness of the benefits of functional foods, such as improved immunity, energy, and overall health and wellness, is leading to a surge in demand. Furthermore, the emergence of personalized nutrition is transforming the market landscape, as consumers seek tailored food solutions to meet their unique health needs. However, the high cost of functional foods remains a notable challenge. Despite this, opportunities abound for companies that can effectively address affordability concerns and offer innovative, high-quality products. By staying attuned to consumer preferences and leveraging advanced technologies, market players can capitalize on the growing demand for functional foods and navigate the cost challenge.
  • Overall, the market's strategic landscape is characterized by a focus on innovation, affordability, and consumer-centric solutions. Companies that can successfully navigate these dynamics will be well-positioned to capitalize on the market's potential and drive long-term growth.

What will be the Size of the Functional Food Market during the forecast period?

Functional Food Market Size

Explore in-depth regional segment analysis with market size data - historical 2018-2022 and forecasts 2024-2028 - in the full report.  
Request Free Sample

The market continues to evolve, driven by consumer demand for nutritious and health-promoting foods. Nutraceutical compounds, such as vitamin enrichment and plant-based protein sources, play a significant role in this dynamic landscape. Fermented foods, with their gut microbiome modulating properties, are gaining popularity for their cholesterol-lowering effects and antioxidant capacity. Prebiotic fibers and mineral supplementation are essential components, enhancing the nutritional value of food and supporting digestive health. Food matrix effects and protein fortification are crucial considerations in the development of functional foods. Immune system support and nutritional labeling regulations are also key areas of focus, ensuring transparency and consumer trust.

Bioactive peptides and probiotic supplements offer additional health benefits, contributing to the ongoing unfolding of market activities. Shelf-life extension methods and food safety standards are essential to maintain product quality and consumer safety. Polyphenol extraction and phytonutrient content are areas of research, aiming to optimize the nutritional value of functional foods. Gut microbiota composition, blood sugar regulation, weight management support, cognitive function enhancement, and consumer perception studies are all evolving areas of interest. Functional ingredients, such as omega-3 fatty acids and fortified foods, are integrated into various food processing technologies to cater to diverse consumer preferences and dietary needs.Personalized nutrition and quality control procedures are becoming increasingly important, reflecting the continuous dynamism of the market.

How is this Functional Food Industry segmented?

The functional food industry research report provides comprehensive data (region-wise segment analysis), with forecasts and estimates in "USD billion" for the period 2024-2028, as well as historical data from 2018-2022 for the following segments.

  • Distribution Channel
    • Offline
    • Online
  • Product Type
    • Dairy products
    • Bakery and cereals
    • Meat/fish and egg
    • Soy products and others
  • Consumer Segment
    • Health-Conscious Consumers
    • Athletes
    • General Consumers
  • Ingredient
    • Probiotics
    • Prebiotics
    • Omega-3
    • Vitamins and Minerals
  • Geography
    • North America
      • US
      • Canada
      • Mexico
    • Europe
      • France
      • Germany
      • UK
    • Middle East and Africa
      • UAE
    • APAC
      • China
      • India
      • Indonesia
      • Japan
      • Malaysia
      • South Korea
      • Thailand
    • South America
      • Brazil
    • Rest of World (ROW)

By Distribution Channel Insights

The offline segment is estimated to witness significant growth during the forecast period.

The market trends revolve around nutraceutical compounds and vitamin enrichment, with an increasing focus on fermented foods for gut microbiome modulation and cholesterol-lowering effects. Plant-based protein sources are gaining popularity for their antioxidant capacity and immune system support. Prebiotic fibers and mineral supplementation are essential for health claim substantiation, while sensory evaluation methods ensure digestive health benefits and food matrix effects. Protein fortification and fiber optimization are key strategies for enhancing cognitive function and supporting weight management. Personalized nutrition and quality control procedures are essential for catering to diverse consumer needs.

Functional ingredients, such as omega-3 fatty acids, polyphenols, and phytonutrients, are extracted using advanced food processing technologies. Probiotic supplements and bioactive peptides contribute to shelf-life extension and food safety standards. Consumer perception studies and cardiovascular health benefits are critical areas of research, with a growing emphasis on blood sugar regulation and cognitive function enhancement.

Functional Food Market Size

Request Free Sample

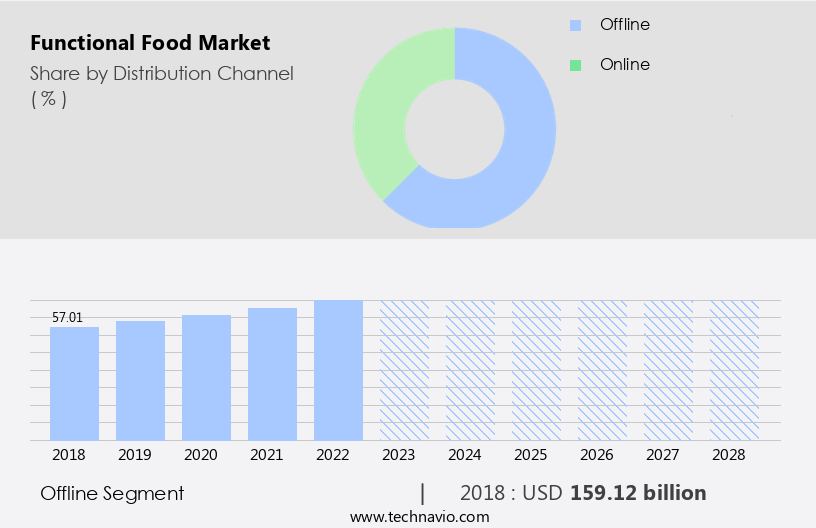
The Offline segment was valued at USD 159.12 billion in 2018 and showed a gradual increase during the forecast period.

Regional Analysis

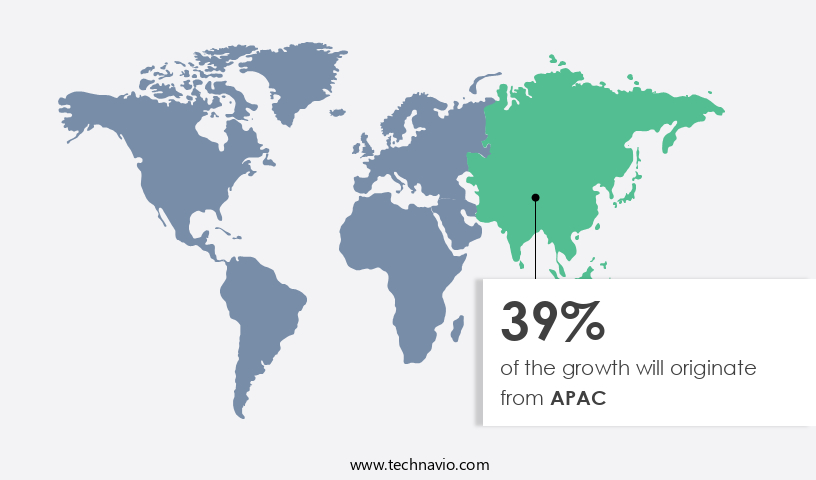
APAC is estimated to contribute 39% to the growth of the global market during the forecast period.Technavio's analysts have elaborately explained the regional trends and drivers that shape the market during the forecast period.

Functional Food Market Share by Geography

 Request Free Sample

The market in Asia Pacific (APAC) is witnessing significant growth due to the increasing preference for healthier food options and rising disposable incomes. Functional foods, which include nutraceutical compounds, vitamin enrichment, fermented foods, and plant-based protein sources and protein supplement , among others, are gaining popularity for their digestive health benefits, cardiovascular health benefits, and immune system support. These foods are also known to regulate blood sugar levels, manage weight, and enhance cognitive function. Natural fermented foods, with their gut microbiome modulation and cholesterol-lowering effects, are particularly in demand. Prebiotic fibers and probiotic supplements are also popular for their role in maintaining a healthy gut microbiota composition.

Mineral supplementation and health claim substantiation are essential considerations for manufacturers to ensure regulatory compliance and consumer trust. Sensory evaluation methods play a crucial role in the development and marketing of functional foods. Food matrix effects and protein fortification are key areas of focus for food processing technologies to optimize nutritional value and extend shelf life. Polyphenol extraction and phytonutrient content are also essential factors for manufacturers to highlight in their marketing efforts. Consumer perception studies are essential to understand the evolving preferences and trends in the market. Quality control procedures and food safety standards are non-negotiable for manufacturers to maintain consumer trust and adhere to regulatory requirements.

Bioactive peptides and omega-3 fatty acids are among the functional ingredients that are gaining popularity for their health benefits. Fortified foods are also becoming increasingly common as consumers seek convenient ways to incorporate functional foods into their diets.

Market Dynamics

Our researchers analyzed the data with 2023 as the base year, along with the key drivers, trends, and challenges. A holistic analysis of drivers will help companies refine their marketing strategies to gain a competitive advantage.

B2B functional food supply solutions leverage advanced fortification technologies for health benefits. Functional food market growth opportunities 2025 include functional foods for wellness and probiotic functional foods, meeting demand. Functional food supply chain software optimizes operations, while functional food market competitive analysis highlights key brands. Sustainable functional food practices align with eco-friendly food trends. Functional food regulations 2024-2028 shapes functional food demand in North America 2025. Premium functional food solutions and functional food market insights boost adoption. Functional foods for snacks and customized functional food products target niches. Functional food market challenges and solutions address consumer trust, with direct procurement strategies for functional foods and functional food pricing optimization enhancing profitability. Data-driven functional food analytics and health-focused food trends drive innovation.

What are the key market drivers leading to the rise in the adoption of Functional Food Industry?

  • The surge in health consciousness serves as the primary catalyst for market growth.  The market is experiencing significant growth due to increasing consumer awareness and demand for foods that offer additional health benefits. These consumers prioritize foods that go beyond basic nutritional value, focusing on immunity, weight management, digestion, and heart health. Instead of viewing food as a means to treat illnesses, there is a growing preference for using it as a preventative measure. Functional food ingredients, such as probiotics, omega-3 fatty acids, antioxidants, prebiotics, and dietary fibers, are increasingly popular for their ability to enhance a food's nutritional profile and provide various health advantages.
  • Nutraceutical compounds, vitamin enrichment, fermented foods, gut microbiome modulation, cholesterol-lowering effects, plant-based protein sources, and mineral supplementation are some areas of focus within the market. The demand for these foods is driven by the desire for a healthier lifestyle and the belief that food can contribute to disease prevention.

What are the market trends shaping the Functional Food Industry?

  • Personalized nutrition is an emerging market trend, with increasing recognition for the importance of individualized dietary plans based on unique nutritional needs and preferences.
  • The market experiences continuous growth due to increasing consumer awareness and demand for foods that offer specific health benefits. Personalization is a significant trend driving market expansion, with companies tailoring products based on individual health needs and preferences. This approach involves considering factors such as genetics, lifestyle, and health objectives to create targeted functional food formulations. Advancements in technology, including genetic testing and data analytics, enable manufacturers to gain insights into consumers' nutritional requirements. These insights facilitate the development of functional foods that address specific health concerns, optimize performance, and promote overall well-being. Health claim substantiation plays a crucial role in the market, with sensory evaluation methods and nutritional labeling regulations ensuring product efficacy and transparency.
  • Protein fortification, immune system support, and digestive health benefits are popular functional food categories, while bioactive peptides and probiotic supplements are gaining traction due to their health advantages. Manufacturers focus on creating harmonious food matrices that preserve the bioactivity of functional ingredients while maintaining sensory appeal. Consumers increasingly prioritize personalized nutrition, seeking products that cater to their unique health objectives and align with their preferences. This trend is expected to continue fueling the growth of the market.

What challenges does the Functional Food Industry face during its growth?

  • The escalating costs of producing functional foods pose a significant challenge to the industry's growth trajectory. 
  • Functional foods, recognized for their health benefits beyond basic nutrition, continue to gain traction in the global market. Shelf-life extension methods and adherence to food safety standards are crucial factors driving the industry's growth. Polyphenol extraction and preservation of phytonutrient content are essential for maintaining the functional properties of these foods. Functional foods contribute to various health benefits, such as supporting blood sugar regulation, weight management, and cognitive function enhancement. Consumer perception studies indicate a positive shift towards these foods, recognizing their role in promoting overall wellness. However, the high prices associated with functional foods pose a challenge to their widespread adoption.
  • The complex production process, including ingredient sourcing, extraction, and transportation, contributes significantly to the cost. As a result, functional foods are priced 30% to 500% higher than their conventional counterparts. This premium pricing may deter price-sensitive consumers, limiting market accessibility to a broader demographic. Despite these challenges, the potential health benefits continue to attract consumers seeking to improve their overall well-being.

Exclusive Customer Landscape

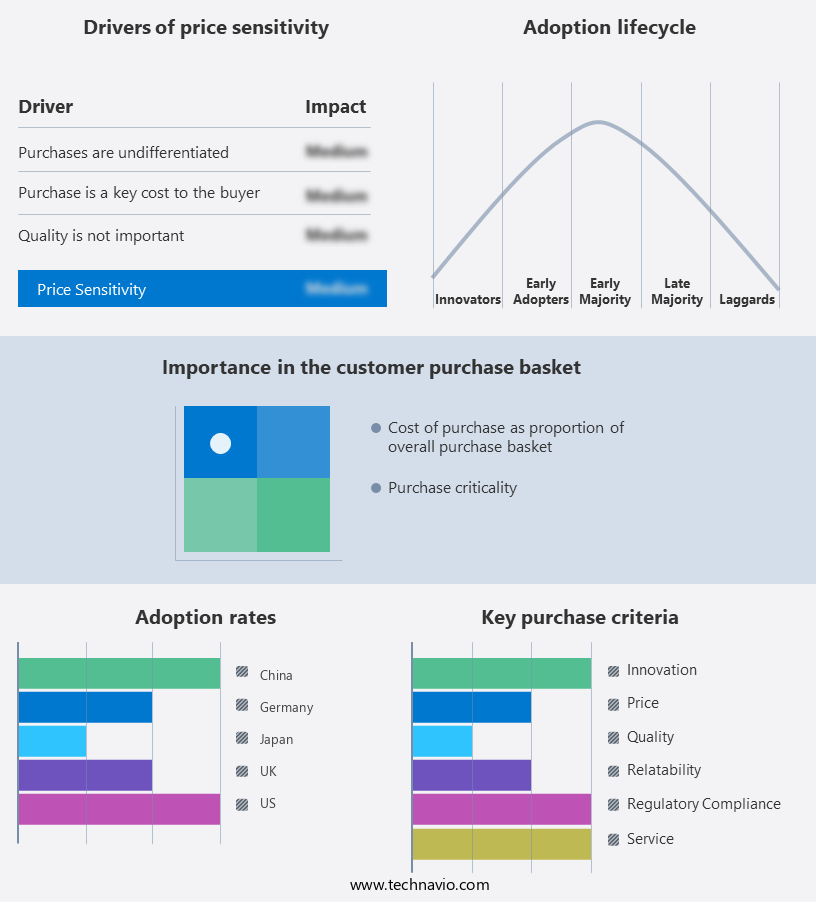
The functional food market forecasting report includes the adoption lifecycle of the market, covering from the innovator's stage to the laggard's stage. It focuses on adoption rates in different regions based on penetration. Furthermore, the functional food market report also includes key purchase criteria and drivers of price sensitivity to help companies evaluate and develop their market growth analysis strategies.

Functional Food Market Share by Geography

 Customer Landscape

Key Companies & Market Insights

Companies are implementing various strategies, such as strategic alliances, functional food market forecast, partnerships, mergers and acquisitions, geographical expansion, and product/service launches, to enhance their presence in the industry.

Abbott Laboratories - This company specializes in functional food products, including high protein nutritional pudding under the brand Ensure and Similac Soy Isomil. These offerings cater to diverse nutritional needs, showcasing the firm's commitment to innovation and consumer health.

The industry research and growth report includes detailed analyses of the competitive landscape of the market and information about key companies, including:

  • Abbott Laboratories
  • Archer Daniels Midland Co.
  • Arla Foods amba
  • Campbell Soup Co.
  • Cargill Inc.
  • Conagra Brands Inc.
  • Danone SA
  • General Mills Inc.
  • Good Source Foods Inc.
  • Hildur Functional Foods Pvt. Ltd.
  • Kellogg Co.
  • Laird Superfood Inc.
  • Meiji Holdings Co. Ltd.
  • Mondelez International Inc.
  • Nestle SA
  • PepsiCo Inc.
  • Raisio plc
  • Roquette Freres SA
  • The Coca Cola Co.
  • Tyson Foods Inc.
  • Unilever PLC

Qualitative and quantitative analysis of companies has been conducted to help clients understand the wider business environment as well as the strengths and weaknesses of key industry players. Data is qualitatively analyzed to categorize companies as pure play, category-focused, industry-focused, and diversified; it is quantitatively analyzed to categorize companies as dominant, leading, strong, tentative, and weak.

Recent Development and News in Functional Food Market

  • In January 2024, Danone Manifesto Ventures, the venture capital arm of Danone, announced a strategic investment in Ripple Foods, a plant-based food company, to expand its presence in the market. This investment aimed to accelerate Ripple's growth in the plant-based milk category (Danone Manifesto Ventures Press Release).
  • In March 2024, Nestlé and Starbucks signed a strategic partnership to expand Nestlé's Starbucks-branded coffee and tea products globally. This collaboration represented a significant expansion for both companies in the market, with Nestlé leveraging Starbucks' brand recognition and extensive retail network (Nestlé Press Release).
  • In May 2024, PepsiCo completed the acquisition of Bare Foods, a leading producer of fruit and veggie chips, for USD200 million. This acquisition strengthened PepsiCo's position in the market, particularly in the better-for-you snacks category, as consumers increasingly sought healthier alternatives (Bloomberg).
  • In April 2025, the European Commission approved the use of the term "probiotics" as a health claim for certain foods, marking a key regulatory approval for the functional food industry. This approval opened up new opportunities for companies to market their functional foods with probiotic health claims in Europe (European Commission Press Release).

Research Analyst Overview

  • In the market, product development lifecycle is a critical factor in bringing new offerings to consumers. Microbial contamination and formulation optimization are key considerations in ensuring food safety and maintaining product quality. Food safety hazards necessitate rigorous testing and adherence to health claims regulations. Encapsulation technologies and delivery systems enable better bioavailability of health-promoting compounds, while nutritional profile analysis and sensory characterization aid in product differentiation. Supply chain management and ingredient sourcing are essential for maintaining consistent quality and ensuring the availability of bioactive components. Shelf stability testing and packaging technologies are crucial for preserving functional food benefits.
  • Dosage optimization and bioavailability studies are important for understanding ingredient interactions and maximizing the health-promoting effects. Market positioning strategies and flavor compounds are key elements in targeting specific consumer segments. Sensory attributes and texture analysis are important in consumer acceptance testing. Synergistic effects of various ingredients and clinical trial data are valuable in developing new functional food products. Food preservation techniques and health claims regulations continue to evolve, requiring ongoing formulation optimization and regulatory compliance. Ingredient interactions and sensory characterization are ongoing considerations in product development. Packaging technologies and shelf stability testing are essential for maintaining product quality and extending shelf life.
  • In summary, the market is dynamic, with ongoing product development, regulatory compliance, and consumer preferences shaping market trends. Companies must focus on formulation optimization, food safety, and sensory attributes to differentiate their offerings and meet consumer demands. Encapsulation technologies, ingredient sourcing, and delivery systems are important considerations for ensuring product quality and efficacy.

Dive into Technavio's robust research methodology, blending expert interviews, extensive data synthesis, and validated models for unparalleled Functional Food Market insights. See full methodology.

Market Scope

Report Coverage

Details

Page number

165

Base year

2023

Historic period

2018-2022

Forecast period

2024-2028

Growth momentum & CAGR

Accelerate at a CAGR of 7.66%

Market growth 2024-2028

USD 127.46 billion

Market structure

Fragmented

YoY growth 2023-2024(%)

6.8

Key countries

US, Malaysia, Indonesia, Germany, UK, South Korea, France, Canada, Brazil, Thailand, UAE, Mexico, China, Japan, and India

Competitive landscape

Leading Companies, Market Positioning of Companies, Competitive Strategies, and Industry Risks

Request Free Sample

What are the Key Data Covered in this Functional Food Market Research and Growth Report?

  • CAGR of the Functional Food industry during the forecast period
  • Detailed information on factors that will drive the growth and forecasting between 2024 and 2028
  • Precise estimation of the size of the market and its contribution of the industry in focus to the parent market
  • Accurate predictions about upcoming growth and trends and changes in consumer behaviour
  • Growth of the market across APAC, North America, Europe, South America, and Middle East and Africa
  • Thorough analysis of the market's competitive landscape and detailed information about companies
  • Comprehensive analysis of factors that will challenge the functional food market growth of industry companies

We can help! Our analysts can customize this functional food market research report to meet your requirements.

Get in touch

1 Executive Summary

  • 1.1 Market overview
    • Exhibit 01: Executive Summary – Chart on Market Overview
    • Exhibit 02: Executive Summary – Data Table on Market Overview
    • Exhibit 03: Executive Summary – Chart on Global Market Characteristics
    • Exhibit 04: Executive Summary – Chart on Market by Geography
    • Exhibit 05: Executive Summary – Chart on Market Segmentation by Distribution Channel
    • Exhibit 06: Executive Summary – Chart on Market Segmentation by Product Type
    • Exhibit 07: Executive Summary – Chart on Incremental Growth
    • Exhibit 08: Executive Summary – Data Table on Incremental Growth
    • Exhibit 09: Executive Summary – Chart on Vendor Market Positioning

2 Market Landscape

  • 2.1 Market ecosystem
    • Exhibit 10: Parent market
    • Exhibit 11: Market Characteristics

3 Market Sizing

  • 3.1 Market definition
    • Exhibit 12: Offerings of vendors included in the market definition
  • 3.2 Market segment analysis
    • Exhibit 13: Market segments
  • 3.3 Market size 2023
    • 3.4 Market outlook: Forecast for 2023-2028
      • Exhibit 14: Chart on Global - Market size and forecast 2023-2028 ($ billion)
      • Exhibit 15: Data Table on Global - Market size and forecast 2023-2028 ($ billion)
      • Exhibit 16: Chart on Global Market: Year-over-year growth 2023-2028 (%)
      • Exhibit 17: Data Table on Global Market: Year-over-year growth 2023-2028 (%)

    4 Historic Market Size

    • 4.1 Global functional food market 2018 - 2022
      • Exhibit 18: Historic Market Size – Data Table on global functional food market 2018 - 2022 ($ billion)
    • 4.2 Distribution Channel Segment Analysis 2018 - 2022
      • Exhibit 19: Historic Market Size – Distribution Channel Segment 2018 - 2022 ($ billion)
    • 4.3 Product Type Segment Analysis 2018 - 2022
      • Exhibit 20: Historic Market Size – Product Type Segment 2018 - 2022 ($ billion)
    • 4.4 Geography Segment Analysis 2018 - 2022
      • Exhibit 21: Historic Market Size – Geography Segment 2018 - 2022 ($ billion)
    • 4.5 Country Segment Analysis 2018 - 2022
      • Exhibit 22: Historic Market Size – Country Segment 2018 - 2022 ($ billion)

    5 Five Forces Analysis

    • 5.1 Five forces summary
      • Exhibit 23: Five forces analysis - Comparison between 2023 and 2028
    • 5.2 Bargaining power of buyers
      • Exhibit 24: Chart on Bargaining power of buyers – Impact of key factors 2023 and 2028
    • 5.3 Bargaining power of suppliers
      • Exhibit 25: Bargaining power of suppliers – Impact of key factors in 2023 and 2028
    • 5.4 Threat of new entrants
      • Exhibit 26: Threat of new entrants – Impact of key factors in 2023 and 2028
    • 5.5 Threat of substitutes
      • Exhibit 27: Threat of substitutes – Impact of key factors in 2023 and 2028
    • 5.6 Threat of rivalry
      • Exhibit 28: Threat of rivalry – Impact of key factors in 2023 and 2028
    • 5.7 Market condition
      • Exhibit 29: Chart on Market condition - Five forces 2023 and 2028

    6 Market Segmentation by Distribution Channel

    • 6.1 Market segments
      • Chart on Distribution Channel - Market share (2023-2028) (%)
      • Data Table on Distribution Channel - Market share (2023-2028) (%)
    • 6.2 Comparison by Distribution Channel
      • Chart on Comparison by Distribution Channel
      • Data Table on Comparison by Distribution Channel
    • 6.3 Offline - Market size and forecast (2023-2028)
      • Chart on Offline - Market size and forecast (2023-2028) ($ billion)
      • Data Table on Offline - Market size and forecast (2023-2028) ($ billion)
      • Chart on Offline - Year-over-year growth (2023-2028) (%)
      • Data Table on Offline - Year-over-year growth (2023-2028) (%)
    • 6.4 Online - Market size and forecast (2023-2028)
      • Chart on Online - Market size and forecast (2023-2028) ($ billion)
      • Data Table on Online - Market size and forecast (2023-2028) ($ billion)
      • Chart on Online - Year-over-year growth (2023-2028) (%)
      • Data Table on Online - Year-over-year growth (2023-2028) (%)
    • 6.5 Market opportunity by Distribution Channel
      • Market opportunity by Distribution Channel ($ billion)
      • Data Table on Market opportunity by Distribution Channel ($ billion)

    7 Market Segmentation by Product Type

    • 7.1 Market segments
      • Chart on Product Type - Market share (2023-2028) (%)
      • Data Table on Product Type - Market share (2023-2028) (%)
    • 7.2 Comparison by Product Type
      • Chart on Comparison by Product Type
      • Data Table on Comparison by Product Type
    • 7.3 Dairy products - Market size and forecast (2023-2028)
      • Chart on Dairy products - Market size and forecast (2023-2028) ($ billion)
      • Data Table on Dairy products - Market size and forecast (2023-2028) ($ billion)
      • Chart on Dairy products - Year-over-year growth (2023-2028) (%)
      • Data Table on Dairy products - Year-over-year growth (2023-2028) (%)
    • 7.4 Bakery and cereals - Market size and forecast (2023-2028)
      • Chart on Bakery and cereals - Market size and forecast (2023-2028) ($ billion)
      • Data Table on Bakery and cereals - Market size and forecast (2023-2028) ($ billion)
      • Chart on Bakery and cereals - Year-over-year growth (2023-2028) (%)
      • Data Table on Bakery and cereals - Year-over-year growth (2023-2028) (%)
    • 7.5 Meat/fish and egg - Market size and forecast (2023-2028)
      • Chart on Meat/fish and egg - Market size and forecast (2023-2028) ($ billion)
      • Data Table on Meat/fish and egg - Market size and forecast (2023-2028) ($ billion)
      • Chart on Meat/fish and egg - Year-over-year growth (2023-2028) (%)
      • Data Table on Meat/fish and egg - Year-over-year growth (2023-2028) (%)
    • 7.6 Soy products and others - Market size and forecast (2023-2028)
      • Chart on Soy products and others - Market size and forecast (2023-2028) ($ billion)
      • Data Table on Soy products and others - Market size and forecast (2023-2028) ($ billion)
      • Chart on Soy products and others - Year-over-year growth (2023-2028) (%)
      • Data Table on Soy products and others - Year-over-year growth (2023-2028) (%)
    • 7.7 Market opportunity by Product Type
      • Market opportunity by Product Type ($ billion)
      • Data Table on Market opportunity by Product Type ($ billion)

    8 Market Segmentation by Consumer Segment

    • 8.1 Market segments
      • Chart on Consumer Segment - Market share (2023-2028) (%)
      • Data Table on Consumer Segment - Market share (2023-2028) (%)
    • 8.2 Comparison by Consumer Segment
      • Chart on Comparison by Consumer Segment
      • Data Table on Comparison by Consumer Segment
    • 8.3 Health-Conscious Consumers - Market size and forecast (2023-2028)
      • Chart on Health-Conscious Consumers - Market size and forecast (2023-2028) ($ billion)
      • Data Table on Health-Conscious Consumers - Market size and forecast (2023-2028) ($ billion)
      • Chart on Health-Conscious Consumers - Year-over-year growth (2023-2028) (%)
      • Data Table on Health-Conscious Consumers - Year-over-year growth (2023-2028) (%)
    • 8.4 Athletes - Market size and forecast (2023-2028)
      • Chart on Athletes - Market size and forecast (2023-2028) ($ billion)
      • Data Table on Athletes - Market size and forecast (2023-2028) ($ billion)
      • Chart on Athletes - Year-over-year growth (2023-2028) (%)
      • Data Table on Athletes - Year-over-year growth (2023-2028) (%)
    • 8.5 General Consumers - Market size and forecast (2023-2028)
      • Chart on General Consumers - Market size and forecast (2023-2028) ($ billion)
      • Data Table on General Consumers - Market size and forecast (2023-2028) ($ billion)
      • Chart on General Consumers - Year-over-year growth (2023-2028) (%)
      • Data Table on General Consumers - Year-over-year growth (2023-2028) (%)
    • 8.6 Market opportunity by Consumer Segment
      • Market opportunity by Consumer Segment ($ billion)
      • Data Table on Market opportunity by Consumer Segment ($ billion)

    9 Market Segmentation by Ingredient

    • 9.1 Market segments
      • Chart on Ingredient - Market share (2023-2028) (%)
      • Data Table on Ingredient - Market share (2023-2028) (%)
    • 9.2 Comparison by Ingredient
      • Chart on Comparison by Ingredient
      • Data Table on Comparison by Ingredient
    • 9.3 Probiotics - Market size and forecast (2023-2028)
      • Chart on Probiotics - Market size and forecast (2023-2028) ($ billion)
      • Data Table on Probiotics - Market size and forecast (2023-2028) ($ billion)
      • Chart on Probiotics - Year-over-year growth (2023-2028) (%)
      • Data Table on Probiotics - Year-over-year growth (2023-2028) (%)
    • 9.4 Prebiotics - Market size and forecast (2023-2028)
      • Chart on Prebiotics - Market size and forecast (2023-2028) ($ billion)
      • Data Table on Prebiotics - Market size and forecast (2023-2028) ($ billion)
      • Chart on Prebiotics - Year-over-year growth (2023-2028) (%)
      • Data Table on Prebiotics - Year-over-year growth (2023-2028) (%)
    • 9.5 Omega-3 - Market size and forecast (2023-2028)
      • Chart on Omega-3 - Market size and forecast (2023-2028) ($ billion)
      • Data Table on Omega-3 - Market size and forecast (2023-2028) ($ billion)
      • Chart on Omega-3 - Year-over-year growth (2023-2028) (%)
      • Data Table on Omega-3 - Year-over-year growth (2023-2028) (%)
    • 9.6 Vitamins and Minerals - Market size and forecast (2023-2028)
      • Chart on Vitamins and Minerals - Market size and forecast (2023-2028) ($ billion)
      • Data Table on Vitamins and Minerals - Market size and forecast (2023-2028) ($ billion)
      • Chart on Vitamins and Minerals - Year-over-year growth (2023-2028) (%)
      • Data Table on Vitamins and Minerals - Year-over-year growth (2023-2028) (%)
    • 9.7 Market opportunity by Ingredient
      • Market opportunity by Ingredient ($ billion)
      • Data Table on Market opportunity by Ingredient ($ billion)

    8 Customer Landscape

    • 8.1 Customer landscape overview
      • Exhibit 66: Analysis of price sensitivity, lifecycle, customer purchase basket, adoption rates, and purchase criteria

    9 Geographic Landscape

    • 9.1 Geographic segmentation
      • Exhibit 67: Chart on Market share by geography 2023-2028 (%)
      • Exhibit 68: Data Table on Market share by geography 2023-2028 (%)
    • 9.2 Geographic comparison
      • Exhibit 69: Chart on Geographic comparison
      • Exhibit 70: Data Table on Geographic comparison
    • 9.3 APAC - Market size and forecast 2023-2028
      • Exhibit 71: Chart on APAC - Market size and forecast 2023-2028 ($ billion)
      • Exhibit 72: Data Table on APAC - Market size and forecast 2023-2028 ($ billion)
      • Exhibit 73: Chart on APAC - Year-over-year growth 2023-2028 (%)
      • Exhibit 74: Data Table on APAC - Year-over-year growth 2023-2028 (%)
    • 9.4 North America - Market size and forecast 2023-2028
      • Exhibit 75: Chart on North America - Market size and forecast 2023-2028 ($ billion)
      • Exhibit 76: Data Table on North America - Market size and forecast 2023-2028 ($ billion)
      • Exhibit 77: Chart on North America - Year-over-year growth 2023-2028 (%)
      • Exhibit 78: Data Table on North America - Year-over-year growth 2023-2028 (%)
    • 9.5 Europe - Market size and forecast 2023-2028
      • Exhibit 79: Chart on Europe - Market size and forecast 2023-2028 ($ billion)
      • Exhibit 80: Data Table on Europe - Market size and forecast 2023-2028 ($ billion)
      • Exhibit 81: Chart on Europe - Year-over-year growth 2023-2028 (%)
      • Exhibit 82: Data Table on Europe - Year-over-year growth 2023-2028 (%)
    • 9.6 South America - Market size and forecast 2023-2028
      • Exhibit 83: Chart on South America - Market size and forecast 2023-2028 ($ billion)
      • Exhibit 84: Data Table on South America - Market size and forecast 2023-2028 ($ billion)
      • Exhibit 85: Chart on South America - Year-over-year growth 2023-2028 (%)
      • Exhibit 86: Data Table on South America - Year-over-year growth 2023-2028 (%)
    • 9.7 Middle East and Africa - Market size and forecast 2023-2028
      • Exhibit 87: Chart on Middle East and Africa - Market size and forecast 2023-2028 ($ billion)
      • Exhibit 88: Data Table on Middle East and Africa - Market size and forecast 2023-2028 ($ billion)
      • Exhibit 89: Chart on Middle East and Africa - Year-over-year growth 2023-2028 (%)
      • Exhibit 90: Data Table on Middle East and Africa - Year-over-year growth 2023-2028 (%)
    • 9.8 US - Market size and forecast 2023-2028
      • Exhibit 91: Chart on US - Market size and forecast 2023-2028 ($ billion)
      • Exhibit 92: Data Table on US - Market size and forecast 2023-2028 ($ billion)
      • Exhibit 93: Chart on US - Year-over-year growth 2023-2028 (%)
      • Exhibit 94: Data Table on US - Year-over-year growth 2023-2028 (%)
    • 9.9 China - Market size and forecast 2023-2028
      • Exhibit 95: Chart on China - Market size and forecast 2023-2028 ($ billion)
      • Exhibit 96: Data Table on China - Market size and forecast 2023-2028 ($ billion)
      • Exhibit 97: Chart on China - Year-over-year growth 2023-2028 (%)
      • Exhibit 98: Data Table on China - Year-over-year growth 2023-2028 (%)
    • 9.10 Japan - Market size and forecast 2023-2028
      • Exhibit 99: Chart on Japan - Market size and forecast 2023-2028 ($ billion)
      • Exhibit 100: Data Table on Japan - Market size and forecast 2023-2028 ($ billion)
      • Exhibit 101: Chart on Japan - Year-over-year growth 2023-2028 (%)
      • Exhibit 102: Data Table on Japan - Year-over-year growth 2023-2028 (%)
    • 9.11 Germany - Market size and forecast 2023-2028
      • Exhibit 103: Chart on Germany - Market size and forecast 2023-2028 ($ billion)
      • Exhibit 104: Data Table on Germany - Market size and forecast 2023-2028 ($ billion)
      • Exhibit 105: Chart on Germany - Year-over-year growth 2023-2028 (%)
      • Exhibit 106: Data Table on Germany - Year-over-year growth 2023-2028 (%)
    • 9.12 UK - Market size and forecast 2023-2028
      • Exhibit 107: Chart on UK - Market size and forecast 2023-2028 ($ billion)
      • Exhibit 108: Data Table on UK - Market size and forecast 2023-2028 ($ billion)
      • Exhibit 109: Chart on UK - Year-over-year growth 2023-2028 (%)
      • Exhibit 110: Data Table on UK - Year-over-year growth 2023-2028 (%)
    • 9.13 Market opportunity by geography
      • Exhibit 111: Market opportunity by geography ($ billion)
      • Exhibit 112: Data Tables on Market opportunity by geography ($ billion)
    • 11.14 Malaysia - Market size and forecast (2023-2028)
      • Chart on Malaysia - Market size and forecast (2023-2028) ($ billion)
      • Data Table on Malaysia - Market size and forecast (2023-2028) ($ billion)
      • Chart on Malaysia - Year-over-year growth (2023-2028) (%)
      • Data Table on Malaysia - Year-over-year growth (2023-2028) (%)
    • 11.15 Indonesia - Market size and forecast (2023-2028)
      • Chart on Indonesia - Market size and forecast (2023-2028) ($ billion)
      • Data Table on Indonesia - Market size and forecast (2023-2028) ($ billion)
      • Chart on Indonesia - Year-over-year growth (2023-2028) (%)
      • Data Table on Indonesia - Year-over-year growth (2023-2028) (%)
    • 11.16 South Korea - Market size and forecast (2023-2028)
      • Chart on South Korea - Market size and forecast (2023-2028) ($ billion)
      • Data Table on South Korea - Market size and forecast (2023-2028) ($ billion)
      • Chart on South Korea - Year-over-year growth (2023-2028) (%)
      • Data Table on South Korea - Year-over-year growth (2023-2028) (%)
    • 11.17 France - Market size and forecast (2023-2028)
      • Chart on France - Market size and forecast (2023-2028) ($ billion)
      • Data Table on France - Market size and forecast (2023-2028) ($ billion)
      • Chart on France - Year-over-year growth (2023-2028) (%)
      • Data Table on France - Year-over-year growth (2023-2028) (%)
    • 11.18 Canada - Market size and forecast (2023-2028)
      • Chart on Canada - Market size and forecast (2023-2028) ($ billion)
      • Data Table on Canada - Market size and forecast (2023-2028) ($ billion)
      • Chart on Canada - Year-over-year growth (2023-2028) (%)
      • Data Table on Canada - Year-over-year growth (2023-2028) (%)
    • 11.19 Brazil - Market size and forecast (2023-2028)
      • Chart on Brazil - Market size and forecast (2023-2028) ($ billion)
      • Data Table on Brazil - Market size and forecast (2023-2028) ($ billion)
      • Chart on Brazil - Year-over-year growth (2023-2028) (%)
      • Data Table on Brazil - Year-over-year growth (2023-2028) (%)
    • 11.20 Thailand - Market size and forecast (2023-2028)
      • Chart on Thailand - Market size and forecast (2023-2028) ($ billion)
      • Data Table on Thailand - Market size and forecast (2023-2028) ($ billion)
      • Chart on Thailand - Year-over-year growth (2023-2028) (%)
      • Data Table on Thailand - Year-over-year growth (2023-2028) (%)
    • 11.21 UAE - Market size and forecast (2023-2028)
      • Chart on UAE - Market size and forecast (2023-2028) ($ billion)
      • Data Table on UAE - Market size and forecast (2023-2028) ($ billion)
      • Chart on UAE - Year-over-year growth (2023-2028) (%)
      • Data Table on UAE - Year-over-year growth (2023-2028) (%)
    • 11.22 Mexico - Market size and forecast (2023-2028)
      • Chart on Mexico - Market size and forecast (2023-2028) ($ billion)
      • Data Table on Mexico - Market size and forecast (2023-2028) ($ billion)
      • Chart on Mexico - Year-over-year growth (2023-2028) (%)
      • Data Table on Mexico - Year-over-year growth (2023-2028) (%)
    • 11.23 India - Market size and forecast (2023-2028)
      • Chart on India - Market size and forecast (2023-2028) ($ billion)
      • Data Table on India - Market size and forecast (2023-2028) ($ billion)
      • Chart on India - Year-over-year growth (2023-2028) (%)
      • Data Table on India - Year-over-year growth (2023-2028) (%)
    • 11.24 Rest of World (ROW) - Market size and forecast (2023-2028)
      • Chart on Rest of World (ROW) - Market size and forecast (2023-2028) ($ billion)
      • Data Table on Rest of World (ROW) - Market size and forecast (2023-2028) ($ billion)
      • Chart on Rest of World (ROW) - Year-over-year growth (2023-2028) (%)
      • Data Table on Rest of World (ROW) - Year-over-year growth (2023-2028) (%)

    10 Drivers, Challenges, and Trends

    • 10.1 Market drivers
      • 10.2 Market challenges
        • 10.3 Impact of drivers and challenges
          • Exhibit 113: Impact of drivers and challenges in 2023 and 2028
        • 10.4 Market trends

          11 Vendor Landscape

          • 11.1 Overview
            • 11.2 Vendor landscape
              • Exhibit 114: Overview on Criticality of inputs and Factors of differentiation
            • 11.3 Landscape disruption
              • Exhibit 115: Overview on factors of disruption
            • 11.4 Industry risks
              • Exhibit 116: Impact of key risks on business

            12 Vendor Analysis

            • 12.1 Vendors covered
              • Exhibit 117: Vendors covered
            • 12.2 Market positioning of vendors
              • Exhibit 118: Matrix on vendor position and classification
            • 12.3 Abbott Laboratories
              • Exhibit 119: Abbott Laboratories - Overview
              • Exhibit 120: Abbott Laboratories - Business segments
              • Exhibit 121: Abbott Laboratories - Key news
              • Exhibit 122: Abbott Laboratories - Key offerings
              • Exhibit 123: Abbott Laboratories - Segment focus
            • 12.4 Archer Daniels Midland Co.
              • Exhibit 124: Archer Daniels Midland Co. - Overview
              • Exhibit 125: Archer Daniels Midland Co. - Business segments
              • Exhibit 126: Archer Daniels Midland Co. - Key offerings
              • Exhibit 127: Archer Daniels Midland Co. - Segment focus
            • 12.5 Arla Foods amba
              • Exhibit 128: Arla Foods amba - Overview
              • Exhibit 129: Arla Foods amba - Business segments
              • Exhibit 130: Arla Foods amba - Key offerings
              • Exhibit 131: Arla Foods amba - Segment focus
            • 12.6 Campbell Soup Co.
              • Exhibit 132: Campbell Soup Co. - Overview
              • Exhibit 133: Campbell Soup Co. - Business segments
              • Exhibit 134: Campbell Soup Co. - Key offerings
              • Exhibit 135: Campbell Soup Co. - Segment focus
            • 12.7 Conagra Brands Inc.
              • Exhibit 136: Conagra Brands Inc. - Overview
              • Exhibit 137: Conagra Brands Inc. - Business segments
              • Exhibit 138: Conagra Brands Inc. - Key news
              • Exhibit 139: Conagra Brands Inc. - Key offerings
              • Exhibit 140: Conagra Brands Inc. - Segment focus
            • 12.8 Danone SA
              • Exhibit 141: Danone SA - Overview
              • Exhibit 142: Danone SA - Business segments
              • Exhibit 143: Danone SA - Key news
              • Exhibit 144: Danone SA - Key offerings
              • Exhibit 145: Danone SA - Segment focus
            • 12.9 General Mills Inc.
              • Exhibit 146: General Mills Inc. - Overview
              • Exhibit 147: General Mills Inc. - Business segments
              • Exhibit 148: General Mills Inc. - Key news
              • Exhibit 149: General Mills Inc. - Key offerings
              • Exhibit 150: General Mills Inc. - Segment focus
            • 12.10 Good Source Foods Inc.
              • Exhibit 151: Good Source Foods Inc. - Overview
              • Exhibit 152: Good Source Foods Inc. - Product / Service
              • Exhibit 153: Good Source Foods Inc. - Key offerings
            • 12.11 Hildur Functional Foods Pvt. Ltd.
              • Exhibit 154: Hildur Functional Foods Pvt. Ltd. - Overview
              • Exhibit 155: Hildur Functional Foods Pvt. Ltd. - Product / Service
              • Exhibit 156: Hildur Functional Foods Pvt. Ltd. - Key offerings
            • 12.12 Kellogg Co.
              • Exhibit 157: Kellogg Co. - Overview
              • Exhibit 158: Kellogg Co. - Business segments
              • Exhibit 159: Kellogg Co. - Key news
              • Exhibit 160: Kellogg Co. - Key offerings
              • Exhibit 161: Kellogg Co. - Segment focus
            • 12.13 Laird Superfood Inc.
              • Exhibit 162: Laird Superfood Inc. - Overview
              • Exhibit 163: Laird Superfood Inc. - Product / Service
              • Exhibit 164: Laird Superfood Inc. - Key offerings
            • 12.14 Mondelez International Inc.
              • Exhibit 165: Mondelez International Inc. - Overview
              • Exhibit 166: Mondelez International Inc. - Business segments
              • Exhibit 167: Mondelez International Inc. - Key news
              • Exhibit 168: Mondelez International Inc. - Key offerings
              • Exhibit 169: Mondelez International Inc. - Segment focus
            • 12.15 Nestle SA
              • Exhibit 170: Nestle SA - Overview
              • Exhibit 171: Nestle SA - Business segments
              • Exhibit 172: Nestle SA - Key news
              • Exhibit 173: Nestle SA - Key offerings
              • Exhibit 174: Nestle SA - Segment focus
            • 12.16 PepsiCo Inc.
              • Exhibit 175: PepsiCo Inc. - Overview
              • Exhibit 176: PepsiCo Inc. - Business segments
              • Exhibit 177: PepsiCo Inc. - Key news
              • Exhibit 178: PepsiCo Inc. - Key offerings
              • Exhibit 179: PepsiCo Inc. - Segment focus
            • 12.17 Unilever PLC
              • Exhibit 180: Unilever PLC - Overview
              • Exhibit 181: Unilever PLC - Business segments
              • Exhibit 182: Unilever PLC - Key news
              • Exhibit 183: Unilever PLC - Key offerings
              • Exhibit 184: Unilever PLC - Segment focus

            13 Appendix

            • 13.1 Scope of the report
              • 13.2 Inclusions and exclusions checklist
                • Exhibit 185: Inclusions checklist
                • Exhibit 186: Exclusions checklist
              • 13.3 Currency conversion rates for US$
                • Exhibit 187: Currency conversion rates for US$
              • 13.4 Research methodology
                • Exhibit 188: Research methodology
                • Exhibit 189: Validation techniques employed for market sizing
                • Exhibit 190: Information sources
              • 13.5 List of abbreviations
                • Exhibit 191: List of abbreviations

              Research Methodology

              Technavio presents a detailed picture of the market by way of study, synthesis, and summation of data from multiple sources. The analysts have presented the various facets of the market with a particular focus on identifying the key industry influencers. The data thus presented is comprehensive, reliable, and the result of extensive research, both primary and secondary.

              INFORMATION SOURCES

              Primary sources

              • Manufacturers and suppliers
              • Channel partners
              • Industry experts
              • Strategic decision makers

              Secondary sources

              • Industry journals and periodicals
              • Government data
              • Financial reports of key industry players
              • Historical data
              • Press releases

              DATA ANALYSIS

              Data Synthesis

              • Collation of data
              • Estimation of key figures
              • Analysis of derived insights

              Data Validation

              • Triangulation with data models
              • Reference against proprietary databases
              • Corroboration with industry experts

              REPORT WRITING

              Qualitative

              • Market drivers
              • Market challenges
              • Market trends
              • Five forces analysis

              Quantitative

              • Market size and forecast
              • Market segmentation
              • Geographical insights
              • Competitive landscape

              Interested in this report?

              Get your sample now to see our research methodology and insights!

              Download Now

              Frequently Asked Questions

              Functional Food market growth will increase by $ 127.46 bn during 2024-2028.

              The Functional Food market is expected to grow at a CAGR of 7.66% during 2024-2028.

              Functional Food market is segmented by Distribution Channel( Offline, Online) Product Type( Dairy products, Bakery and cereals, Meat/fish and egg, Soy products and others)

              Abbott Laboratories, Archer Daniels Midland Co., Arla Foods amba, Campbell Soup Co., Cargill Inc., Conagra Brands Inc., Danone SA, General Mills Inc., Good Source Foods Inc., Hildur Functional Foods Pvt. Ltd., Kellogg Co., Laird Superfood Inc., Meiji Holdings Co. Ltd., Mondelez International Inc., Nestle SA, PepsiCo Inc., Raisio plc, Roquette Freres SA, The Coca Cola Co., Tyson Foods Inc., Unilever PLC are a few of the key vendors in the Functional Food market.

              APAC will register the highest growth rate of 39% among the other regions. Therefore, the Functional Food market in APAC is expected to garner significant business opportunities for the vendors during the forecast period.

              US, Malaysia, Indonesia, Germany, UK, South Korea, France, Canada, Brazil, Thailand, UAE, Mexico, China, Japan, India

              • Rising health awarenessThe global functional food market is mostly driven by the growing health consciousness among consumers. People who are more concerned about their health are actively looking for foods that offer added health advantages rather than just nutrients. The demand for functional foods that provide additional health benefits such as better immunity is the driving factor this market.
              • weight management is the driving factor this market.
              • digestion is the driving factor this market.
              • and heart health has surged as a result of this trend. Instead of using food to treat illnesses is the driving factor this market.
              • consumers are becoming increasingly interested in using foods to prevent diseases. They are searching for foods that offer a variety of health advantages in addition to being delicious. Probiotics is the driving factor this market.
              • omega-3 fatty acids is the driving factor this market.
              • antioxidants is the driving factor this market.
              • prebiotics is the driving factor this market.
              • and dietary fibers are examples of functional food ingredients that can improve the nutritional profile of food besides providing certain health advantages. The increased awareness of chronic health issues has also been influenced by the growing prevalence of chronic illnesses such as diabetes is the driving factor this market.
              • obesity is the driving factor this market.
              • and cardiovascular diseases. Customers are taking a more active role in ensuring good health by making wise dietary decisions. People are actively looking for functional food ingredients that will assist them in lowering cholesterol is the driving factor this market.
              • controlling blood sugar is the driving factor this market.
              • reducing inflammation is the driving factor this market.
              • and maintaining a healthy weight. Furthermore is the driving factor this market.
              • the need for functional foods is driven by the increasing geriatric population (those aged over 65 years) across the world. Due to their increased susceptibility to chronic illnesses is the driving factor this market.
              • older people are more concerned with preserving their health and vigor. They are searching for functional foods that will enhance their overall health is the driving factor this market.
              • bone density is the driving factor this market.
              • and cognitive performance. Food companies are responding to this growing health consciousness by incorporating functional food ingredients into their food products. Functional foods are widely available in the market; they include everything from vitamins and minerals to plant extracts and bioactive substances. Additionally is the driving factor this market.
              • businesses are spending money on research and development (R and D) to find novel functional food ingredients that have specific health benefits. Thus is the driving factor this market.
              • increasing health awareness among consumers has led to higher consumption of safe is the driving factor this market.
              • functional food ingredients is the driving factor this market.
              • which will propel the growth of the global functional food market during the forecast period. is the driving factor this market.

              The Functional Food market vendors should focus on grabbing business opportunities from the Offline segment as it accounted for the largest market share in the base year.
              RIA - Research AI Assistant
              Ask RIA