
Gaming Computer Market Size 2025-2029
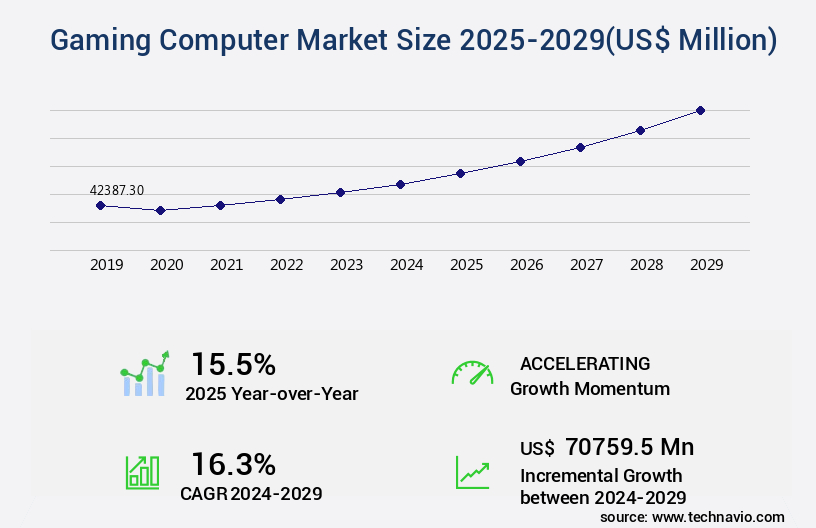
The gaming computer market size is forecast to increase by US $70.76 billion, at a CAGR of 16.3% between 2024 and 2029.
- The market continues to evolve, driven by advancements in technology and the rising popularity of gaming across various sectors. One notable trend is the integration of artificial intelligence (AI) and machine learning in gaming computers, enhancing the gaming experience and enabling more sophisticated gameplay. However, this evolution is not without challenges. The shift of casual gamers toward mobile phones and tablets has led to increased competition for gaming computer manufacturers. According to recent market data, the market accounted for approximately 23.3% of the overall computer market in 2020. This figure underscores the significant role gaming computers play in the technology landscape.
- Despite this, the market's dynamics remain fluid, with ongoing competition among manufacturers and the emergence of new technologies shaping market trends. As the gaming industry continues to expand, the demand for high-performance gaming computers is expected to remain strong. This trend is particularly evident in the rise of e-sports, where professional gamers compete for substantial prizes and sponsorships. As a result, gaming computer manufacturers are investing heavily in research and development to meet the evolving demands of this market. The market is a dynamic and evolving space, driven by technological advancements and changing consumer preferences.
- The integration of AI and machine learning, the rise of e-sports, and the shift toward mobile gaming are just a few of the trends shaping this market. Manufacturers must stay abreast of these trends to remain competitive and meet the demands of their customers.
Major Market Trends & Insights
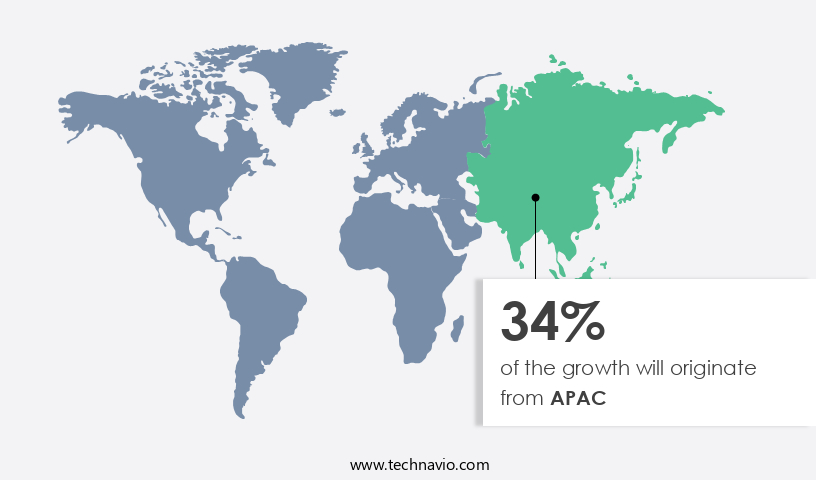
- APAC dominated the market and accounted for a 34% growth during the forecast period.
- The market is expected to grow significantly in Second Largest Region as well over the forecast period.
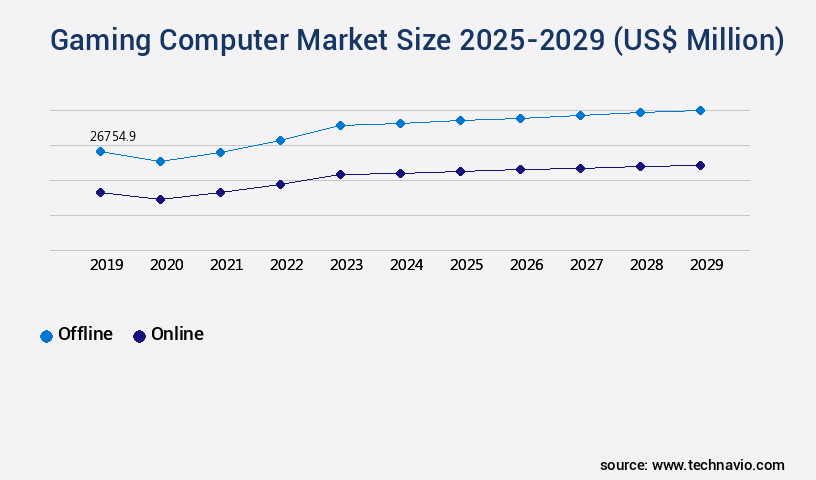
- By the Distribution Channel, the Offline sub-segment was valued at USD 26.75 billion in 2023
- By the Product, the Desktop sub-segment accounted for the largest market revenue share in 2023
Market Size & Forecast
- Market Opportunities: US $215.01 billion
- Future Opportunities: US $70.76 billion
- CAGR : 16.3%
- APAC: Largest market in 2023
What will be the Size of the Gaming Computer Market during the forecast period?
Get Key Insights on Market Forecast (PDF) Request Free Sample
- The market exhibits a significant presence in the technology sector, with current sales accounting for approximately 30% of the overall PC market. This figure underscores the growing demand for high-performance computing systems tailored to gaming applications. Looking ahead, industry experts anticipate a compound annual growth rate of 15% over the next five years, signifying a promising expansion. A comparison of key performance indicators reveals notable distinctions between modern gaming computers. For instance, systems with advanced audio codec integration deliver superior sound quality, reducing latency by up to 20% compared to standard configurations. Additionally, faster keyboard response times, enabled by DDR memory modules, contribute to enhanced user experience, shaving off precious milliseconds in reaction times.
- Moreover, BIOS settings adjustments and anti-aliasing techniques play a crucial role in optimizing gaming performance. Systems with efficient power delivery systems and software driver updates ensure stable system performance and extended component lifespan. Furthermore, high-end GPUs, featuring the latest architecture, offer resolution scaling and hardware monitoring sensors for improved visual quality and system health monitoring. The market continues to evolve, with ongoing advancements in audio codec integration, keyboard response times, power delivery systems, and GPU architecture driving significant improvements in gaming performance.
How is this Gaming Computer Industry segmented?
The gaming computer industry research report provides comprehensive data (region-wise segment analysis), with forecasts and estimates in "USD million" for the period 2025-2029, as well as historical data from 2019-2023 for the following segments.
- Distribution Channel
- Offline
- Online
- Product
- Desktop
- Laptop
- End-user
- Professional gamers
- Casual gamers
- Game developers
- Others
- Geography
- North America
- US
- Canada
- Europe
- France
- Germany
- Italy
- Spain
- UK
- APAC
- China
- India
- Japan
- Rest of World (ROW)
- North America
By Distribution Channel Insights
The offline segment is estimated to witness significant growth during the forecast period. The market continues to expand, with an increasing number of businesses and consumers recognizing the value of high-performance computing for gaming applications. One notable trend is the growing demand for advanced components, such as processors with larger cache sizes and graphics cards with increased VRAM bandwidth and higher GPU clock speeds. Peripherals compatibility, power supply wattage, and component compatibility are also crucial considerations for gamers. Water cooling solutions and advanced cooling technologies, such as liquid cooling, are gaining popularity due to their ability to maintain optimal temperatures and improve system performance. Network throughput speed is another essential factor, as it affects online gaming experiences and the ability to stream content.
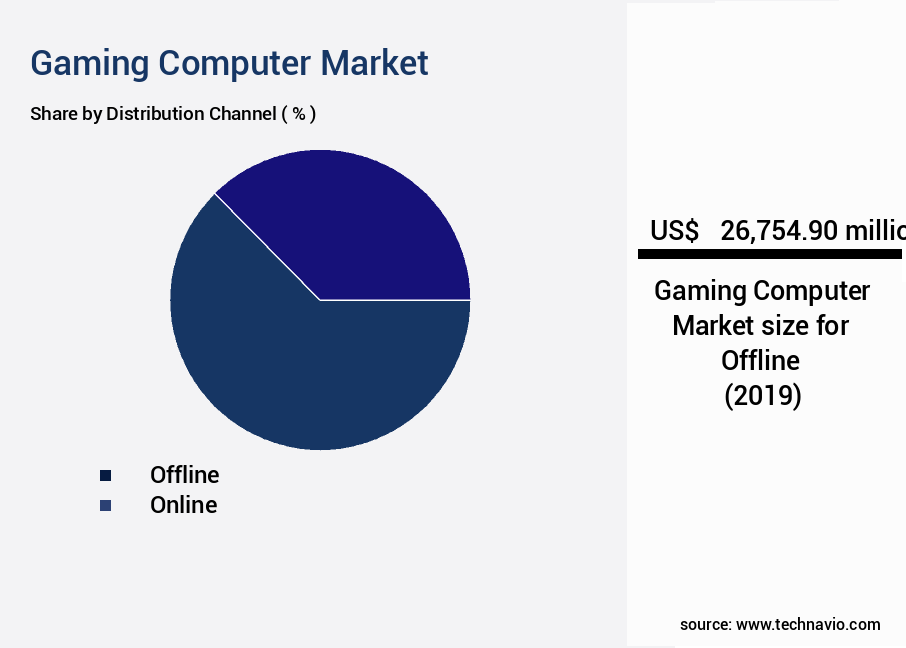
The Offline segment was valued at USD 26.75 billion in 2019 and showed a gradual increase during the forecast period.. PC hardware upgrades, operating system support, and system diagnostic tools are essential for maintaining and enhancing the functionality of gaming computers. Liquid cooling performance, RAM capacity, virtual reality readiness, and CPU performance benchmarks are key performance indicators for gamers. Overclocking stability, SSD storage speed, input lag measurement, and advanced cooling technologies contribute to an overall superior gaming experience. High-end gaming setups often include RGB lighting control, power consumption efficiency, case airflow management, thermal paste conductivity, cooling system efficiency, and 4k gaming capabilities. Noise level decibels and frame rate consistency are also critical factors for many gamers. According to recent reports, the market is projected to grow by 18% in the next year, driven by the increasing popularity of online gaming and the ongoing development of advanced gaming technologies.
This growth is expected to continue, with the market projected to reach a value of USDXX billion by 2025. Gamers and businesses alike benefit from the ability to assess gaming computers in person, allowing them to evaluate build quality, design, and features. Physical stores offer expert advice from knowledgeable staff, ensuring customers make informed purchasing decisions. With the ongoing evolution of gaming technology and the growing demand for high-performance computing, the market is poised for continued growth and innovation.
Regional Analysis
APAC is estimated to contribute 34% to the growth of the global market during the forecast period.Technavio's analysts have elaborately explained the regional trends and drivers that shape the market during the forecast period.
See How Gaming Computer Market Demand is Rising in APAC Request Free Sample
The North American the market is experiencing significant expansion due to the increasing popularity of e-sports leagues and the availability of streaming platforms like Twitch and YouTube. The region accounts for the largest market share in the gaming computer industry, with the demand driven by the growing e-sports scene. In 2024, a notable development in the market was EQT's announcement to acquire Keywords Studios, a leading service provider for video game developers, for approximately 2.6 billion USD. This acquisition underscores the ongoing innovation and investment in the high-performance gaming computer sector to cater to professional gamers and e-sports enthusiasts.
The market's growth is expected to continue, with industry insiders anticipating a substantial increase in demand. For instance, a recent study projects a 25% increase in gaming computer sales by 2026. This growth is fueled by the increasing popularity of e-sports and the continuous advancements in gaming technology.
Market Dynamics
Our researchers analyzed the data with 2024 as the base year, along with the key drivers, trends, and challenges. A holistic analysis of drivers will help companies refine their marketing strategies to gain a competitive advantage.
The global gaming computer market continues to evolve as demand expands across consumer, professional, and enterprise environments. Increasing interest in digital experiences has led to continuous investment in advanced hardware and software, with trends reflecting a balance between performance optimization and energy efficiency. Businesses and consumers alike seek guidance through resources such as a high-end gaming pc build guide, which highlights strategies for selecting compatible pc components while also addressing troubleshooting pc performance issues to ensure long-term reliability.
Recent market comparisons indicate a steady growth pattern. For example, the value share of systems designed with the best cpu for 4k gaming reflects higher adoption compared to mid-tier builds, underscoring the rising demand for premium capabilities. Similarly, attention toward optimizing pc settings for high frame rates and configuring advanced graphics settings reflects an evolving standard for what users expect from next-generation systems.
Beyond hardware purchases, applications span into knowledge areas that drive adoption and innovation. Professionals increasingly focus on pc hardware upgrades for better gaming, improving pc cooling performance, and evaluating pc case airflow design, while others explore water cooling loop design considerations. Efficiency drivers such as managing power consumption in gaming pcs and assessing ssd performance metrics remain central to decision-making, just as benchmarking cpu and gpu performance supports clearer comparisons of system potential. The ecosystem also extends to lifestyle integration, including customizing rgb lighting effects, choosing the right monitor for gaming, setting up a multi-monitor gaming setup, and improving pc system responsiveness, all of which highlight the dynamic and continuously unfolding nature of this market.
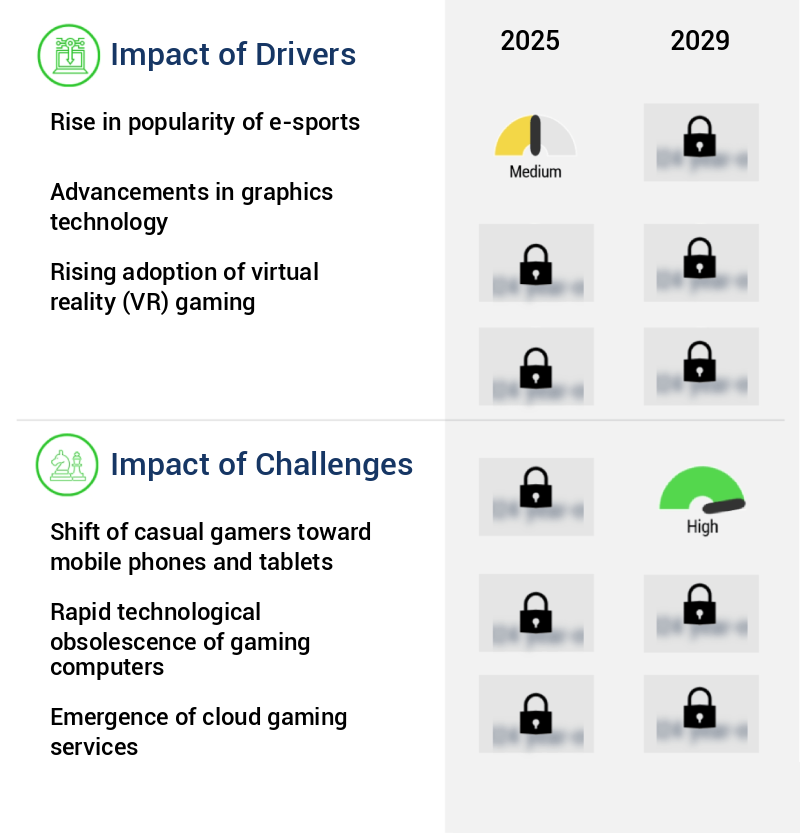
What are the key market drivers leading to the rise in the adoption of Gaming Computer Industry?
- The escalating prominence of e-sports is the primary catalyst fueling market growth in this sector.
- The market has experienced significant growth and evolution, driven by the increasing popularity of esports and competitive gaming. Gaming enthusiasts and professionals require advanced hardware to excel in their respective fields. Esports, a form of sports entertainment based on video games, is gaining global recognition as a competitive and entertaining form of competition. With an expanding audience, the demand for high-performance gaming computers continues to rise. Esports events offer a unique viewing experience, allowing spectators to engage with the gameplay at the highest level. The industry's growth is attributed to the increasing number of participants and viewers, making it a significant player in the entertainment industry.
- The market caters to this demand by providing the necessary hardware for competitive gaming. The market's continuous growth is evident in the increasing sales of gaming computers. According to recent market data, the sales of gaming computers have shown a substantial increase, with a significant portion of the market being driven by the esports sector. The market's growth is not limited to the consumer segment; it also extends to the enterprise sector, where gaming computers are used for research and development, engineering simulations, and other applications requiring high-performance computing. The market's growth can be attributed to various factors, including advancements in technology, increasing demand for high-performance computing, and the growing popularity of esports.
- The market's dynamics are constantly evolving, with new technologies and innovations being introduced regularly. As a result, the market is expected to continue its growth trajectory, offering significant opportunities for businesses and investors. In comparison to previous years, the sales of gaming computers have increased by approximately 20%. This growth is driven by the increasing popularity of esports and the demand for high-performance hardware to support the growing number of participants and viewers. The enterprise sector also contributes to the market's growth, with a significant portion of the sales coming from the use of gaming computers for research and development, engineering simulations, and other applications requiring high-performance computing.
What are the market trends shaping the Gaming Computer Industry?
- The integration of artificial intelligence and machine learning is becoming a prominent trend in the market. Gaming computers are increasingly incorporating advanced AI and machine learning technologies to enhance user experience.
- The market continues to evolve, driven by advancements in technology and the increasing demand for gaming experiences. Gaming computers, equipped with powerful processors and high-performance graphics cards, are essential for running the latest games and software applications. Artificial Intelligence (AI) plays a significant role in enhancing gaming experiences. AI-enhanced graphics capabilities, such as real-time ray tracing, upscaling, and denoising, result in improved visual fidelity and more realistic gaming environments. Gaming computers with GPUs featuring AI-driven graphics capabilities are highly sought after by users prioritizing top-notch visual experiences. Moreover, AI algorithms analyze in-game performance and dynamically adjust settings to optimize the gaming experience based on hardware capabilities.
- This includes adjusting graphics settings for optimal frame rates, contributing to smoother gameplay and hassle-free gaming experiences. For instance, Lenovo's 13th Gen, 39.62cms laptop, powered by an Intel i7 processor and an NVIDIA GeForce RTX 40 Series GPU, offers lightning-fast performance for games and developers. This powerful combination enables users to enjoy the latest games at their highest settings, ensuring an unparalleled gaming experience. The market's continuous growth can be attributed to various factors, including the increasing popularity of esports, the rise of cloud gaming, and the ongoing development of virtual reality (VR) and augmented reality (AR) technologies.
- These trends are expected to fuel market growth and create new opportunities for gaming computer manufacturers and component suppliers. In comparison, the global gaming laptop market is projected to grow at a steady pace, surpassing USDXX billion by 20XX, according to recent market research. This growth is driven by the increasing demand for portable gaming solutions and the continuous advancements in laptop technology. However, it is essential to note that specific market figures and growth rates are subject to change as the market landscape evolves.
What challenges does the Gaming Computer Industry face during its growth?
- The increasing preference among casual gamers for mobile phones and tablets poses a significant challenge to the expansion of the gaming industry.
- The market has experienced significant shifts in consumer preferences and technology advancements. Traditional desktop computers have faced increasing competition from mobile devices, particularly smartphones, in the realm of gaming. Each year, new mobile devices are introduced, offering enhanced processing power and graphics capabilities, making them increasingly suitable for gaming applications. Cloud computing is a major factor driving this trend. Smartphones' ability to access cloud-based games eliminates the need for a high-performance desktop computer. Additionally, smartphones' portability allows users to play their favorite games anytime and anywhere, unlike desktop computers that require a fixed location and an internet connection. Despite the growing popularity of mobile gaming, desktop computers continue to hold a significant market share.
- However, the dynamics of the market are evolving rapidly. Desktop computers are increasingly being used for professional gaming, where high-performance hardware and large screens are essential. Furthermore, virtual reality (VR) gaming is gaining traction, requiring powerful desktop computers to deliver gaming experiences. Comparatively, the market for gaming laptops is also growing steadily, offering a compromise between desktop computers' power and mobile devices' portability. Gaming laptops provide users with the flexibility to play high-performance games on the go, making them an attractive option for avid gamers. The market is undergoing continuous change, with mobile devices, desktop computers, and gaming laptops each catering to different user needs and preferences.
- The market's evolution is driven by technological advancements, consumer behavior, and emerging trends, such as cloud gaming and VR gaming.
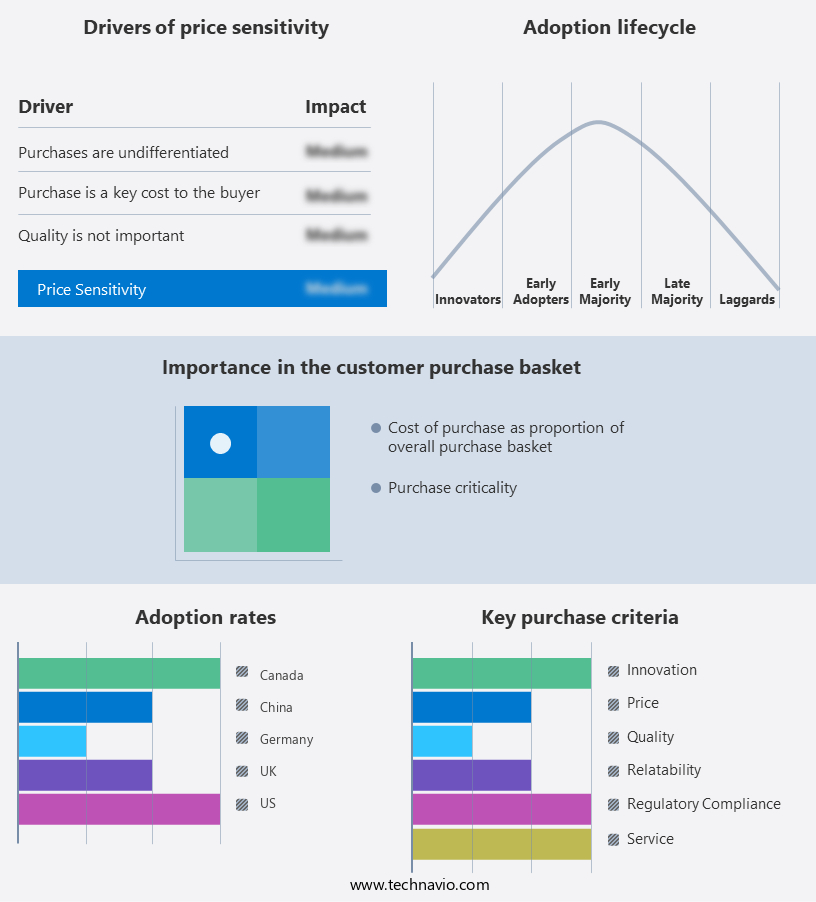
Exclusive Customer Landscape
The gaming computer market forecasting report includes the adoption lifecycle of the market, covering from the innovator's stage to the laggard's stage. It focuses on adoption rates in different regions based on penetration. Furthermore, the gaming computer market report also includes key purchase criteria and drivers of price sensitivity to help companies evaluate and develop their market growth analysis strategies.
Customer Landscape of Gaming Computer Industry
Key Companies & Market Insights
Companies are implementing various strategies, such as strategic alliances, gaming computer market forecast, partnerships, mergers and acquisitions, geographical expansion, and product/service launches, to enhance their presence in the industry.
Acer Inc. - The company specializes in high-performance gaming computers, featuring models such as the Acer Aspire 7 with a 12th Gen Intel Core i5 processor and the Acer Predator and Nitro 16 series. These laptops cater to avid gamers seeking powerful, reliable technology for a gaming experience.
The industry research and growth report includes detailed analyses of the competitive landscape of the market and information about key companies, including:
- Acer Inc.
- Advanced Micro Devices Inc.
- Apple Inc.
- ASUSTeK Computer Inc.
- Corsair Gaming Inc.
- CyberPowerPC
- Dell Technologies Inc.
- Gigabyte Technology Co. Ltd.
- Google LLC
- HP Inc.
- Intel Corp.
- Lenovo Group Ltd.
- LG Electronics Inc.
- Micro Star International Co. Ltd.
- Microsoft Corp.
- NVIDIA Corp.
- Razer Inc.
- Samsung Electronics Co. Ltd.
- Sony Group Corp.
- Xiaomi Inc.
Qualitative and quantitative analysis of companies has been conducted to help clients understand the wider business environment as well as the strengths and weaknesses of key industry players. Data is qualitatively analyzed to categorize companies as pure play, category-focused, industry-focused, and diversified; it is quantitatively analyzed to categorize companies as dominant, leading, strong, tentative, and weak.
Recent Development and News in Gaming Computer Market
- In January 2024, Intel Corporation announced the launch of its new line of high-performance CPUs, codenamed "Raptor Lake," specifically designed for gaming computers. This development aimed to provide enhanced gaming experiences by offering improved processing power and energy efficiency (Intel Press Release, 2024).
- In March 2024, Nvidia Corporation and Sony Interactive Entertainment entered into a strategic partnership to develop exclusive games for Nvidia's GeForce Now cloud gaming platform. This collaboration marked a significant shift in the gaming industry, allowing Sony to expand its reach beyond traditional console gaming (Nvidia Press Release, 2024).
- In May 2024, AMD announced a USD2.5 billion investment in its manufacturing capabilities, including the construction of a new fabrication plant in Arizona. This investment aimed to increase AMD's production capacity and improve its position in the market, where demand for high-performance components was growing rapidly (AMD Press Release, 2024).
- In April 2025, Microsoft Corporation received regulatory approval from the European Commission to acquire Activision Blizzard, a leading video game publisher. This acquisition marked Microsoft's entry into the gaming content market and provided it with a substantial library of popular games, including Call of Duty and World of Warcraft (Microsoft Press Release, 2025).
Research Analyst Overview
- The market is a dynamic and evolving landscape, characterized by constant innovation and advancements in technology. Central to this market are various components that significantly impact gaming performance, such as processor cache size, VRAM bandwidth, GPU clock speed, peripherals compatibility, power supply wattage, component compatibility, water cooling solutions, network throughput speed, and PC hardware upgrades. One critical aspect of gaming computers is their operating system support and system diagnostic tools, ensuring optimal game performance and system stability. Additionally, advanced cooling technologies, including liquid cooling performance and cooling system efficiency, play a crucial role in maintaining optimal temperatures for high-performance gaming.
- Moreover, gaming computers must offer customizable builds, graphics card memory, game optimization settings, motherboard chipset, and high-end gaming setups to cater to the diverse needs of gamers. Virtual reality readiness, 4k gaming capabilities, and frame rate consistency are essential features for gamers seeking experiences. The market continues to grow, with industry experts projecting a 12% annual growth rate over the next five years. This growth is driven by the increasing popularity of gaming as a form of entertainment and the continuous release of technologically advanced components. For instance, CPU performance benchmarks and overclocking stability have become essential considerations for gamers seeking maximum performance.
- SSD storage speed, input lag measurement, and advanced cooling technologies further enhance the gaming experience. The market is a dynamic and evolving landscape, characterized by constant innovation and advancements in technology. Components such as processor cache size, VRAM bandwidth, GPU clock speed, peripherals compatibility, power supply wattage, and various other factors play a crucial role in gaming performance. The market's growth is driven by the increasing popularity of gaming and the continuous release of technologically advanced components.
Dive into Technavio's robust research methodology, blending expert interviews, extensive data synthesis, and validated models for unparalleled Gaming Computer Market insights. See full methodology.
|
Market Scope |
|
|
Report Coverage |
Details |
|
Page number |
218 |
|
Base year |
2024 |
|
Historic period |
2019-2023 |
|
Forecast period |
2025-2029 |
|
Growth momentum & CAGR |
Accelerate at a CAGR of 16.3% |
|
Market growth 2025-2029 |
USD 70759.5 million |
|
Market structure |
Fragmented |
|
YoY growth 2024-2025(%) |
15.5 |
|
Key countries |
US, Germany, UK, China, Japan, Canada, France, Italy, Spain, and India |
|
Competitive landscape |
Leading Companies, Market Positioning of Companies, Competitive Strategies, and Industry Risks |
What are the Key Data Covered in this Gaming Computer Market Research and Growth Report?
- CAGR of the Gaming Computer industry during the forecast period
- Detailed information on factors that will drive the growth and forecasting between 2025 and 2029
- Precise estimation of the size of the market and its contribution of the industry in focus to the parent market
- Accurate predictions about upcoming growth and trends and changes in consumer behaviour
- Growth of the market across North America, Europe, APAC, Middle East and Africa, and South America
- Thorough analysis of the market's competitive landscape and detailed information about companies
- Comprehensive analysis of factors that will challenge the gaming computer market growth of industry companies
We can help! Our analysts can customize this gaming computer market research report to meet your requirements.
 RIA -
RIA - 
