General Lighting Market Analysis, Size, and Forecast 2026-2030: APAC (China, India, and Japan), Europe (Germany, UK, and France), North America (US, Canada, and Mexico), Middle East and Africa (Saudi Arabia, UAE, and South Africa), South America (Brazil and Argentina), and Rest of World (ROW)

General Lighting Market Analysis, Size, and Forecast 2026-2030:
APAC (China, India, and Japan), Europe (Germany, UK, and France), North America (US, Canada, and Mexico), Middle East and Africa (Saudi Arabia, UAE, and South Africa), South America (Brazil and Argentina), and Rest of World (ROW)

Published: May 2026 300 Pages SKU: IRTNTR40442

Market Overview at a Glance

$75.12 B
Market Opportunity
8.2%
CAGR 2025 - 2030
50.5%
APAC Growth
$91.69 B
LED lighting segment 2024

General Lighting Market Size 2026-2030

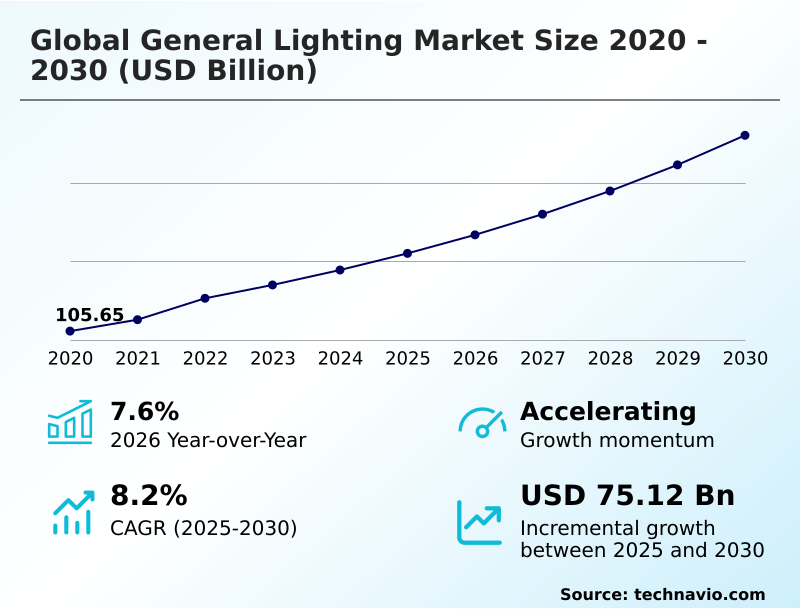
The General Lighting Market size was valued at USD 155.13 billion in 2025, growing at a CAGR of 8.2% during the forecast period 2026-2030.

Major Market Trends & Insights

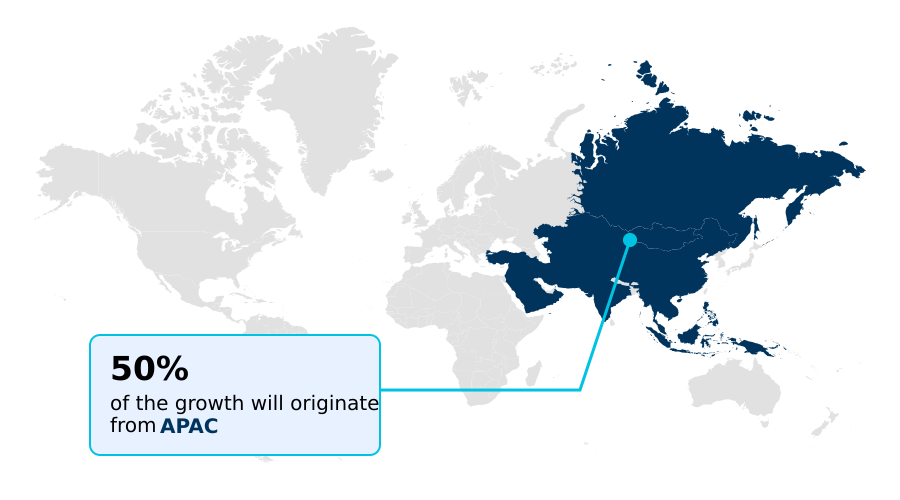
  • APAC dominated the market and accounted for a 50.5% growth during the forecast period.
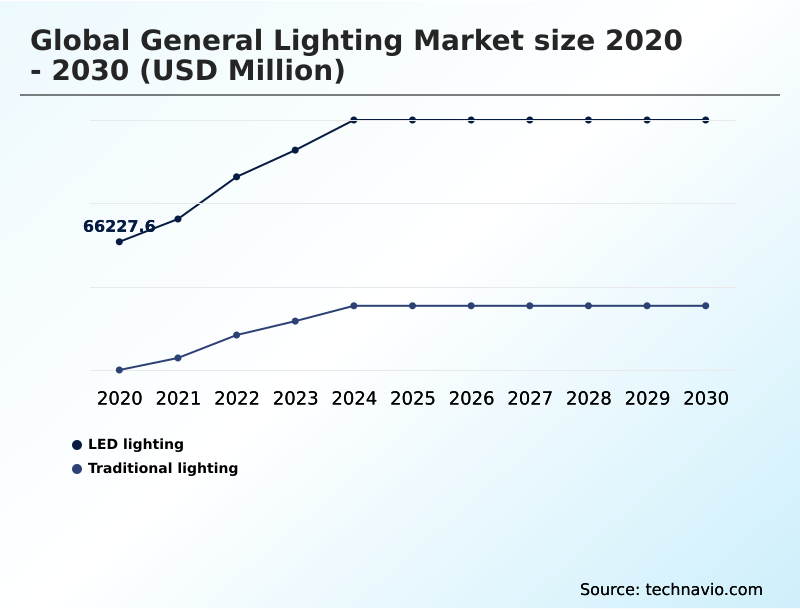
  • By Product - LED lighting segment was valued at USD 91.69 billion in 2024
  • By Application - Residential segment accounted for the largest market revenue share in 2024

Market Size & Forecast

  • Historic Market Opportunities 2020-2024: USD 124.60 billion
  • Market Future Opportunities 2025-2030: USD 75.12 billion
  • CAGR from 2025 to 2030 : 8.2%

Market Summary

  • The general lighting market is transitioning from a product-centric model to a service-oriented one, with APAC contributing over 50% of the incremental growth. In commercial settings, the adoption of smart lighting systems can reduce energy consumption by as much as 70% through adaptive controls.
  • A key driver is the global push for energy efficiency, compelling businesses to undertake large-scale retrofit projects to replace legacy technology with led lighting. For instance, a multinational retailer might implement a centralized IoT integration platform to manage lighting across hundreds of stores, optimizing for both energy use and in-store experience.
  • However, this transition is challenged by supply chain volatility for critical components like gallium nitride, which can disrupt production schedules and increase costs, forcing manufacturers to balance innovation with operational resilience and explore alternative revenue streams like light-as-a-service models.

What will be the Size of the General Lighting Market during the forecast period?

Get Key Insights on Market Forecast (PDF) Request Free Sample

How is the General Lighting Market Segmented?

The general lighting industry research report provides comprehensive data (region-wise segment analysis), with forecasts and analysis for the period 2026-2030, as well as historical data from 2020-2024 for the following segments.

  • Product
    • LED lighting
    • Traditional lighting
  • Application
    • Residential
    • Commercial
    • Outdoor
    • Industrial
    • Others
  • Battery type
    • Lithium-ion
    • Lead-acid
    • Nickel-based
    • Solid-state
  • Geography
    • APAC
      • China
      • India
      • Japan
    • Europe
      • Germany
      • UK
      • France
    • North America
      • US
      • Canada
      • Mexico
    • Middle East and Africa
      • Saudi Arabia
      • UAE
      • South Africa
    • South America
      • Brazil
      • Argentina
    • Rest of World (ROW)

How is the General Lighting Market Segmented by Product?

The led lighting segment is estimated to witness significant growth during the forecast period.

The LED lighting segment, which now accounts for over 60% of total market revenue, is the principal driver of growth in the general lighting market.

The efficiency of these solid-state lighting semiconductors allows for significant energy reductions, a key factor in their adoption for both new builds and retrofit projects.

Adoption in new commercial constructions is over 35% higher than in retrofits, driven by easier integration with building automation systems. Beyond basic illumination, the integration of smart sensors into modern luminaires enables data collection for space optimization.

This shift toward iot integration allows facility managers to enhance building performance, making energy efficient lighting a cornerstone of modern infrastructure and a important factor in commercial lighting decisions.

Request Free Sample

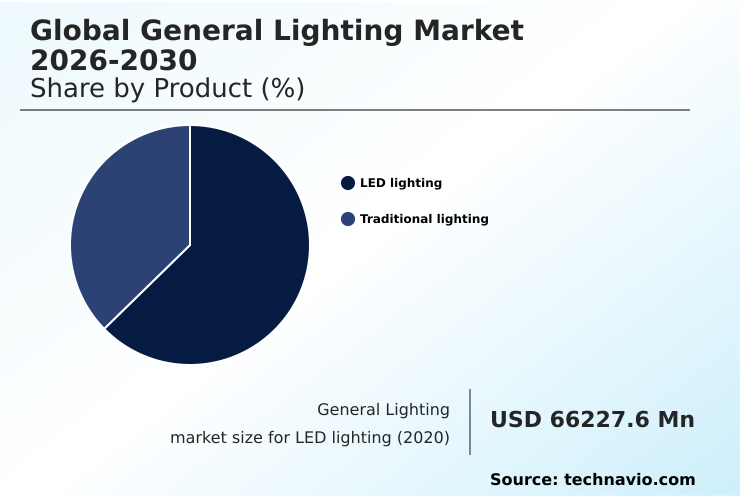
The LED lighting segment was valued at USD 91.69 billion in 2024 and showed a gradual increase during the forecast period.

Request Free Sample

How demand for the General Lighting market is rising in the leading region?

APAC is estimated to contribute 50.5% to the growth of the global market during the forecast period.Technavio’s analysts have elaborately explained the regional trends and drivers that shape the market during the forecast period.

See How General Lighting Market demand is rising in APAC Request Free Sample

The geographic landscape of the general lighting market is dominated by the APAC region, which is projected to grow at 9.5% annually, significantly outpacing Europe's 6.5% growth rate.

This disparity is driven by massive smart city infrastructure development and government-led energy efficiency policies in emerging economies.

Within APAC, countries like China and India are major contributors, with China alone accounting for over 25% of the region's market value due to its vast manufacturing base and rapid urbanization.

In contrast, North America and Europe are mature markets focusing on high-value retrofit projects and the adoption of advanced solutions like human-centric lighting and building management systems.

Regional differences in consumer behavior and regulatory environments, such as Europe's stringent circular economy mandates, require manufacturers to adapt their supply chains and product differentiation strategies for each market.

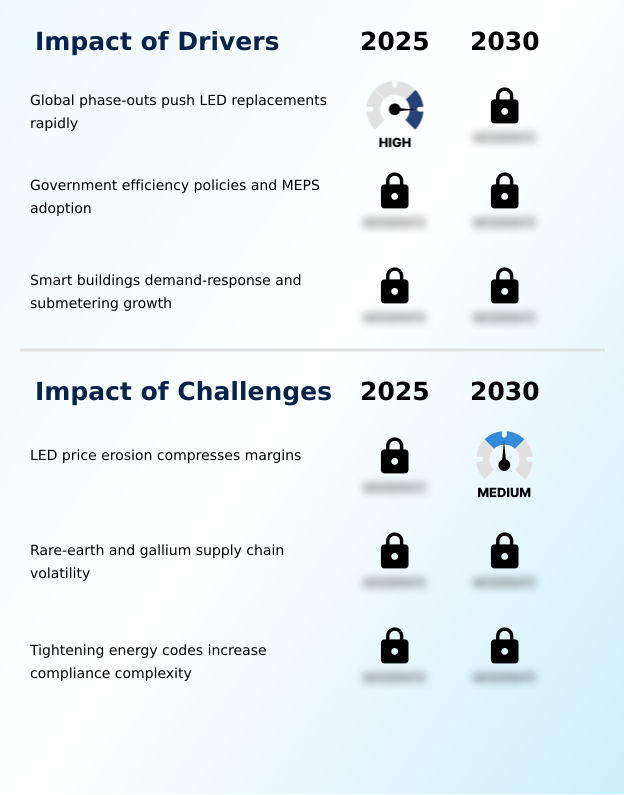
What are the key Drivers, Trends, and Challenges in the General Lighting Market?

Our researchers analyzed the data with 2025 as the base year, along with the key drivers, trends, and challenges. A holistic analysis of drivers will help companies refine their marketing strategies to gain a competitive advantage.

  • The evolution of general lighting now extends far beyond simple illumination, with a significant focus on advanced functionalities that address specific operational and wellness objectives. For instance, smart building lighting system integration is no longer a niche feature but a core requirement, appearing in over 60% of new high-end commercial construction proposals.
  • These systems increasingly incorporate adaptive lighting controls for demand response, allowing facilities to automatically shed electrical load during peak grid stress, thus reducing operational costs and enhancing grid stability. Concurrently, the growing emphasis on occupant well-being has propelled the adoption of human centric lighting for wellness.
  • Systems that dynamically adjust color temperature and intensity to support circadian rhythms have shown a 15% higher occupant satisfaction rating in post-occupancy evaluations. Understanding the benefits of connected lighting systems is crucial for stakeholders evaluating ROI, as the value proposition shifts from energy savings to include productivity gains and health benefits.
  • However, the industry continues to grapple with the led price erosion impact on margins, pushing manufacturers to innovate in areas like the use of gallium nitride in high efficiency leds to maintain a competitive edge.

What are the key market drivers leading to the rise in the adoption of General Lighting Industry?

  • The primary market driver is the global phase-out of inefficient lamps, which mandates rapid replacement with energy-efficient LED solutions.

  • The market is primarily driven by government energy efficiency policies and the adoption of minimum energy performance standards, which have mandated the phase-out of traditional lighting technologies.
  • These regulations have accelerated the transition to LEDs, leading to a penetration rate of over 90% in new public street lighting projects across many developed nations.
  • Another significant driver is the growth of smart buildings, which prioritize intelligent control of all systems, including lighting.
  • The integration of connected lighting with building management systems (BMS) enables advanced demand-response programs and can reduce a building's total energy costs by up to 30%.
  • This synergy between regulatory push and technological pull is reshaping lighting from a static utility into a dynamic, integrated component of modern infrastructure.

What are the market trends shaping the General Lighting Industry?

  • Human-centric tunable white technology is an emerging market trend, focusing on adjusting light to support natural circadian rhythms for enhanced well-being.

  • A key trend transforming the general lighting market is the adoption of human-centric lighting designed for circadian rhythm support, which can boost productivity in office environments by up to 12%. This approach shifts the focus from mere illumination to enhancing occupant well-being by dynamically adjusting color temperature and intensity.
  • Simultaneously, AI-driven adaptive controls are gaining traction, leveraging machine learning to optimize lighting based on real-time occupancy, daylight, and grid signals for demand response. These intelligent systems offer energy savings of an additional 20% compared to systems with basic occupancy sensors.
  • This convergence of wellness and artificial intelligence is pushing the industry toward a future where IoT integration delivers highly personalized, responsive, and energy-efficient lighting experiences.

What challenges does the General Lighting Industry face during its growth?

  • A key industry challenge is the persistent price erosion in the LED market, which significantly compresses manufacturer profit margins.

  • A primary challenge facing the general lighting market is severe price erosion in led lighting, which has compressed manufacturer gross margins by an average of 15-20% for commoditized products. This forces companies to pursue aggressive cost-cutting or seek product differentiation in higher-value segments.
  • Compounding this issue is significant supply chain volatility for critical raw materials like rare-earth phosphors and gallium nitride. Geopolitical tensions can cause price spikes of over 50% in short timeframes, creating major planning disruptions for component manufacturing.
  • Furthermore, the increasing complexity of tightening energy codes adds another layer of cost and administrative burden, as products must constantly be redesigned and recertified to meet evolving global standards, challenging smaller players' ability to compete.

Exclusive Technavio Analysis on Customer Landscape

The general lighting market forecasting report includes the adoption lifecycle of the market, covering from the innovator’s stage to the laggard’s stage. It focuses on adoption rates in different regions based on penetration. Furthermore, the general lighting market report also includes key purchase criteria and drivers of price sensitivity to help companies evaluate and develop their market growth analysis strategies.

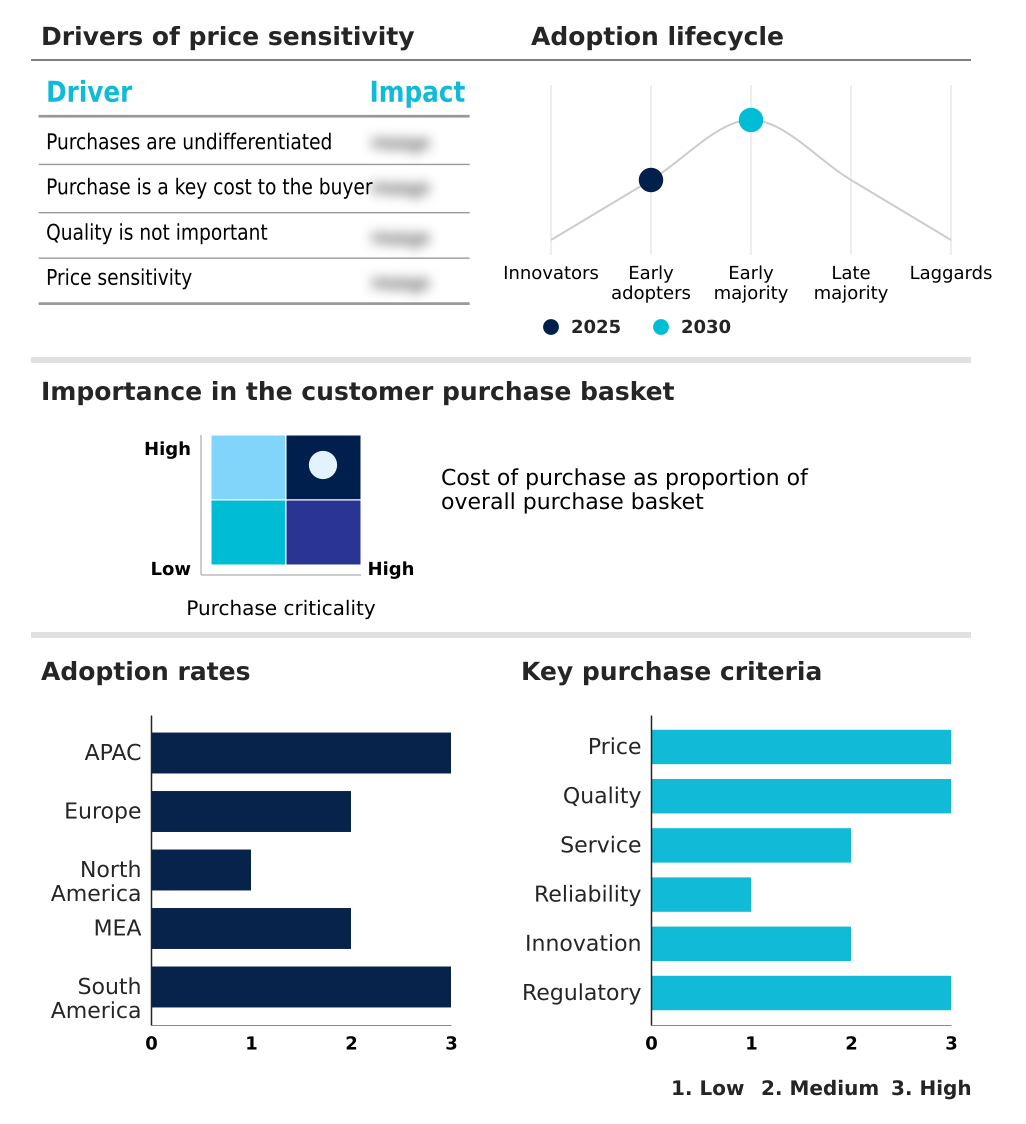
Customer Landscape of General Lighting Industry

Competitive Landscape

Companies are implementing various strategies, such as strategic alliances, general lighting market forecast, partnerships, mergers and acquisitions, geographical expansion, and product/service launches, to enhance their presence in the industry.

Acuity Brands Inc. - Analysis indicates a focus on integrated solutions, encompassing luminaires, advanced lighting controls, and comprehensive building automation systems, which defines the core offering.

The industry research and growth report includes detailed analyses of the competitive landscape of the market and information about key companies, including:

  • Acuity Brands Inc.
  • Bridgelux Inc.
  • Cooper Lighting LLC.
  • Cree Lighting
  • Eaton Corp. Plc
  • Everlight Electronics Co. Ltd.
  • Havells India Ltd.
  • Lighting Technologies India Pvt.
  • MEGAMAN
  • Nichia Corp.
  • OSRAM GmbH
  • Panasonic Holdings Corp.
  • SAVANT TECHNOLOGIES LLC.
  • Seoul Semiconductor Co. Ltd.
  • Signify NV
  • Siteco GmbH
  • TRILUX GmbH and Co. KG
  • Xicato

Qualitative and quantitative analysis of companies has been conducted to help clients understand the wider business environment as well as the strengths and weaknesses of key industry players. Data is qualitatively analyzed to categorize companies as pure play, category-focused, industry-focused, and diversified; it is quantitatively analyzed to categorize companies as dominant, leading, strong, tentative, and weak.

Market Intelligence Radar: High-Impact Developments & Growth Signals

  • In the electrical components and equipment industry, the growing adoption of automation in manufacturing processes has increased demand for advanced industrial lighting, requiring smart lighting systems that integrate with factory control platforms for enhanced operational visibility and predictive maintenance.
  • The increasing number of smart grid projects is driving the need for intelligent electrical equipment, which directly impacts the general lighting market by accelerating demand for connected lighting with demand-response program capabilities, turning luminaires into grid-interactive assets.
  • A rising focus on energy-efficient electrical components, driven by stringent energy efficiency policies, is creating new standards that accelerate the phase-out of traditional lighting and mandate high-efficacy solid-state lighting solutions in new and retrofit projects.
  • Increased adoption of IoT and industrial wireless infrastructure has established a new benchmark for connected devices, fueling the general lighting market by embedding IoT integration into luminaires and transforming them into data collection nodes for smart city infrastructure.

Dive into Technavio’s robust research methodology, blending expert interviews, extensive data synthesis, and validated models for unparalleled General Lighting Market insights. See full methodology.

Market Scope
Page number 300
Base year 2025
Historic period 2020-2024
Forecast period 2026-2030
Growth momentum & CAGR Accelerate at a CAGR of 8.2%
Market growth 2026-2030 USD 75117.9 million
Market structure Fragmented
YoY growth 2025-2026(%) 7.6%
Key countries China, India, Japan, South Korea, Australia, Indonesia, Germany, UK, France, Italy, Spain, The Netherlands, US, Canada, Mexico, Saudi Arabia, UAE, South Africa, Egypt, Nigeria, Brazil, Argentina and Chile
Competitive landscape Leading Companies, Market Positioning of Companies, Competitive Strategies, and Industry Risks

Request Free Sample

Research Analyst Overview

  • The general lighting market ecosystem is a complex network where raw material suppliers, particularly those providing rare-earth elements and gallium, hold significant influence due to supply chain concentration; these materials can represent up to 20% of the final component cost. Manufacturers and providers of component manufacturing engage in intense product differentiation through innovations in luminaire design and efficiency.
  • Regulatory bodies and energy codes set stringent minimum energy performance standards, shaping product development cycles. Distribution channels, including electrical wholesalers and direct-to-contractor sales, are critical for market access.
  • End-users are diverse, with the residential segment comprising over 40% of the market and driving demand for cost-effective solutions, while commercial clients prioritize total cost of ownership and integration with building management systems. Supporting entities in R&D are crucial for developing next-generation technologies like organic light-emitting diodes and advanced adaptive controls.

What are the Key Data Covered in this General Lighting Market Research and Growth Report?

  • What is the expected growth of the General Lighting Market between 2026 and 2030?

    • The General Lighting Market is expected to grow by USD 75.12 billion during 2026-2030, registering a CAGR of 8.2%. Year-over-year growth in 2026 is estimated at 7.6%%. This acceleration is shaped by global phase‑outs push led replacements rapidly, which is intensifying demand across multiple end-use verticals covered in the report.

  • What segmentation does the market report cover?

    • The report is segmented by Product (LED lighting, and Traditional lighting), Application (Residential, Commercial, Outdoor, Industrial, and Others), Battery Type (Lithium-ion, Lead-acid, Nickel-based, and Solid-state) and Geography (APAC, Europe, North America, Middle East and Africa, South America). Among these, the LED lighting segment is estimated to witness significant growth during the forecast period, driven by rising adoption across key application areas. Each segment includes detailed qualitative and quantitative analysis, along with historical data from 2020-2024 and forecasts through 2030 with year-over-year growth rates.

  • Which regions are analyzed in the report?

    • The report covers APAC, Europe, North America, Middle East and Africa and South America. APAC is estimated to contribute 50.5% to market growth during the forecast period. Country-level analysis includes China, India, Japan, South Korea, Australia, Indonesia, Germany, UK, France, Italy, Spain, The Netherlands, US, Canada, Mexico, Saudi Arabia, UAE, South Africa, Egypt, Nigeria, Brazil, Argentina and Chile, with dedicated market size tables and year-over-year growth for each.

  • What are the key growth drivers and market challenges?

    • The primary driver is global phase‑outs push led replacements rapidly, which is accelerating investment and industry demand. The main challenge is led price erosion compresses margins, creating operational barriers for key market participants. The report quantifies the impact of each driver and challenge across 2026 and 2030 with comparative analysis.

  • Who are the major players in the General Lighting Market?

    • Key vendors include Acuity Brands Inc., Bridgelux Inc., Cooper Lighting LLC., Cree Lighting, Eaton Corp. Plc, Everlight Electronics Co. Ltd., Havells India Ltd., Lighting Technologies India Pvt., MEGAMAN, Nichia Corp., OSRAM GmbH, Panasonic Holdings Corp., SAVANT TECHNOLOGIES LLC., Seoul Semiconductor Co. Ltd., Signify NV, Siteco GmbH, TRILUX GmbH and Co. KG and Xicato. The report provides qualitative and quantitative analysis categorizing companies as dominant, leading, strong, tentative, and weak based on their market positioning. Company profiles include business segment analysis, SWOT assessment, key offerings, and recent strategic developments.

Market Research Insights

  • The competitive landscape of the general lighting market is characterized by a strategic pivot from hardware sales to integrated digital solutions, where firms such as Signify NV and OSRAM GmbH lead. Recent innovations from component specialists such as Nichia Corp. have resulted in new chip designs that enable thinner luminaire profiles, reducing material use by over 15%.
  • This focus on component-level advancement is critical as the market contends with intense price pressure. In response, major players like Cree Lighting are expanding their portfolios to include sophisticated wireless lighting controls and software platforms. These actions reflect a broader industry trend of embedding intelligence into lighting infrastructure to meet enterprise demand for smart buildings.
  • However, the high fixed costs of manufacturing force companies to aggressively pursue volume, intensifying rivalry and pushing firms to explore light-as-a-service models, which can increase customer lifetime value by more than 30% compared to traditional hardware sales.

We can help! Our analysts can customize this general lighting market research report to meet your requirements.

Get in touch

1. Executive Summary

1.1 Market overview

Executive Summary - Chart on Market Overview
Executive Summary - Data Table on Market Overview
Executive Summary - Chart on Global Market Characteristics
Executive Summary - Chart on Market by Geography
Executive Summary - Chart on Market Segmentation by Product
Executive Summary - Chart on Market Segmentation by Application
Executive Summary - Chart on Market Segmentation by Battery Type
Executive Summary - Chart on Incremental Growth
Executive Summary - Data Table on Incremental Growth
Executive Summary - Chart on Company Market Positioning

2. Technavio Analysis

2.1 Analysis of price sensitivity, lifecycle, customer purchase basket, adoption rates, and purchase criteria

2.2 Criticality of inputs and Factors of differentiation

Chart on Overview on criticality of inputs and factors of differentiation

2.3 Factors of disruption

Chart on Overview on factors of disruption

2.4 Impact of drivers and challenges

Chart on Impact of drivers and challenges in 2025 and 2030

3. Market Landscape

3.1 Market ecosystem

Chart on Parent Market
Data Table on - Parent Market

3.2 Market characteristics

Chart on Market characteristics analysis

3.3 Value chain analysis

Chart on Value chain analysis

4. Market Sizing

4.1 Market definition

Data Table on Offerings of companies included in the market definition

4.2 Market segment analysis

Market segments

4.3 Market size 2025

4.4 Market outlook: Forecast for 2025-2030

Chart on Global - Market size and forecast 2025-2030 ($ million)
Data Table on Global - Market size and forecast 2025-2030 ($ million)
Chart on Global Market: Year-over-year growth 2025-2030 (%)
Data Table on Global Market: Year-over-year growth 2025-2030 (%)

5. Historic Market Size

5.1 Global General Lighting Market 2020 - 2024

Historic Market Size - Data Table on Global General Lighting Market 2020 - 2024 ($ million)

5.2 Product segment analysis 2020 - 2024

Historic Market Size - Product Segment 2020 - 2024 ($ million)

5.3 Application segment analysis 2020 - 2024

Historic Market Size - Application Segment 2020 - 2024 ($ million)

5.4 Battery Type segment analysis 2020 - 2024

Historic Market Size - Battery Type Segment 2020 - 2024 ($ million)

5.5 Geography segment analysis 2020 - 2024

Historic Market Size - Geography Segment 2020 - 2024 ($ million)

5.6 Country segment analysis 2020 - 2024

Historic Market Size - Country Segment 2020 - 2024 ($ million)

6. Qualitative Analysis

6.1 The Impact of AI in Global General Lighting Market

7. Five Forces Analysis

7.1 Five forces summary

Five forces analysis - Comparison between 2025 and 2030

7.2 Bargaining power of buyers

Bargaining power of buyers - Impact of key factors 2025 and 2030

7.3 Bargaining power of suppliers

Bargaining power of suppliers - Impact of key factors in 2025 and 2030

7.4 Threat of new entrants

Threat of new entrants - Impact of key factors in 2025 and 2030

7.5 Threat of substitutes

Threat of substitutes - Impact of key factors in 2025 and 2030

7.6 Threat of rivalry

Threat of rivalry - Impact of key factors in 2025 and 2030

7.7 Market condition

Chart on Market condition - Five forces 2025 and 2030

8. Market Segmentation by Product

8.1 Market segments

Chart on Product - Market share 2025-2030 (%)
Data Table on Product - Market share 2025-2030 (%)

8.2 Comparison by Product

Chart on Comparison by Product
Data Table on Comparison by Product

8.3 LED lighting - Market size and forecast 2025-2030

Chart on LED lighting - Market size and forecast 2025-2030 ($ million)
Data Table on LED lighting - Market size and forecast 2025-2030 ($ million)
Chart on LED lighting - Year-over-year growth 2025-2030 (%)
Data Table on LED lighting - Year-over-year growth 2025-2030 (%)

8.4 Traditional lighting - Market size and forecast 2025-2030

Chart on Traditional lighting - Market size and forecast 2025-2030 ($ million)
Data Table on Traditional lighting - Market size and forecast 2025-2030 ($ million)
Chart on Traditional lighting - Year-over-year growth 2025-2030 (%)
Data Table on Traditional lighting - Year-over-year growth 2025-2030 (%)

8.5 Market opportunity by Product

Market opportunity by Product ($ million)
Data Table on Market opportunity by Product ($ million)

9. Market Segmentation by Application

9.1 Market segments

Chart on Application - Market share 2025-2030 (%)
Data Table on Application - Market share 2025-2030 (%)

9.2 Comparison by Application

Chart on Comparison by Application
Data Table on Comparison by Application

9.3 Residential - Market size and forecast 2025-2030

Chart on Residential - Market size and forecast 2025-2030 ($ million)
Data Table on Residential - Market size and forecast 2025-2030 ($ million)
Chart on Residential - Year-over-year growth 2025-2030 (%)
Data Table on Residential - Year-over-year growth 2025-2030 (%)

9.4 Commercial - Market size and forecast 2025-2030

Chart on Commercial - Market size and forecast 2025-2030 ($ million)
Data Table on Commercial - Market size and forecast 2025-2030 ($ million)
Chart on Commercial - Year-over-year growth 2025-2030 (%)
Data Table on Commercial - Year-over-year growth 2025-2030 (%)

9.5 Outdoor - Market size and forecast 2025-2030

Chart on Outdoor - Market size and forecast 2025-2030 ($ million)
Data Table on Outdoor - Market size and forecast 2025-2030 ($ million)
Chart on Outdoor - Year-over-year growth 2025-2030 (%)
Data Table on Outdoor - Year-over-year growth 2025-2030 (%)

9.6 Industrial - Market size and forecast 2025-2030

Chart on Industrial - Market size and forecast 2025-2030 ($ million)
Data Table on Industrial - Market size and forecast 2025-2030 ($ million)
Chart on Industrial - Year-over-year growth 2025-2030 (%)
Data Table on Industrial - Year-over-year growth 2025-2030 (%)

9.7 Others - Market size and forecast 2025-2030

Chart on Others - Market size and forecast 2025-2030 ($ million)
Data Table on Others - Market size and forecast 2025-2030 ($ million)
Chart on Others - Year-over-year growth 2025-2030 (%)
Data Table on Others - Year-over-year growth 2025-2030 (%)

9.8 Market opportunity by Application

Market opportunity by Application ($ million)
Data Table on Market opportunity by Application ($ million)

10. Market Segmentation by Battery Type

10.1 Market segments

Chart on Battery Type - Market share 2025-2030 (%)
Data Table on Battery Type - Market share 2025-2030 (%)

10.2 Comparison by Battery Type

Chart on Comparison by Battery Type
Data Table on Comparison by Battery Type

10.3 Lithium-ion - Market size and forecast 2025-2030

Chart on Lithium-ion - Market size and forecast 2025-2030 ($ million)
Data Table on Lithium-ion - Market size and forecast 2025-2030 ($ million)
Chart on Lithium-ion - Year-over-year growth 2025-2030 (%)
Data Table on Lithium-ion - Year-over-year growth 2025-2030 (%)

10.4 Lead-acid - Market size and forecast 2025-2030

Chart on Lead-acid - Market size and forecast 2025-2030 ($ million)
Data Table on Lead-acid - Market size and forecast 2025-2030 ($ million)
Chart on Lead-acid - Year-over-year growth 2025-2030 (%)
Data Table on Lead-acid - Year-over-year growth 2025-2030 (%)

10.5 Nickel-based - Market size and forecast 2025-2030

Chart on Nickel-based - Market size and forecast 2025-2030 ($ million)
Data Table on Nickel-based - Market size and forecast 2025-2030 ($ million)
Chart on Nickel-based - Year-over-year growth 2025-2030 (%)
Data Table on Nickel-based - Year-over-year growth 2025-2030 (%)

10.6 Solid-state - Market size and forecast 2025-2030

Chart on Solid-state - Market size and forecast 2025-2030 ($ million)
Data Table on Solid-state - Market size and forecast 2025-2030 ($ million)
Chart on Solid-state - Year-over-year growth 2025-2030 (%)
Data Table on Solid-state - Year-over-year growth 2025-2030 (%)

10.7 Market opportunity by Battery Type

Market opportunity by Battery Type ($ million)
Data Table on Market opportunity by Battery Type ($ million)

11. Customer Landscape

11.1 Customer landscape overview

Analysis of price sensitivity, lifecycle, customer purchase basket, adoption rates, and purchase criteria

12. Geographic Landscape

12.1 Geographic segmentation

Chart on Market share by geography 2025-2030 (%)
Data Table on Market share by geography 2025-2030 (%)

12.2 Geographic comparison

Chart on Geographic comparison
Data Table on Geographic comparison

12.3 APAC - Market size and forecast 2025-2030

Chart on APAC - Market size and forecast 2025-2030 ($ million)
Data Table on APAC - Market size and forecast 2025-2030 ($ million)
Chart on APAC - Year-over-year growth 2025-2030 (%)
Data Table on APAC - Year-over-year growth 2025-2030 (%)
Chart on Regional Comparison - APAC
Data Table on Regional Comparison - APAC

12.3.1 China - Market size and forecast 2025-2030

Chart on China - Market size and forecast 2025-2030 ($ million)
Data Table on China - Market size and forecast 2025-2030 ($ million)
Chart on China - Year-over-year growth 2025-2030 (%)
Data Table on China - Year-over-year growth 2025-2030 (%)

12.3.2 India - Market size and forecast 2025-2030

Chart on India - Market size and forecast 2025-2030 ($ million)
Data Table on India - Market size and forecast 2025-2030 ($ million)
Chart on India - Year-over-year growth 2025-2030 (%)
Data Table on India - Year-over-year growth 2025-2030 (%)

12.3.3 Japan - Market size and forecast 2025-2030

Chart on Japan - Market size and forecast 2025-2030 ($ million)
Data Table on Japan - Market size and forecast 2025-2030 ($ million)
Chart on Japan - Year-over-year growth 2025-2030 (%)
Data Table on Japan - Year-over-year growth 2025-2030 (%)

12.3.4 South Korea - Market size and forecast 2025-2030

Chart on South Korea - Market size and forecast 2025-2030 ($ million)
Data Table on South Korea - Market size and forecast 2025-2030 ($ million)
Chart on South Korea - Year-over-year growth 2025-2030 (%)
Data Table on South Korea - Year-over-year growth 2025-2030 (%)

12.3.5 Australia - Market size and forecast 2025-2030

Chart on Australia - Market size and forecast 2025-2030 ($ million)
Data Table on Australia - Market size and forecast 2025-2030 ($ million)
Chart on Australia - Year-over-year growth 2025-2030 (%)
Data Table on Australia - Year-over-year growth 2025-2030 (%)

12.3.6 Indonesia - Market size and forecast 2025-2030

Chart on Indonesia - Market size and forecast 2025-2030 ($ million)
Data Table on Indonesia - Market size and forecast 2025-2030 ($ million)
Chart on Indonesia - Year-over-year growth 2025-2030 (%)
Data Table on Indonesia - Year-over-year growth 2025-2030 (%)

12.4 Europe - Market size and forecast 2025-2030

Chart on Europe - Market size and forecast 2025-2030 ($ million)
Data Table on Europe - Market size and forecast 2025-2030 ($ million)
Chart on Europe - Year-over-year growth 2025-2030 (%)
Data Table on Europe - Year-over-year growth 2025-2030 (%)
Chart on Regional Comparison - Europe
Data Table on Regional Comparison - Europe

12.4.1 Germany - Market size and forecast 2025-2030

Chart on Germany - Market size and forecast 2025-2030 ($ million)
Data Table on Germany - Market size and forecast 2025-2030 ($ million)
Chart on Germany - Year-over-year growth 2025-2030 (%)
Data Table on Germany - Year-over-year growth 2025-2030 (%)

12.4.2 UK - Market size and forecast 2025-2030

Chart on UK - Market size and forecast 2025-2030 ($ million)
Data Table on UK - Market size and forecast 2025-2030 ($ million)
Chart on UK - Year-over-year growth 2025-2030 (%)
Data Table on UK - Year-over-year growth 2025-2030 (%)

12.4.3 France - Market size and forecast 2025-2030

Chart on France - Market size and forecast 2025-2030 ($ million)
Data Table on France - Market size and forecast 2025-2030 ($ million)
Chart on France - Year-over-year growth 2025-2030 (%)
Data Table on France - Year-over-year growth 2025-2030 (%)

12.4.4 Italy - Market size and forecast 2025-2030

Chart on Italy - Market size and forecast 2025-2030 ($ million)
Data Table on Italy - Market size and forecast 2025-2030 ($ million)
Chart on Italy - Year-over-year growth 2025-2030 (%)
Data Table on Italy - Year-over-year growth 2025-2030 (%)

12.4.5 Spain - Market size and forecast 2025-2030

Chart on Spain - Market size and forecast 2025-2030 ($ million)
Data Table on Spain - Market size and forecast 2025-2030 ($ million)
Chart on Spain - Year-over-year growth 2025-2030 (%)
Data Table on Spain - Year-over-year growth 2025-2030 (%)

12.4.6 The Netherlands - Market size and forecast 2025-2030

Chart on The Netherlands - Market size and forecast 2025-2030 ($ million)
Data Table on The Netherlands - Market size and forecast 2025-2030 ($ million)
Chart on The Netherlands - Year-over-year growth 2025-2030 (%)
Data Table on The Netherlands - Year-over-year growth 2025-2030 (%)

12.5 North America - Market size and forecast 2025-2030

Chart on North America - Market size and forecast 2025-2030 ($ million)
Data Table on North America - Market size and forecast 2025-2030 ($ million)
Chart on North America - Year-over-year growth 2025-2030 (%)
Data Table on North America - Year-over-year growth 2025-2030 (%)
Chart on Regional Comparison - North America
Data Table on Regional Comparison - North America

12.5.1 US - Market size and forecast 2025-2030

Chart on US - Market size and forecast 2025-2030 ($ million)
Data Table on US - Market size and forecast 2025-2030 ($ million)
Chart on US - Year-over-year growth 2025-2030 (%)
Data Table on US - Year-over-year growth 2025-2030 (%)

12.5.2 Canada - Market size and forecast 2025-2030

Chart on Canada - Market size and forecast 2025-2030 ($ million)
Data Table on Canada - Market size and forecast 2025-2030 ($ million)
Chart on Canada - Year-over-year growth 2025-2030 (%)
Data Table on Canada - Year-over-year growth 2025-2030 (%)

12.5.3 Mexico - Market size and forecast 2025-2030

Chart on Mexico - Market size and forecast 2025-2030 ($ million)
Data Table on Mexico - Market size and forecast 2025-2030 ($ million)
Chart on Mexico - Year-over-year growth 2025-2030 (%)
Data Table on Mexico - Year-over-year growth 2025-2030 (%)

12.6 Middle East and Africa - Market size and forecast 2025-2030

Chart on Middle East and Africa - Market size and forecast 2025-2030 ($ million)
Data Table on Middle East and Africa - Market size and forecast 2025-2030 ($ million)
Chart on Middle East and Africa - Year-over-year growth 2025-2030 (%)
Data Table on Middle East and Africa - Year-over-year growth 2025-2030 (%)
Chart on Regional Comparison - Middle East and Africa
Data Table on Regional Comparison - Middle East and Africa

12.6.1 Saudi Arabia - Market size and forecast 2025-2030

Chart on Saudi Arabia - Market size and forecast 2025-2030 ($ million)
Data Table on Saudi Arabia - Market size and forecast 2025-2030 ($ million)
Chart on Saudi Arabia - Year-over-year growth 2025-2030 (%)
Data Table on Saudi Arabia - Year-over-year growth 2025-2030 (%)

12.6.2 UAE - Market size and forecast 2025-2030

Chart on UAE - Market size and forecast 2025-2030 ($ million)
Data Table on UAE - Market size and forecast 2025-2030 ($ million)
Chart on UAE - Year-over-year growth 2025-2030 (%)
Data Table on UAE - Year-over-year growth 2025-2030 (%)

12.6.3 South Africa - Market size and forecast 2025-2030

Chart on South Africa - Market size and forecast 2025-2030 ($ million)
Data Table on South Africa - Market size and forecast 2025-2030 ($ million)
Chart on South Africa - Year-over-year growth 2025-2030 (%)
Data Table on South Africa - Year-over-year growth 2025-2030 (%)

12.6.4 Egypt - Market size and forecast 2025-2030

Chart on Egypt - Market size and forecast 2025-2030 ($ million)
Data Table on Egypt - Market size and forecast 2025-2030 ($ million)
Chart on Egypt - Year-over-year growth 2025-2030 (%)
Data Table on Egypt - Year-over-year growth 2025-2030 (%)

12.6.5 Nigeria - Market size and forecast 2025-2030

Chart on Nigeria - Market size and forecast 2025-2030 ($ million)
Data Table on Nigeria - Market size and forecast 2025-2030 ($ million)
Chart on Nigeria - Year-over-year growth 2025-2030 (%)
Data Table on Nigeria - Year-over-year growth 2025-2030 (%)

12.7 South America - Market size and forecast 2025-2030

Chart on South America - Market size and forecast 2025-2030 ($ million)
Data Table on South America - Market size and forecast 2025-2030 ($ million)
Chart on South America - Year-over-year growth 2025-2030 (%)
Data Table on South America - Year-over-year growth 2025-2030 (%)
Chart on Regional Comparison - South America
Data Table on Regional Comparison - South America

12.7.1 Brazil - Market size and forecast 2025-2030

Chart on Brazil - Market size and forecast 2025-2030 ($ million)
Data Table on Brazil - Market size and forecast 2025-2030 ($ million)
Chart on Brazil - Year-over-year growth 2025-2030 (%)
Data Table on Brazil - Year-over-year growth 2025-2030 (%)

12.7.2 Argentina - Market size and forecast 2025-2030

Chart on Argentina - Market size and forecast 2025-2030 ($ million)
Data Table on Argentina - Market size and forecast 2025-2030 ($ million)
Chart on Argentina - Year-over-year growth 2025-2030 (%)
Data Table on Argentina - Year-over-year growth 2025-2030 (%)

12.7.3 Chile - Market size and forecast 2025-2030

Chart on Chile - Market size and forecast 2025-2030 ($ million)
Data Table on Chile - Market size and forecast 2025-2030 ($ million)
Chart on Chile - Year-over-year growth 2025-2030 (%)
Data Table on Chile - Year-over-year growth 2025-2030 (%)

12.8 Market opportunity by geography

Market opportunity by geography ($ million)
Data Tables on Market opportunity by geography ($ million)

13. Drivers, Challenges, and Opportunity

13.1 Market drivers

Global phase‑outs push LED replacements rapidly
Government efficiency policies and MEPS adoption
Smart buildings demand‑response and submetering growth

13.2 Market challenges

LED price erosion compresses margins
Rare‑earth and gallium supply chain volatility
Tightening energy codes increase compliance complexity

13.3 Impact of drivers and challenges

Impact of drivers and challenges in 2025 and 2030

13.4 Market opportunities

Human‑centric tunable white for circadian support
AI driven adaptive controls and demand response
Global shift toward smarter energy efficient lighting

14. Competitive Landscape

14.1 Overview

14.2

Overview on criticality of inputs and factors of differentiation

14.3 Landscape disruption

Overview on factors of disruption

14.4 Industry risks

Impact of key risks on business

15. Competitive Analysis

15.1 Companies profiled

Companies covered

15.2 Company ranking index

15.3 Market positioning of companies

Matrix on companies position and classification

15.4 Acuity Brands Inc.

Acuity Brands Inc. - Overview
Acuity Brands Inc. - Business segments
Acuity Brands Inc. - Key offerings
Acuity Brands Inc. - Segment focus
SWOT

15.5 Bridgelux Inc.

Bridgelux Inc. - Overview
Bridgelux Inc. - Product / Service
Bridgelux Inc. - Key offerings
SWOT

15.6 Cooper Lighting LLC.

Cooper Lighting LLC. - Overview
Cooper Lighting LLC. - Product / Service
Cooper Lighting LLC. - Key offerings
SWOT

15.7 Cree Lighting

Cree Lighting - Overview
Cree Lighting - Product / Service
Cree Lighting - Key offerings
SWOT

15.8 Eaton Corp. Plc

Eaton Corp. Plc - Overview
Eaton Corp. Plc - Business segments
Eaton Corp. Plc - Key news
Eaton Corp. Plc - Key offerings
Eaton Corp. Plc - Segment focus
SWOT

15.9 Everlight Electronics Co. Ltd.

Everlight Electronics Co. Ltd. - Overview
Everlight Electronics Co. Ltd. - Product / Service
Everlight Electronics Co. Ltd. - Key offerings
SWOT

15.10 Havells India Ltd.

Havells India Ltd. - Overview
Havells India Ltd. - Business segments
Havells India Ltd. - Key news
Havells India Ltd. - Key offerings
Havells India Ltd. - Segment focus
SWOT

15.11 Nichia Corp.

Nichia Corp. - Overview
Nichia Corp. - Product / Service
Nichia Corp. - Key news
Nichia Corp. - Key offerings
SWOT

15.12 OSRAM GmbH

OSRAM GmbH - Overview
OSRAM GmbH - Business segments
OSRAM GmbH - Key news
OSRAM GmbH - Key offerings
OSRAM GmbH - Segment focus
SWOT

15.13 Panasonic Holdings Corp.

Panasonic Holdings Corp. - Overview
Panasonic Holdings Corp. - Business segments
Panasonic Holdings Corp. - Key news
Panasonic Holdings Corp. - Key offerings
Panasonic Holdings Corp. - Segment focus
SWOT

15.14 SAVANT TECHNOLOGIES LLC.

SAVANT TECHNOLOGIES LLC. - Overview
SAVANT TECHNOLOGIES LLC. - Product / Service
SAVANT TECHNOLOGIES LLC. - Key offerings
SWOT

15.15 Seoul Semiconductor Co. Ltd.

Seoul Semiconductor Co. Ltd. - Overview
Seoul Semiconductor Co. Ltd. - Product / Service
Seoul Semiconductor Co. Ltd. - Key offerings
SWOT

15.16 Signify NV

Signify NV - Overview
Signify NV - Business segments
Signify NV - Key news
Signify NV - Key offerings
Signify NV - Segment focus
SWOT

15.17 Siteco GmbH

Siteco GmbH - Overview
Siteco GmbH - Product / Service
Siteco GmbH - Key offerings
SWOT

15.18 TRILUX GmbH and Co. KG

TRILUX GmbH and Co. KG - Overview
TRILUX GmbH and Co. KG - Product / Service
TRILUX GmbH and Co. KG - Key offerings
SWOT

16. Appendix

16.1 Scope of the report

Market definition
Objectives
Notes and caveats

16.2 Inclusions and exclusions checklist

Inclusions checklist
Exclusions checklist

16.3 Currency conversion rates for US$

16.4 Research methodology

16.5 Data procurement

Information sources

16.6 Data validation

16.7 Validation techniques employed for market sizing

16.8 Data synthesis

16.9 360 degree market analysis

16.10 List of abbreviations

Research Methodology

Technavio presents a detailed picture of the market by way of study, synthesis, and summation of data from multiple sources. The analysts have presented the various facets of the market with a particular focus on identifying the key industry influencers. The data thus presented is comprehensive, reliable, and the result of extensive research, both primary and secondary.

INFORMATION SOURCES

Primary sources

  • Manufacturers and suppliers
  • Channel partners
  • Industry experts
  • Strategic decision makers

Secondary sources

  • Industry journals and periodicals
  • Government data
  • Financial reports of key industry players
  • Historical data
  • Press releases

DATA ANALYSIS

Data Synthesis

  • Collation of data
  • Estimation of key figures
  • Analysis of derived insights

Data Validation

  • Triangulation with data models
  • Reference against proprietary databases
  • Corroboration with industry experts

REPORT WRITING

Qualitative

  • Market drivers
  • Market challenges
  • Market trends
  • Five forces analysis

Quantitative

  • Market size and forecast
  • Market segmentation
  • Geographical insights
  • Competitive landscape

Interested in this report?

Get your sample now to see our research methodology and insights!

Download Now

Frequently Asked Questions

General Lighting market growth will increase by USD 75117.9 million during 2026-2030.

The General Lighting market is expected to grow at a CAGR of 8.2% during 2026-2030.

General Lighting market is segmented by Product (LED lighting, Traditional lighting) Application (Residential, Commercial, Outdoor, Industrial, Others) Battery type (Lithium-ion, Lead-acid, Nickel-based, Solid-state)

Acuity Brands Inc., Bridgelux Inc., Cooper Lighting LLC., Cree Lighting, Eaton Corp. Plc, Everlight Electronics Co. Ltd., Havells India Ltd., Lighting Technologies India Pvt., MEGAMAN, Nichia Corp., OSRAM GmbH, Panasonic Holdings Corp., SAVANT TECHNOLOGIES LLC., Seoul Semiconductor Co. Ltd., Signify NV, Siteco GmbH, TRILUX GmbH and Co. KG, Xicato are a few of the key vendors in the General Lighting market.

APAC will register the highest growth rate of 50.5% among the other regions. Therefore, the General Lighting market in APAC is expected to garner significant business opportunities for the vendors during the forecast period.

China, India, Japan, South Korea, Australia, Indonesia, Germany, UK, France, Italy, Spain, The Netherlands, US, Canada, Mexico, Saudi Arabia, UAE, South Africa, Egypt, Nigeria, Brazil, Argentina, Chile

  • Global phase‑outs push LED replacements rapidly is the driving factor this market.

The General Lighting market vendors should focus on grabbing business opportunities from the Product segment as it accounted for the largest market share in the base year.
RIA - Research AI Assistant
Ask RIA