
Generative AI In Data Labeling Solution And Services Market Size 2025-2029
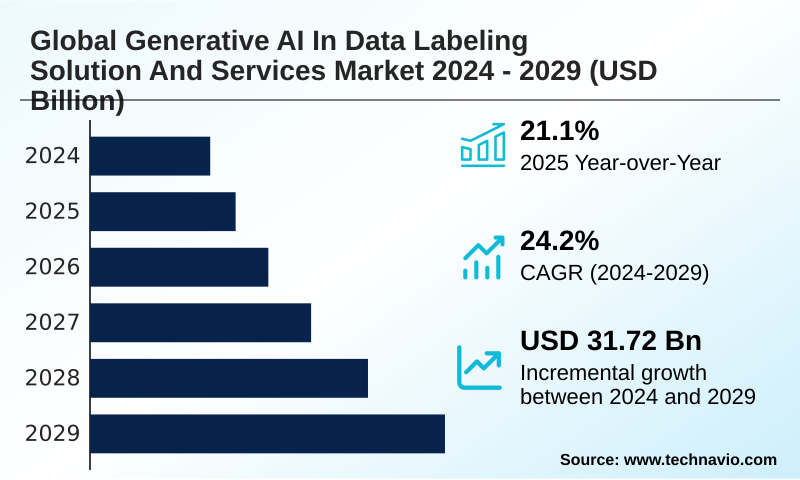
The generative ai in data labeling solution and services market size is valued to increase by USD 31.72 billion, at a CAGR of 24.2% from 2024 to 2029. Escalating demand for high-quality, large-scale datasets for advanced AI model training will drive the generative ai in data labeling solution and services market.
Major Market Trends & Insights
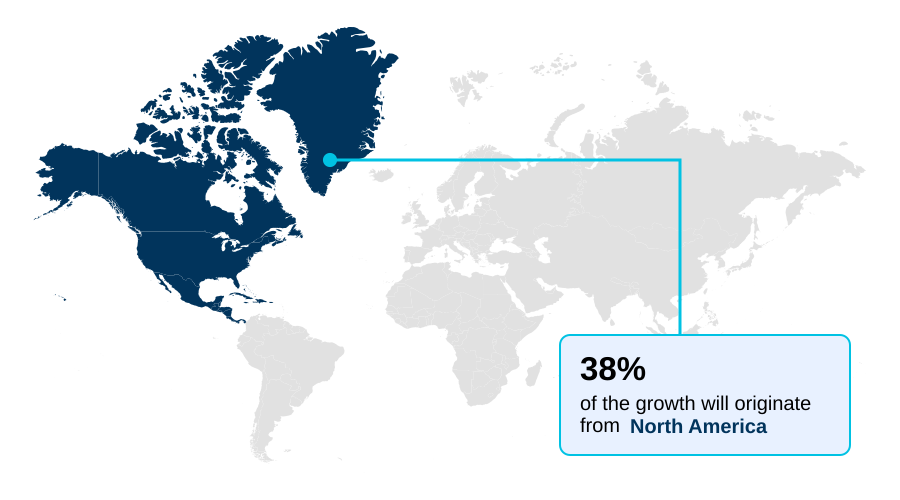
- North America dominated the market and accounted for a 38.4% growth during the forecast period.
- CAGR from 2024 to 2029 : 24.2%
Market Summary
- The generative AI in data labeling solution and services market is rapidly expanding, driven by the foundational need for high-quality training data to power sophisticated machine learning models. This market moves beyond traditional manual annotation by leveraging foundation models for data annotation automation, a critical component of a modern data-centric AI strategy.
- A key innovation is synthetic data generation, which uses generative adversarial networks (GANs) and diffusion models to create high-fidelity, privacy-preserving AI datasets. This is particularly vital in sectors like finance, where firms can simulate complex fraud scenarios for AI model validation without using real customer data, thereby enhancing model robustness while adhering to data governance protocols.
- However, the industry grapples with challenges like model bias mitigation and AI hallucination detection, necessitating robust human-in-the-loop (HITL) frameworks and red teaming for AI safety. As enterprise AI adoption grows, the focus on programmatic labeling and MLOps integration becomes crucial for scaling AI development lifecycles and achieving operational efficiency.
- The continuous evolution of these technologies is pivotal for accelerating the deployment of more accurate and reliable AI systems across all industries, from healthcare to autonomous systems.
What will be the Size of the Generative AI In Data Labeling Solution And Services Market during the forecast period?
Get Key Insights on Market Forecast (PDF) Get Free Sample
How is the Generative AI In Data Labeling Solution And Services Market Segmented?
The generative ai in data labeling solution and services industry research report provides comprehensive data (region-wise segment analysis), with forecasts and estimates in "USD million" for the period 2025-2029.
- End-user
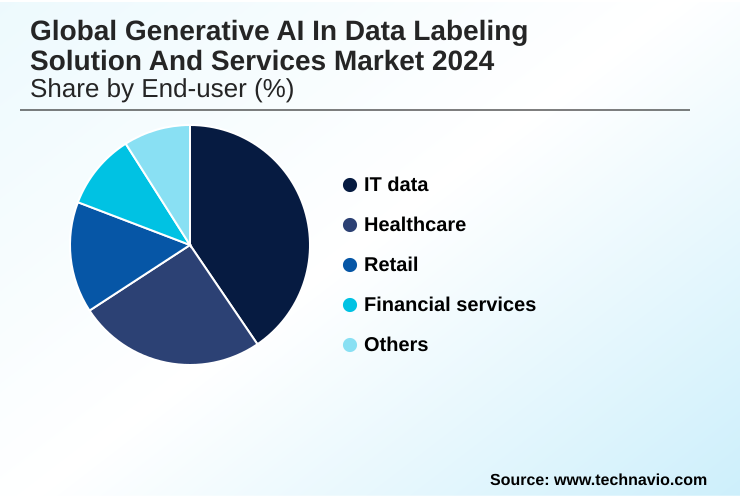
- IT data
- Healthcare
- Retail
- Financial services
- Others
- Type
- Semi-supervised
- Automatic
- Manual
- Product
- Image or video based
- Text based
- Audio based
- Geography
- North America
- US
- Canada
- Mexico
- APAC
- China
- India
- South Korea
- Europe
- Germany
- UK
- France
- South America
- Brazil
- Argentina
- Colombia
- Middle East and Africa
- South Africa
- Saudi Arabia
- UAE
- Rest of World (ROW)
- North America
By End-user Insights
The it data segment is estimated to witness significant growth during the forecast period.
The market is segmented by end-user, where the IT data vertical holds a significant share, and by type, including automatic and manual methods.
The demand for processing vast amounts of unstructured data is driving enterprise AI adoption across sectors like healthcare and finance.
Solutions are focused on computer vision model training and advancing natural language understanding (NLU) through improved sentiment analysis annotation and named entity recognition (NER). Techniques such as AI-powered pre-labeling and domain-specific data augmentation for conversational AI data are critical.
The use of high-fidelity synthetic data in intelligent document processing and for tasks like bounding box annotation and semantic segmentation accelerates workflows, with AI-assisted methods reducing manual annotation efforts by over 60% in some image-based projects.
Regional Analysis
North America is estimated to contribute 38.4% to the growth of the global market during the forecast period.Technavio’s analysts have elaborately explained the regional trends and drivers that shape the market during the forecast period.
See How Generative AI In Data Labeling Solution And Services Market Demand is Rising in North America Get Free Sample
Geographically, North America leads the market, contributing 38.4% of the incremental growth, driven by its concentration of major technology firms and a mature AI ecosystem that heavily utilizes reinforcement learning from human feedback (RLHF) and sophisticated AI model validation.
The region is a major consumer of solutions for sensor fusion data and LiDAR data labeling, particularly in the autonomous vehicle sector.
In contrast, Europe's landscape is shaped by stringent regulatory compliance in AI, with GDPR in AI data processing creating strong demand for privacy-preserving techniques.
APAC is the fastest-growing region, with government-led initiatives promoting the development of sovereign AI, driving demand for instruction tuning, video content analysis, and audio transcription services.
This varied landscape requires vendors to navigate diverse requirements, from SOC 2 compliance for AI in the US to specialized text-to-image synthesis and event-based data extraction for emerging markets.
Market Dynamics
Our researchers analyzed the data with 2024 as the base year, along with the key drivers, trends, and challenges. A holistic analysis of drivers will help companies refine their marketing strategies to gain a competitive advantage.
- The evolution of the market is best understood by the transition from simple data annotation to addressing complex, high-stakes challenges through sophisticated techniques. Initially focused on basic classification, the industry now relies on generative AI for rare event simulation in critical sectors.
- This includes privacy-preserving synthetic financial data to train fraud detection systems and synthetic medical imagery for diagnostic AI, which accelerates research without compromising patient confidentiality. Automating video annotation with foundation models has become essential for analyzing vast unstructured datasets.
- The refinement of these systems is powered by reinforcement learning from human feedback (RLHF) for LLM safety and alignment, a process where human oversight is indispensable. Consequently, human-in-the-loop for high-stakes AI validation is a standard practice, often proving twice as effective at identifying subtle model failures than purely automated testing.
- Enterprises now implement comprehensive data curation strategies for large language models and focus on bias detection and mitigation in training data. This includes automating quality control in data labeling workflows and leveraging programmatic labeling for structured data extraction.
- The goal is to build a robust data engine, using generative models for data augmentation and managing data governance for generative AI projects, all while optimizing computational costs for AI model training. This sophisticated approach, from fine-tuning diffusion models for specific domains to multimodal dataset fusion for autonomous driving, defines the frontier of enterprise-grade synthetic data generation platforms.
What are the key market drivers leading to the rise in the adoption of Generative AI In Data Labeling Solution And Services Industry?
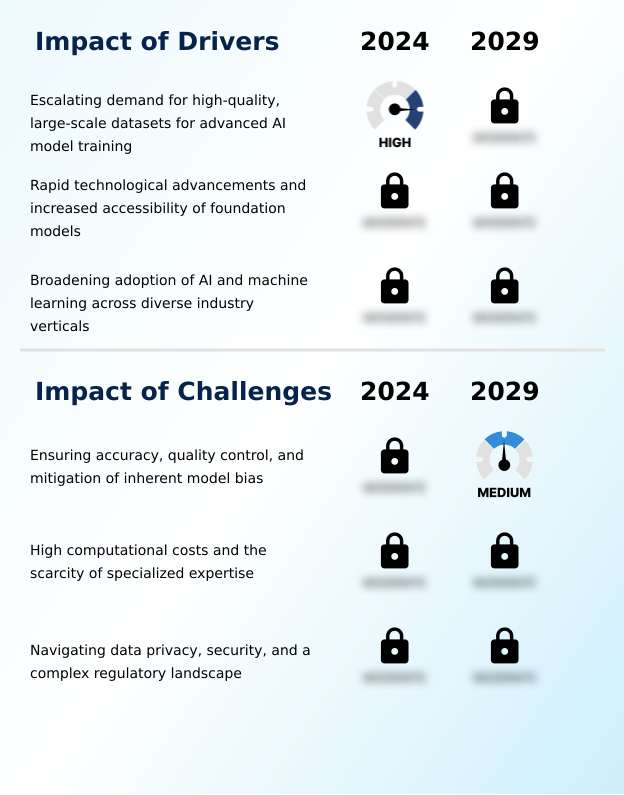
- The escalating demand for high-quality, large-scale datasets is the principal driver fueling the market, as such data is fundamental for training accurate and reliable AI models.
- Market growth is fundamentally driven by the relentless demand for high-quality datasets to ensure AI model robustness testing. The increased accessibility of powerful foundation models, capable of sophisticated few-shot learning and zero-shot learning, has democratized advanced data annotation automation.
- This allows organizations to implement AI-driven process optimization and AI-assisted labeling with lower upfront investment, reducing initial development costs by a significant margin.
- The integration of these tools into the broader MLOps integration landscape enables efficient data curation and streamlined data pipeline optimization. As a result, active learning workflows are becoming standard for large-scale dataset management.
- This technological accessibility, combined with a strategic push for more context-aware annotation, is accelerating adoption and solidifying the market's foundational role in the AI industry.
What are the market trends shaping the Generative AI In Data Labeling Solution And Services Industry?
- The proliferation of synthetic data generation for creating robust training datasets is a paramount trend, fundamentally reshaping the development and deployment of advanced AI models.
- Key trends are reshaping the market's trajectory, led by the strategic use of synthetic data generation. This approach, leveraging generative adversarial networks (GANs) and diffusion models, allows for high-fidelity edge case scenario simulation, with some organizations cutting data acquisition costs by over 40%.
- A second major trend is the evolution of human-in-the-loop (HITL) frameworks into sophisticated, data-centric AI workflows that perform automated quality assurance (QA) and accelerate the AI development lifecycle. These advanced HITL systems have boosted annotator productivity by nearly 200% in certain tasks.
- Finally, the emergence of programmatic labeling for complex multimodal data labeling is critical, enabling the analysis of cross-modal data relationships to create superior ground truth data, which is essential for AI model fine-tuning and building next-generation applications.
What challenges does the Generative AI In Data Labeling Solution And Services Industry face during its growth?
- A critical market challenge is ensuring the accuracy and quality control of AI-generated labels while simultaneously mitigating the inherent model bias within foundation models.
- Navigating the market involves significant challenges, primarily centered on ensuring data quality and mitigating risks. The imperative for model bias mitigation requires a robust ethical AI framework and sophisticated model evaluation metrics, as unverified AI hallucination detection can still permit error rates of over 5%.
- Another major hurdle is the high cost of computational resource management and the scarcity of specialized AI talent acquisition, with infrastructure for model fine-tuning often representing up to 50% of a project's budget. Furthermore, concerns over data privacy in machine learning and data security in cloud AI are paramount, mandating strict data governance protocols.
- Providers must offer secure options like on-premise AI deployment and demonstrate adherence to privacy-preserving AI principles, as navigating regulatory landscapes is crucial for enterprise trust.
Exclusive Technavio Analysis on Customer Landscape
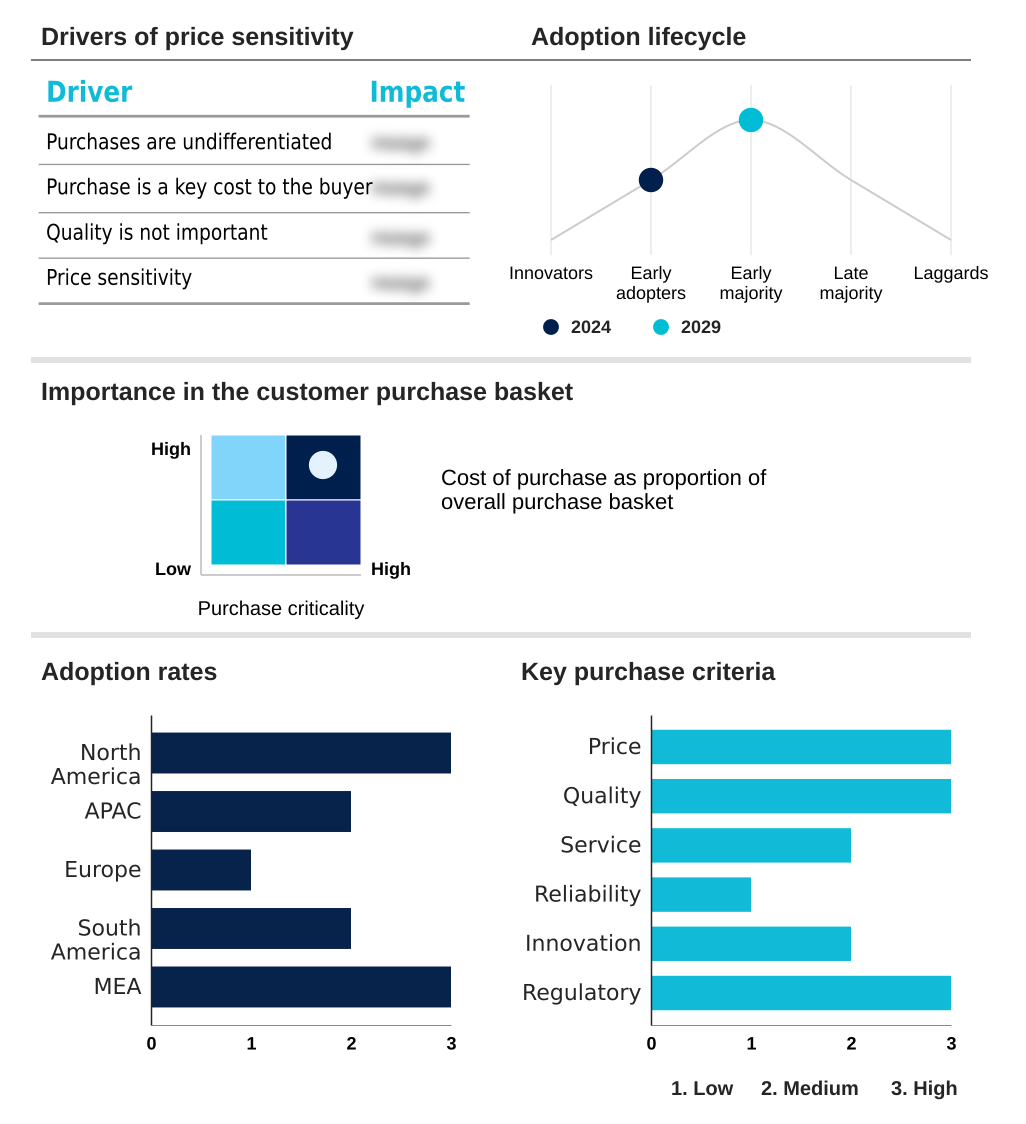
The generative ai in data labeling solution and services market forecasting report includes the adoption lifecycle of the market, covering from the innovator’s stage to the laggard’s stage. It focuses on adoption rates in different regions based on penetration. Furthermore, the generative ai in data labeling solution and services market report also includes key purchase criteria and drivers of price sensitivity to help companies evaluate and develop their market growth analysis strategies.
Customer Landscape of Generative AI In Data Labeling Solution And Services Industry
Competitive Landscape
Companies are implementing various strategies, such as strategic alliances, generative ai in data labeling solution and services market forecast, partnerships, mergers and acquisitions, geographical expansion, and product/service launches, to enhance their presence in the industry.
ALEGION - Platforms provide AI-powered data curation, synthetic data generation, and automated quality assurance to accelerate the development of robust, enterprise-grade AI applications.
The industry research and growth report includes detailed analyses of the competitive landscape of the market and information about key companies, including:
- ALEGION
- Amazon Mechanical Turk, Inc.
- APPEN Ltd.
- Clickworker GmbH
- Cloudfactory
- Cogito Tech LLC
- Enable
- Heex Technologies
- iMerit
- Labelbox
- Scale
- Shaip
- SuperAnnotate
- TaskUs Inc.
- TELUS International Inc.
Qualitative and quantitative analysis of companies has been conducted to help clients understand the wider business environment as well as the strengths and weaknesses of key industry players. Data is qualitatively analyzed to categorize companies as pure play, category-focused, industry-focused, and diversified; it is quantitatively analyzed to categorize companies as dominant, leading, strong, tentative, and weak.
Recent Development and News in Generative ai in data labeling solution and services market
- In September 2024, SynthAI Corp announced a $150 million Series C funding round to expand its synthetic data generation platform for the automotive and healthcare sectors.
- In November 2024, DataWeaver Inc. launched its new multimodal foundation model capable of synchronously labeling video, audio, and text streams for complex event analysis.
- In February 2025, CloudScale AI and OmniLabel announced a strategic partnership to integrate OmniLabel's expert human-in-the-loop services directly into the CloudScale AI development platform.
- In April 2025, the European AI Alliance initiated a project to create a massive, multi-language dataset for training sovereign LLMs, utilizing generative AI for data augmentation and labeling.
Dive into Technavio’s robust research methodology, blending expert interviews, extensive data synthesis, and validated models for unparalleled Generative AI In Data Labeling Solution And Services Market insights. See full methodology.
| Market Scope | |
|---|---|
| Page number | 283 |
| Base year | 2024 |
| Forecast period | 2025-2029 |
| Growth momentum & CAGR | Accelerate at a CAGR of 24.2% |
| Market growth 2025-2029 | USD 31724.4 million |
| Market structure | Fragmented |
| YoY growth 2024-2025(%) | 21.1% |
| Key countries | US, Canada, Mexico, China, India, South Korea, Japan, Australia, Indonesia, Germany, UK, France, Italy, The Netherlands, Spain, Brazil, Argentina, Colombia, South Africa, Saudi Arabia, UAE, Israel and Turkey |
| Competitive landscape | Leading Companies, Market Positioning of Companies, Competitive Strategies, and Industry Risks |
Research Analyst Overview
- The generative AI in data labeling solution and services market is defined by its role in producing the high-quality data necessary for enterprise-grade AI. This ecosystem leverages advanced technologies, including generative adversarial networks (GANs) and diffusion models, to facilitate data annotation automation and high-fidelity synthetic data generation.
- A key aspect is the shift to a data-centric AI approach, where MLOps integration and robust data governance protocols are paramount. For boardroom consideration, budgeting for these platforms is no longer a niche IT expense but a strategic investment in core business intelligence, as AI-assisted labeling can complete projects up to four times faster than manual methods.
- The process involves sophisticated techniques such as reinforcement learning from human feedback (RLHF), instruction tuning, and red teaming for AI safety. Applications range from semantic segmentation and bounding box annotation in computer vision to named entity recognition (NER) in text.
- As models become more complex, data curation, model evaluation metrics, and AI hallucination detection are critical for ensuring AI model validation and mitigating risks, making privacy-preserving AI and model bias mitigation non-negotiable components.
What are the Key Data Covered in this Generative AI In Data Labeling Solution And Services Market Research and Growth Report?
-
What is the expected growth of the Generative AI In Data Labeling Solution And Services Market between 2025 and 2029?
-
USD 31.72 billion, at a CAGR of 24.2%
-
-
What segmentation does the market report cover?
-
The report is segmented by End-user (IT data, Healthcare, Retail, Financial services, Others), Type (Semi-supervised, Automatic, Manual), Product (Image or video-based, Text-based, Audio-based) and Geography (North America, APAC, Europe, South America, Middle East and Africa)
-
-
Which regions are analyzed in the report?
-
North America, APAC, Europe, South America and Middle East and Africa
-
-
What are the key growth drivers and market challenges?
-
Escalating demand for high-quality, large-scale datasets for advanced AI model training, Ensuring accuracy, quality control, and mitigation of inherent model bias
-
-
Who are the major players in the Generative AI In Data Labeling Solution And Services Market?
-
ALEGION, Amazon Mechanical Turk, Inc., APPEN Ltd., Clickworker GmbH, Cloudfactory, Cogito Tech LLC, Enable, Heex Technologies, iMerit, Labelbox, Scale, Shaip, SuperAnnotate, TaskUs Inc. and TELUS International Inc.
-
Market Research Insights
- The market's dynamics are shaped by the tangible business outcomes delivered by advanced AI-powered pre-labeling and automated quality assurance (QA) systems. The adoption of these technologies has shown to accelerate the AI development lifecycle significantly, with some organizations reporting a reduction in data preparation timelines by up to 50%.
- A data-centric AI workflow, which prioritizes the systematic engineering of data, is becoming standard practice. For instance, using high-fidelity synthetic data for edge case scenario simulation can improve a model's robustness, enhancing its performance on rare events by as much as 30% compared to models trained on real-world data alone.
- This focus on data quality and AI model robustness testing directly translates to more reliable and valuable AI applications, driving enterprise AI adoption across various verticals and optimizing data pipeline efficiency.
We can help! Our analysts can customize this generative ai in data labeling solution and services market research report to meet your requirements.
 RIA -
RIA - 
