
Synthetic Data Generation Market Size 2025-2029
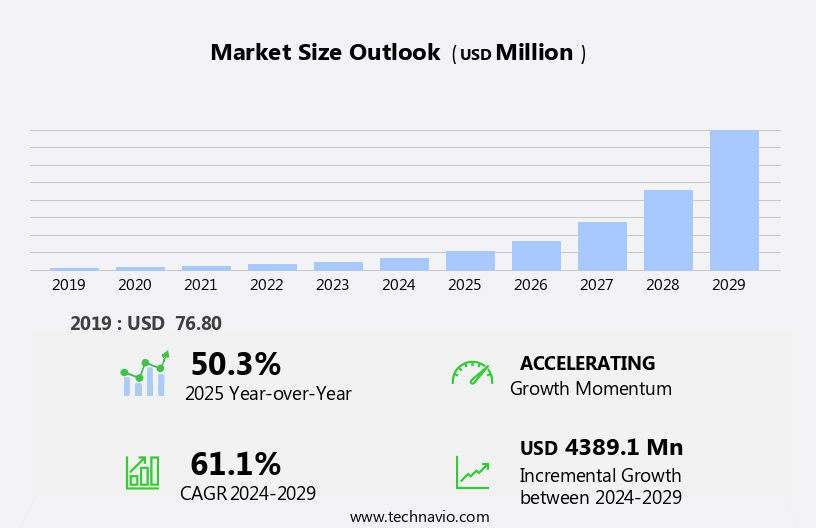
The synthetic data generation market size is forecast to increase by USD 4.39 billion, at a CAGR of 61.1% between 2024 and 2029.
- The market is experiencing significant growth, driven by the escalating demand for data privacy protection. With increasing concerns over data security and the potential risks associated with using real data, synthetic data is gaining traction as a viable alternative. Furthermore, the deployment of large language models is fueling market expansion, as these models can generate vast amounts of realistic and diverse data, reducing the reliance on real-world data sources. However, high costs associated with high-end generative models pose a challenge for market participants. These models require substantial computational resources and expertise to develop and implement effectively. Companies seeking to capitalize on market opportunities must navigate these challenges by investing in research and development to create more cost-effective solutions or partnering with specialists in the field.
- Overall, the market presents significant potential for innovation and growth, particularly in industries where data privacy is a priority and large language models can be effectively utilized.
What will be the Size of the Synthetic Data Generation Market during the forecast period?
Explore in-depth regional segment analysis with market size data - historical 2019-2023 and forecasts 2025-2029 - in the full report.
Request Free Sample
The market continues to evolve, driven by the increasing demand for data-driven insights across various sectors. Data processing is a crucial aspect of this market, with a focus on ensuring data integrity, privacy, and security. Data privacy-preserving techniques, such as data masking and anonymization, are essential in maintaining confidentiality while enabling data sharing. Real-time data processing and data simulation are key applications of synthetic data, enabling predictive modeling and data consistency. Data management and workflow automation are integral components of synthetic data platforms, with cloud computing and model deployment facilitating scalability and flexibility. Data governance frameworks and compliance regulations play a significant role in ensuring data quality and security.
Deep learning models, variational autoencoders (VAEs), and neural networks are essential tools for model training and optimization, while API integration and batch data processing streamline the data pipeline. Machine learning models and data visualization provide valuable insights, while edge computing enables data processing at the source. Data augmentation and data transformation are essential techniques for enhancing the quality and quantity of synthetic data. Data warehousing and data analytics provide a centralized platform for managing and deriving insights from large datasets. Synthetic data generation continues to unfold, with ongoing research and development in areas such as federated learning, homomorphic encryption, statistical modeling, and software development.
The market's dynamic nature reflects the evolving needs of businesses and the continuous advancements in data technology.
How is this Synthetic Data Generation Industry segmented?
The synthetic data generation industry research report provides comprehensive data (region-wise segment analysis), with forecasts and estimates in "USD million" for the period 2025-2029, as well as historical data from 2019-2023 for the following segments.
- End-user
- Healthcare and life sciences
- Retail and e-commerce
- Transportation and logistics
- IT and telecommunication
- BFSI and others
- Type
- Agent-based modelling
- Direct modelling
- Application
- AI and ML Model Training
- Data privacy
- Simulation and testing
- Others
- Product
- Tabular data
- Text data
- Image and video data
- Others
- Geography
- North America
- US
- Canada
- Mexico
- Europe
- France
- Germany
- Italy
- UK
- APAC
- China
- India
- Japan
- Rest of World (ROW)
- North America
By End-user Insights
The healthcare and life sciences segment is estimated to witness significant growth during the forecast period.
In the rapidly evolving data landscape, the market is gaining significant traction, particularly in the healthcare and life sciences sector. With a growing emphasis on data-driven decision-making and stringent data privacy regulations, synthetic data has emerged as a viable alternative to real data for various applications. This includes data processing, data preprocessing, data cleaning, data labeling, data augmentation, and predictive modeling, among others. Medical imaging data, such as MRI scans and X-rays, are essential for diagnosis and treatment planning. However, sharing real patient data for research purposes or training machine learning algorithms can pose significant privacy risks. Synthetic data generation addresses this challenge by producing realistic medical imaging data, ensuring data privacy while enabling research and development.
Moreover, advanced techniques like data masking, data anonymization, differential privacy, and homomorphic encryption are employed to further safeguard data privacy and security. Real-time data processing, data warehousing, data analytics, and data visualization are also facilitated by synthetic data, enhancing operational efficiency and enabling better insights. Cloud computing and edge computing enable the deployment and storage of synthetic data, while data pipelines and workflow automation streamline data management. Deep learning models, variational autoencoders, and neural networks are trained on synthetic data, ensuring model accuracy and consistency. Data governance frameworks and compliance regulations guide the ethical use of synthetic data, fostering trust and transparency.
Model evaluation, interpretability, and explainability are crucial aspects of synthetic data generation, ensuring model bias is minimized and model accuracy is maximized. Software development and API integration enable seamless integration of synthetic data into existing systems, making it an accessible solution for organizations of all sizes. Batch data processing and machine learning models further expand the applications of synthetic data, making it a versatile and essential tool in the data-driven world.
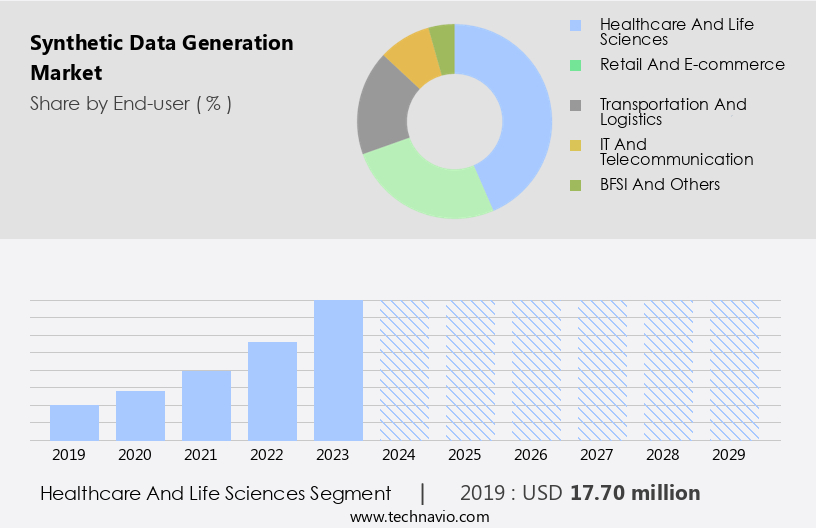
The Healthcare and life sciences segment was valued at USD 17.70 billion in 2019 and showed a gradual increase during the forecast period.
Regional Analysis
North America is estimated to contribute 37% to the growth of the global market during the forecast period.Technavio’s analysts have elaborately explained the regional trends and drivers that shape the market during the forecast period.
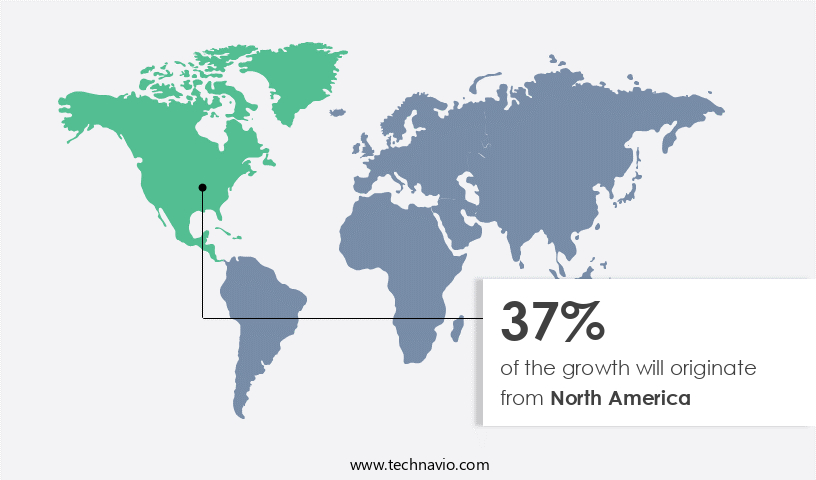
The market in North America is experiencing significant growth due to the increasing demand for high-quality data in various industries, including healthcare, finance, and automotive, for applications such as research and development, testing, and training. The region's vibrant tech ecosystem, home to numerous tech giants, startups, and research organizations, is a major contributor to this market's expansion. These entities are developing innovative solutions for data generation, such as OpenAI's advanced algorithms that produce high-quality synthetic data. Data privacy and security are paramount in synthetic data generation, and data masking, anonymization, and federated learning are essential techniques used to maintain data integrity.
Real-time data processing and data management are crucial for efficient data handling, while data consistency and data quality are essential for accurate predictive modeling and model training. Workflow automation, cloud computing, and edge computing enable seamless data processing and model deployment. Data governance frameworks ensure compliance with regulations, and data pipelines facilitate data transformation and data warehousing. Deep learning models, variational autoencoders, and neural networks are commonly used for data simulation and data synthesis, while differential privacy and homomorphic encryption are privacy-preserving techniques. Data labeling, data cleaning, and data preprocessing are essential for preparing data for model training and optimization.
Data visualization and model evaluation are necessary for understanding model performance and interpretability. Machine learning models and API integration are also integral to the synthetic data generation process.
Market Dynamics
Our researchers analyzed the data with 2024 as the base year, along with the key drivers, trends, and challenges. A holistic analysis of drivers will help companies refine their marketing strategies to gain a competitive advantage.
What are the key market drivers leading to the rise in the adoption of Synthetic Data Generation Industry?
- The increasing concern for safeguarding personal information serves as the primary catalyst for market growth, with heightened awareness and regulations driving this demand for privacy protection.
- The market is experiencing notable growth due to escalating privacy concerns and the requirement for regulatory compliance. With the increasing frequency and sophistication of data breaches and cyber-attacks, businesses are prioritizing data protection. Synthetic data, a solution to this issue, generates artificial data that mirrors real data, thereby minimizing the risk of data breaches and safeguarding customer and employee privacy. Moreover, synthetic data generation offers benefits such as model bias reduction, improved model evaluation, enhanced model interpretability, and explainability.
- It enables data augmentation, data warehousing, data analytics, and data transformation without compromising data quality. Synthetic data platforms are instrumental in creating immersive, harmonious, and strike-free data, emphasizing data accuracy and reliability. In conclusion, recent research indicates a growing trend towards synthetic data generation as a critical tool for businesses seeking to protect sensitive information while maintaining data integrity and ensuring regulatory compliance.
What are the market trends shaping the Synthetic Data Generation Industry?
- The deployment of large language models is currently a significant market trend. This growth is driven by advancements in artificial intelligence and natural language processing technology.
- The market is experiencing significant growth due to the increasing adoption of advanced models, such as deep learning models and neural networks, for generating synthetic data. One of the primary applications of these models is in preserving data integrity and privacy in various industries. For instance, in the healthcare sector, patient data is often confidential and sensitive, making it difficult to share and utilize for research purposes. However, synthetic data generated using large language models, such as variational autoencoders (VAEs), can closely mimic real patient data, enabling researchers and developers to analyze it without compromising patient privacy. Similarly, in the banking and finance sector, synthetic data is essential for model training and optimization.
- These models are integrated through APIs for batch data processing and machine learning model development. Data visualization is another area where synthetic data is increasingly being used, especially in edge computing environments where real data may not be readily available. Overall, the deployment of large language models for synthetic data generation is a promising trend that offers numerous benefits, including improved model accuracy and enhanced data security.
What challenges does the Synthetic Data Generation Industry face during its growth?
- The escalating costs linked to implementing high-end generative models pose a significant challenge, hindering the growth and expansion of the industry.
- The market is experiencing notable growth due to increasing demands for data privacy protection, diverse and representative data, and efficient model training. However, the market's expansion is not without challenges. Generative models, such as Generative Adversarial Networks (GANs) and Variational Autoencoders (VAEs), are in high demand due to their ability to generate synthetic data that closely resembles real-world data. Yet, the development and deployment of these advanced models require substantial financial investments. The creation of such models necessitates significant computational power, specialized hardware, and extensive training data. Ensuring data privacy and security during data processing is another critical concern for businesses.
- Data masking, data anonymization, and data labeling are essential data preprocessing techniques to maintain data privacy and security. Data cleaning and data governance frameworks are also crucial to ensure data integrity and accuracy. Predictive modeling and data simulation through data synthesis are vital for businesses to gain insights and make informed decisions. Overall, the market's growth is driven by these factors, but the financial investment required for advanced generative models remains a significant challenge.
Exclusive Customer Landscape
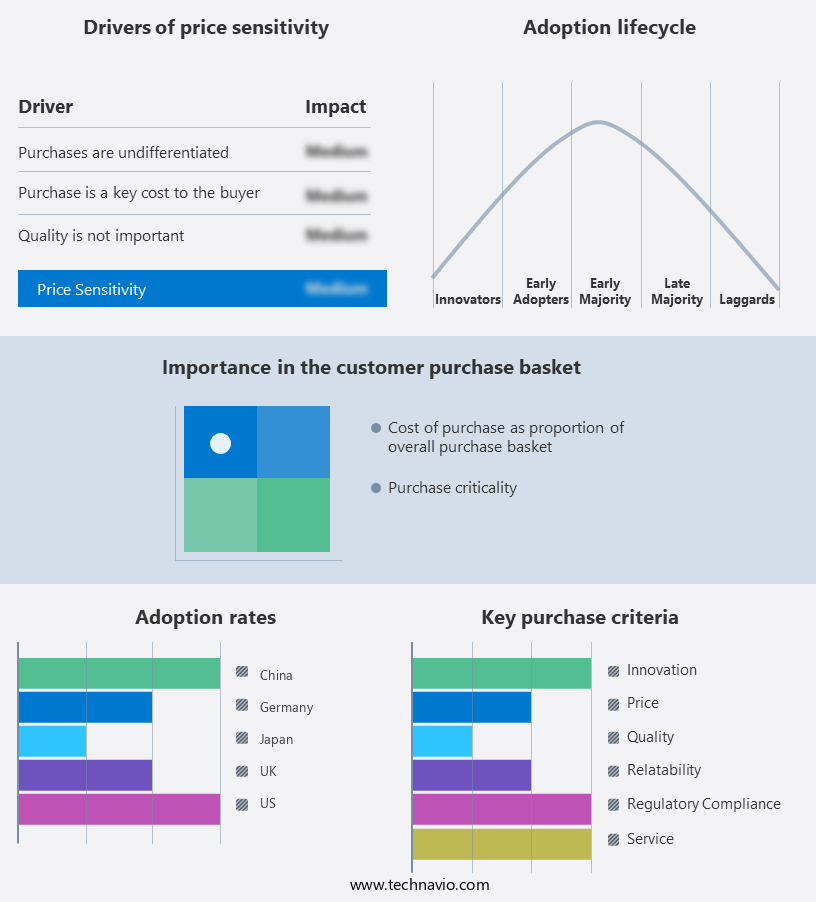
The synthetic data generation market forecasting report includes the adoption lifecycle of the market, covering from the innovator’s stage to the laggard’s stage. It focuses on adoption rates in different regions based on penetration. Furthermore, the synthetic data generation market report also includes key purchase criteria and drivers of price sensitivity to help companies evaluate and develop their market growth analysis strategies.
Customer Landscape
Key Companies & Market Insights
Companies are implementing various strategies, such as strategic alliances, synthetic data generation market forecast, partnerships, mergers and acquisitions, geographical expansion, and product/service launches, to enhance their presence in the industry.
Alphabet Inc. - Google LLC introduces its Synthetic Data Generation solution, featuring the Dataflow Data Generator Flex Template. This innovative offering enables businesses to create authentic, non-sensitive data for various use cases, enhancing data security and privacy. The Dataflow Data Generator Flex Template utilizes advanced algorithms to generate realistic data, ensuring data accuracy and consistency. By employing this technology, organizations can augment their existing datasets, improving machine learning models and analytics without compromising data integrity.
The industry research and growth report includes detailed analyses of the competitive landscape of the market and information about key companies, including:
- Alphabet Inc.
- Amazon.com Inc.
- AnyLogic North America LLC
- Anyverse SL
- DADoES Inc
- Facteus Inc
- GenRocket Inc.
- Gretel Labs Inc.
- Hazy Ltd.
- International Business Machines Corp.
- MDClone Ltd.
- Microsoft Corp.
- Neurolaboratories Ltd.
- NVIDIA Corp.
- OpenAI L.L.C.
- Synthesia Ltd.
- Synthesized Ltd
- Syntheticus
- Tata Consultancy Services Ltd.
- YData
Qualitative and quantitative analysis of companies has been conducted to help clients understand the wider business environment as well as the strengths and weaknesses of key industry players. Data is qualitatively analyzed to categorize companies as pure play, category-focused, industry-focused, and diversified; it is quantitatively analyzed to categorize companies as dominant, leading, strong, tentative, and weak.
Recent Development and News in Synthetic Data Generation Market
- In January 2024, IBM announced the launch of its new AI-powered synthetic data generation platform, IBM Watson Data Labeling and Annotation, designed to help businesses create realistic training data for machine learning models. This development aimed to address the data scarcity issue in AI applications (IBM Press Release).
- In March 2024, Microsoft and NVIDIA joined forces to integrate NVIDIA's synthetic data generation capabilities into Microsoft Azure's AI offerings. This collaboration was intended to provide enhanced data generation services for Azure customers, enabling them to create synthetic data for their AI projects more efficiently (Microsoft Blog).
- In May 2024, Siemens Digital Industries Software acquired DataArtisans, a leading provider of streaming data processing solutions. The acquisition aimed to strengthen Siemens' data analytics portfolio with DataArtisans' synthetic data generation technology, allowing the company to offer more comprehensive data solutions to its clients (Siemens Press Release).
- In April 2025, the European Union's General Data Protection Regulation (GDPR) issued new guidelines on synthetic data generation, recognizing its potential to enhance data privacy while maintaining data utility. The guidelines provided a framework for organizations to generate synthetic data in compliance with GDPR, ensuring data protection while advancing AI innovation (European Data Protection Board).
Research Analyst Overview
- The market is witnessing significant activity and trends as businesses seek to ensure data integrity, access control, and compliance with privacy regulations. Data consulting firms are providing expertise in data certification, training, and data usage policies to help organizations navigate complex data landscapes. Generative models, such as deep learning algorithms, are being employed to create synthetic data for testing and training machine learning models, improving data quality and reducing reliance on original data. Data infrastructure and data platforms are essential components of data management, requiring robust data security measures, data backup, and data archiving. Data governance policies are being implemented to ensure data compliance with various standards and regulations.
- Data breach response plans are also crucial, with data deletion policies and data breach response services becoming increasingly important. Data sharing agreements and data retention policies are critical in managing data usage and ensuring data privacy. Data integrity assurance and data recovery solutions are essential for mitigating data loss and ensuring business continuity. Data monitoring and data enrichment are also important for maintaining data accuracy and completeness, while data risk assessment helps organizations identify and mitigate potential threats. Overall, the market is a dynamic and evolving landscape, with a focus on data security, data privacy, and data integrity.
- Organizations must stay informed of the latest trends and best practices to effectively manage their data assets.
Dive into Technavio’s robust research methodology, blending expert interviews, extensive data synthesis, and validated models for unparalleled Synthetic Data Generation Market insights. See full methodology.
|
Market Scope |
|
|
Report Coverage |
Details |
|
Page number |
232 |
|
Base year |
2024 |
|
Historic period |
2019-2023 |
|
Forecast period |
2025-2029 |
|
Growth momentum & CAGR |
Accelerate at a CAGR of 61.1% |
|
Market growth 2025-2029 |
USD 4389.1 million |
|
Market structure |
Fragmented |
|
YoY growth 2024-2025(%) |
50.3 |
|
Key countries |
US, China, Germany, Japan, UK, Canada, France, Italy, India, and Mexico |
|
Competitive landscape |
Leading Companies, Market Positioning of Companies, Competitive Strategies, and Industry Risks |
What are the Key Data Covered in this Synthetic Data Generation Market Research and Growth Report?
- CAGR of the Synthetic Data Generation industry during the forecast period
- Detailed information on factors that will drive the growth and forecasting between 2025 and 2029
- Precise estimation of the size of the market and its contribution of the industry in focus to the parent market
- Accurate predictions about upcoming growth and trends and changes in consumer behaviour
- Growth of the market across North America, Europe, APAC, Middle East and Africa, and South America
- Thorough analysis of the market’s competitive landscape and detailed information about companies
- Comprehensive analysis of factors that will challenge the synthetic data generation market growth of industry companies
We can help! Our analysts can customize this synthetic data generation market research report to meet your requirements.
 RIA -
RIA - 
