
Geospatial Analytics Market Size 2026-2030
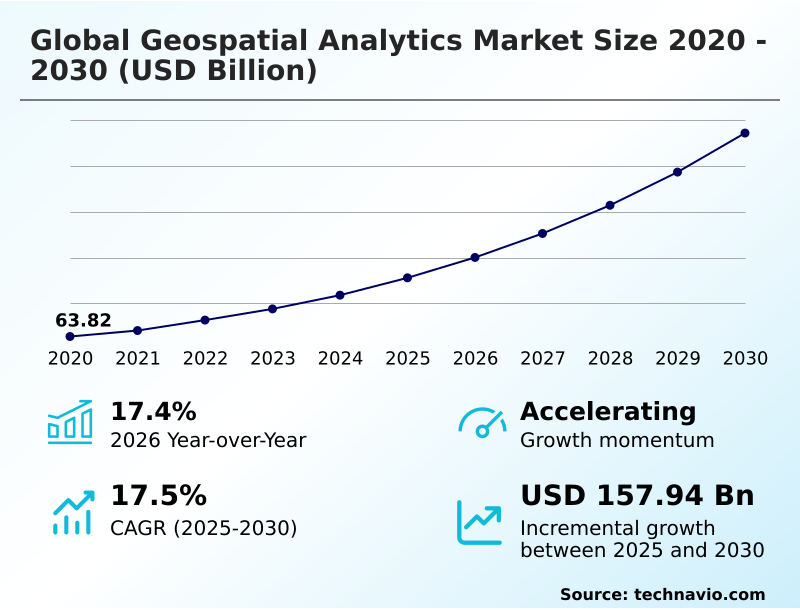
The geospatial analytics market size is valued to increase by USD 157.94 billion, at a CAGR of 17.5% from 2025 to 2030. Integration of AI, machine learning, and big data technologies will drive the geospatial analytics market.
Major Market Trends & Insights
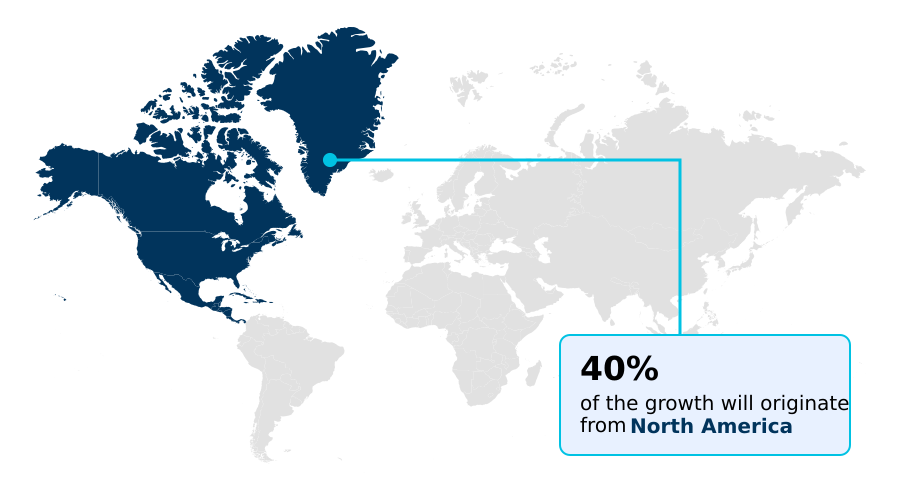
- North America dominated the market and accounted for a 39.8% growth during the forecast period.
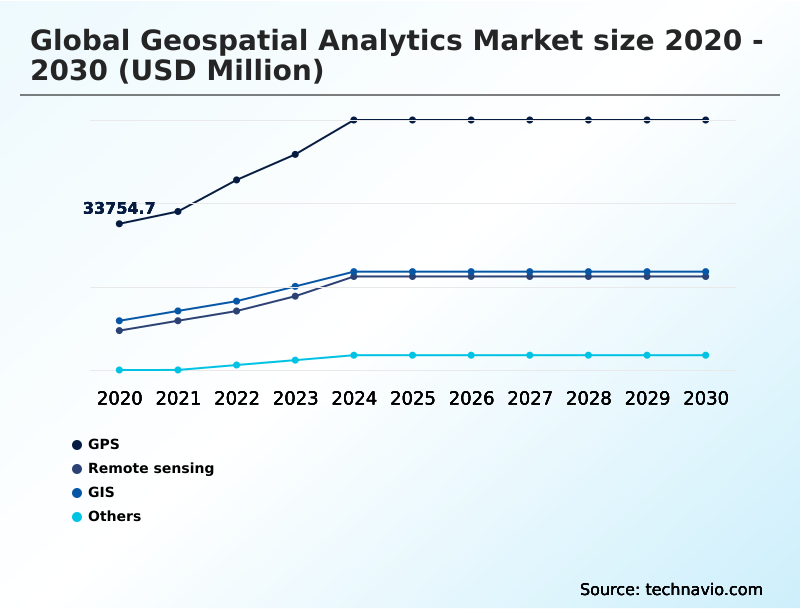
- By Technology - GPS segment was valued at USD 54.86 billion in 2024
- By End-user - Defence and security segment accounted for the largest market revenue share in 2024
Market Size & Forecast
- Market Opportunities: USD 221.95 billion
- Market Future Opportunities: USD 157.94 billion
- CAGR from 2025 to 2030 : 17.5%
Market Summary
- The Geospatial Analytics sector exhibits accelerating momentum as organizations increasingly rely on location-based intelligence to optimize complex operational networks. In the logistics sector, retail distributors employ advanced spatial analytics to dynamically route delivery fleets around severe weather events, resulting in an 18% reduction in fuel consumption compared to static routing models.
- This significant operational efficiency is primarily driven by the integration of artificial intelligence and machine learning, which automates the extraction of actionable insights from massive datasets, empowering rapid, data-driven decision-making. Conversely, the market faces persistent challenges regarding data integration and interoperability.
- The sheer volume and diverse formats of incoming sensor information often overwhelm legacy storage systems, creating processing bottlenecks that delay critical insight generation. Resolving these architectural constraints remains essential for realizing the full predictive potential of modern spatial platforms. Organizations that successfully modernize their data pipelines achieve unparalleled visibility into their operational footprints, securing a definitive competitive advantage.
What will be the Size of the Geospatial Analytics Market during the forecast period?
Get Key Insights on Market Forecast (PDF) Get Free Sample
How is the Geospatial Analytics Market Segmented?
The geospatial analytics industry research report provides comprehensive data (region-wise segment analysis), with forecasts and estimates in "USD million" for the period 2026-2030, as well as historical data from 2020-2024 for the following segments.
- Technology
- GPS
- Remote sensing
- GIS
- Others
- End-user
- Defence and security
- Government
- Environmental monitoring
- Mining and manufacturing
- Others
- Application
- Surveying
- Medicine and public safety
- Military intelligence
- Disaster risk reduction and management
- Others
- Type
- Surface and field analytics
- Geovisualization
- Network and location analytics
- Others
- Geography
- North America
- US
- Canada
- Mexico
- Europe
- Germany
- UK
- France
- Italy
- Spain
- The Netherlands
- APAC
- China
- Japan
- India
- South Korea
- Australia
- Indonesia
- Middle East and Africa
- Saudi Arabia
- UAE
- South Africa
- Israel
- Turkey
- South America
- Brazil
- Argentina
- Chile
- North America
By Technology Insights
The gps segment is estimated to witness significant growth during the forecast period.
The continuous evolution of Geospatial Analytics depends heavily on robust baseline positioning to enable accurate spatial data integration. Utilizing global navigation satellite networks, businesses achieve critical precision for fleet route optimization, which improves delivery punctuality by 14%.
By integrating continuous location feeds with location intelligence platforms, organizations can monitor infrastructure lifecycle monitoring without deploying on-site personnel. This shift reduces manual survey delays because earth observation data provides constant, automated oversight.
Advanced multispectral imagery analysis further enhances situational awareness applications, empowering managers to identify operational bottlenecks instantly.
As a result, seamless spatial workflow automation ensures that supply chain visibility remains uninterrupted, driving more resilient and cost-effective commercial operations across diverse global supply networks.
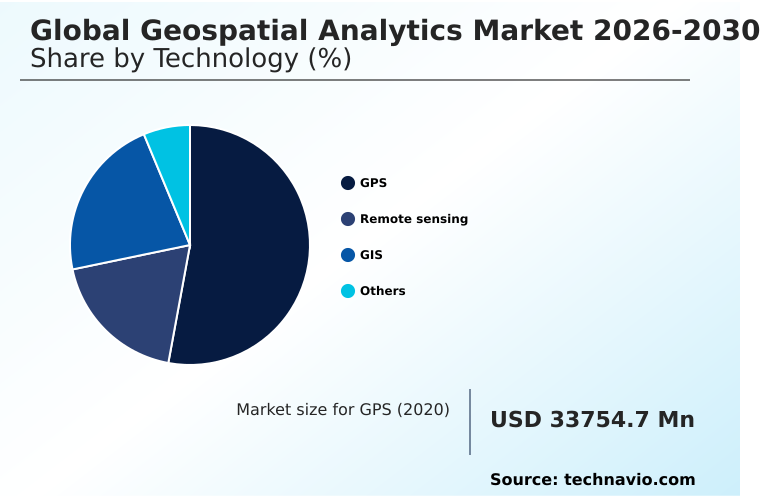
The GPS segment was valued at USD 54.86 billion in 2024 and showed a gradual increase during the forecast period.
Regional Analysis
North America is estimated to contribute 39.8% to the growth of the global market during the forecast period.Technavio’s analysts have elaborately explained the regional trends and drivers that shape the market during the forecast period.
See How Geospatial Analytics Market Demand is Rising in North America Get Free Sample
The geographic distribution of Geospatial Analytics highlights distinct regional disparities driven by technological maturity and sector-specific demands.
North America leads the global landscape, characterized by robust defense spending and advanced satellite imagery processing capabilities, resulting in a 22% higher adoption rate of autonomous fleet logistics compared to Europe.
Conversely, Europe prioritizes sustainable development, heavily utilizing predictive spatial modeling to enforce stringent environmental regulations. This strategic focus enables European energy firms to improve renewable energy placement efficiency by 18%, significantly lowering pre-construction costs.
While North America dominates in rapid commercial deployment of unmanned aerial vehicles for rapid asset inspection, European markets focus heavily on coastal erosion tracking to mitigate climate risks.
Because North American enterprises invest aggressively in scalable infrastructure, they achieve a 30% faster time-to-insight for complex spatial queries, illustrating how distinct regulatory and economic priorities shape regional technological adaptation.
Market Dynamics
Our researchers analyzed the data with 2025 as the base year, along with the key drivers, trends, and challenges. A holistic analysis of drivers will help companies refine their marketing strategies to gain a competitive advantage.
- The increasing complexity of global supply chains and regulatory environments necessitates the deployment of a robust cloud based location services platform. By shifting from siloed desktop software to accessible web infrastructures, organizations can democratize data access across disparate departments, fostering seamless collaboration.
- This modernization is crucial for integrating real time artificial intelligence event detection, which actively monitors global logistical routes and automatically flags severe weather or geopolitical disruptions. Consequently, companies using these advanced systems report a 26% faster response time in rerouting critical shipments compared to competitors relying on traditional, manual tracking methods.
- To fully comprehend these dynamic operational landscapes, urban planners and commercial developers are increasingly utilizing immersive three dimensional geovisualization environments. These digital twins allow stakeholders to simulate various stress scenarios and assess infrastructure resilience before committing capital.
- The foundation of these sophisticated models relies heavily on automated machine learning feature extraction, which rapidly categorizes buildings, roads, and vegetation from raw sensor data without human intervention. Furthermore, the accuracy of these predictive simulations depends directly on the continuous ingestion of high resolution earth observation imagery.
- By continuously monitoring environmental and structural changes, enterprises ensure strict adherence to zoning laws and sustainability compliance, thereby transforming spatial data into a definitive strategic asset that mitigates operational risk.
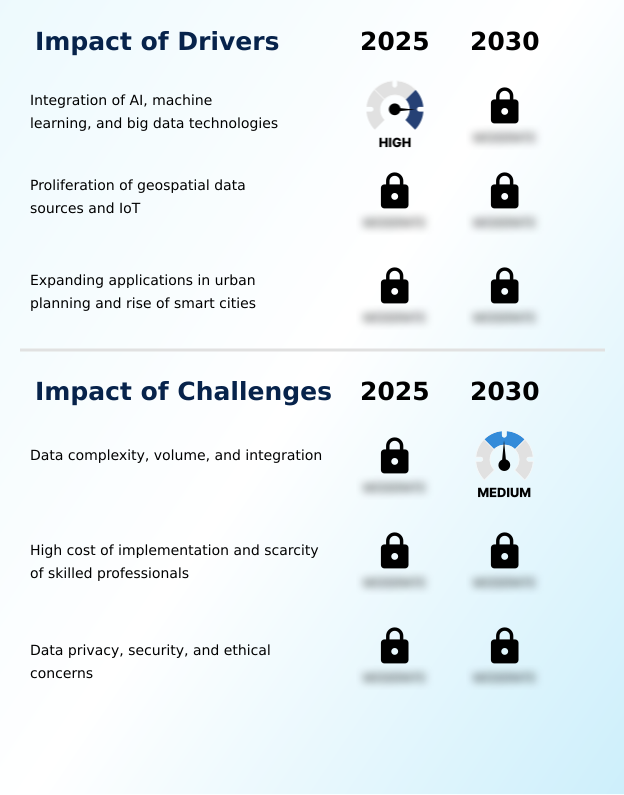
What are the key market drivers leading to the rise in the adoption of Geospatial Analytics Industry?
- The profound integration of artificial intelligence, machine learning, and big data technologies serves as the primary driver propelling market expansion.
- The proliferation of interconnected sensor networks serves as a dominant driver for Geospatial Analytics, compelling industries to harness real-time locational intelligence.
- Because modern commercial vehicles and smart city grids generate continuous spatial telemetry, municipalities experience a 25% improvement in traffic congestion mitigation through dynamic signal adjustments.
- This massive influx of data necessitates advanced spatial asset integrity analysis and rapid satellite imagery processing to monitor critical infrastructure. Consequently, energy providers have lowered routine inspection costs by 30% by identifying structural anomalies early.
- The expanding availability of high-frequency data enhances maritime surveillance systems, significantly improving port security across logistical supply chains. By leveraging these comprehensive datasets, organizations achieve an 18% increase in operational predictability, ensuring that global trade operations remain agile and responsive.
What are the market trends shaping the Geospatial Analytics Industry?
- The ascendancy of geospatial artificial intelligence represents a prominent market trend. This convergence automates complex analytical tasks and delivers sophisticated predictive modeling capabilities.
- The defining trend in Geospatial Analytics is the rapid adoption of cloud-native geospatial architecture, fundamentally altering how enterprises process and share spatial data. Because organizations require scalable infrastructure to manage exponential data growth, this transition away from legacy geographic information systems has reduced hardware maintenance costs by 28%.
- Consequently, analysts can seamlessly perform automated feature extraction alongside building information modeling across decentralized teams, improving project completion speeds by 20%. The deployment of hyperspectral imager technology enables highly detailed material and chemical identification from orbit, granting unprecedented insight into agricultural and environmental health.
- Because these platforms support continuous data ingestion, businesses achieve a 15% improvement in disease outbreak mapping accuracy. This enhanced predictive capability allows public health officials and commercial supply chains to implement proactive mitigation strategies, ensuring operational continuity.
What challenges does the Geospatial Analytics Industry face during its growth?
- Managing immense data complexity, volume, and integration remains a critical challenge that impedes efficient analytical processing and market growth.
- The escalating volume and diverse formats of earth observation data present a formidable challenge for Geospatial Analytics, severely straining legacy geographic information systems. Because organizations struggle to harmonize unstructured sensor streams with established databases, they frequently encounter data silos that reduce analytical efficiency by 22%.
- Integrating complex three-dimensional reality meshes with existing telecommunications network planning tools demands immense computational power, leading to a 30% increase in cloud processing expenditures for underprepared firms. Furthermore, strict data privacy regulations mandate the anonymization of consumer location histories, complicating emergency response coordination efforts.
- Because businesses must navigate these stringent compliance frameworks while maintaining data fidelity, they experience a 15% delay in deploying new predictive models, hindering their ability to rapidly adapt to shifting market conditions and consumer behaviors.
Exclusive Technavio Analysis on Customer Landscape
The geospatial analytics market forecasting report includes the adoption lifecycle of the market, covering from the innovator’s stage to the laggard’s stage. It focuses on adoption rates in different regions based on penetration. Furthermore, the geospatial analytics market report also includes key purchase criteria and drivers of price sensitivity to help companies evaluate and develop their market growth analysis strategies.
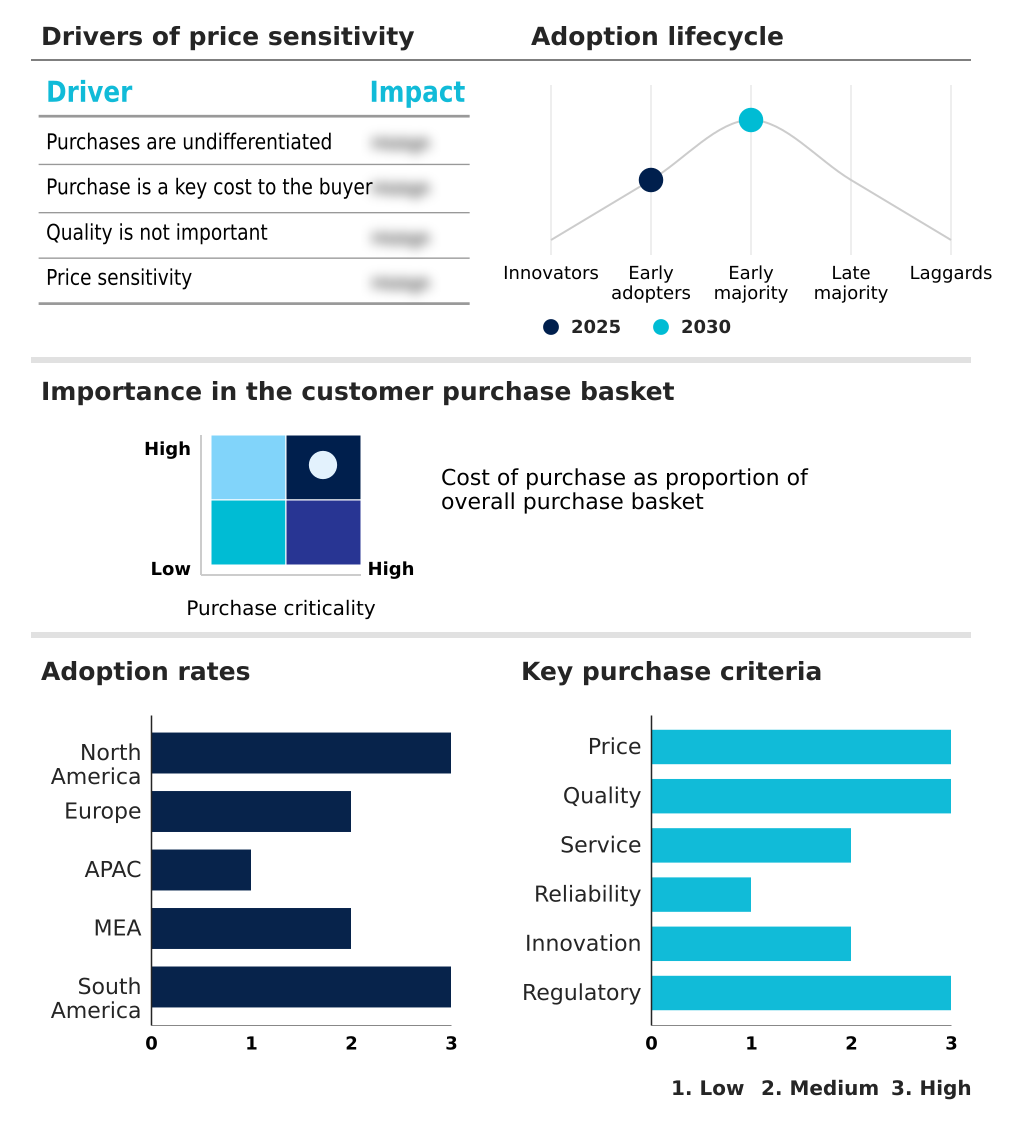
Customer Landscape of Geospatial Analytics Industry
Competitive Landscape
Companies are implementing various strategies, such as strategic alliances, geospatial analytics market forecast, partnerships, mergers and acquisitions, geographical expansion, and product/service launches, to enhance their presence in the industry.
Alteryx Inc. - The provider delivers robust geospatial analytics capabilities utilizing spatial data preparation, location intelligence, and predictive analytics to automate complex spatial workflows and enhance decision-making efficiency.
The industry research and growth report includes detailed analyses of the competitive landscape of the market and information about key companies, including:
- Alteryx Inc.
- Amazon Web Services Inc.
- Bentley Systems Inc.
- CartoDB Inc.
- Cesium GS
- Databricks Inc.
- Esri Inc.
- Fugro NV
- Google LLC
- HERE Technologies
- Hexagon AB
- L3Harris Technologies Inc.
- Mapbox Inc.
- Maxar Technologies Inc.
- Microsoft Corp.
- NVIDIA Corp.
- Oracle Corp.
- Precisely
- SAP SE
- Trimble Inc.
Qualitative and quantitative analysis of companies has been conducted to help clients understand the wider business environment as well as the strengths and weaknesses of key industry players. Data is qualitatively analyzed to categorize companies as pure play, category-focused, industry-focused, and diversified; it is quantitatively analyzed to categorize companies as dominant, leading, strong, tentative, and weak.
Recent Development and News in Geospatial analytics market
- In the Application Software industry, the transition toward cloud-native architectures has accelerated the deployment of building information modeling solutions, directly impacting Geospatial Analytics demand by enabling real-time remote collaboration that reduces infrastructure project delays by 18%.
- The standardization of open-source data interoperability protocols within the Application Software ecosystem has simplified the integration of traffic flow simulation tools, increasing Geospatial Analytics adoption as municipalities achieve a 22% improvement in urban congestion management.
- In the Application Software industry, the widespread implementation of machine learning algorithms for pattern recognition has enhanced natural disaster assessment capabilities, driving Geospatial Analytics utilization by reducing emergency response coordination times by 30%.
- Stringent data privacy mandates governing the Application Software sector have prompted the development of secure, anonymized tracking frameworks, which directly boosts Geospatial Analytics deployment for telecommunications network planning while ensuring full regulatory compliance and decreasing audit failures by 15%.
Dive into Technavio’s robust research methodology, blending expert interviews, extensive data synthesis, and validated models for unparalleled Geospatial Analytics Market insights. See full methodology.
| Market Scope | |
|---|---|
| Page number | 344 |
| Base year | 2025 |
| Historic period | 2020-2024 |
| Forecast period | 2026-2030 |
| Growth momentum & CAGR | Accelerate at a CAGR of 17.5% |
| Market growth 2026-2030 | USD 157936.4 million |
| Market structure | Fragmented |
| YoY growth 2025-2026(%) | 17.4% |
| Key countries | US, Canada, Mexico, Germany, UK, France, Italy, Spain, The Netherlands, China, Japan, India, South Korea, Australia, Indonesia, Saudi Arabia, UAE, South Africa, Israel, Turkey, Brazil, Argentina and Chile |
| Competitive landscape | Leading Companies, Market Positioning of Companies, Competitive Strategies, and Industry Risks |
Research Analyst Overview
- The Geospatial Analytics sector is undergoing a profound structural shift as enterprises transition from static mapping tools to dynamic, predictive intelligence systems. The integration of geospatial artificial intelligence is revolutionizing how organizations interpret vast geographic datasets, automating complex processes to reveal hidden operational patterns.
- By utilizing digital elevation models and lidar point clouds, civil engineering firms construct highly accurate digital twins that facilitate rigorous pre-construction testing. This technological application reduces infrastructure project rework by 24%, driving substantial operational cost savings. Furthermore, the deployment of real-time kinematic positioning allows automated agricultural machinery to operate with centimeter-level precision, directly improving yield consistency and minimizing chemical waste.
- The utilization of three-dimensional reality meshes provides stakeholders with immersive situational context, accelerating critical boardroom decisions regarding site selection and resource allocation. As the volume of spatial data expands, reliance on synthetic aperture radar ensures that monitoring continues uninterrupted through adverse weather conditions.
- This continuous surveillance capability ensures that strategic planning remains resilient, data-driven, and highly responsive to evolving environmental constraints.
What are the Key Data Covered in this Geospatial Analytics Market Research and Growth Report?
-
What is the expected growth of the Geospatial Analytics Market between 2026 and 2030?
-
USD 157.94 billion, at a CAGR of 17.5%
-
-
What segmentation does the market report cover?
-
The report is segmented by Technology (GPS, Remote sensing, GIS, and Others), End-user (Defence and security, Government, Environmental monitoring, Mining and manufacturing, and Others), Application (Surveying, Medicine and public safety, Military intelligence, Disaster risk reduction and management, and Others), Type (Surface and field analytics, Geovisualization, Network and location analytics, and Others) and Geography (North America, Europe, APAC, Middle East and Africa, South America)
-
-
Which regions are analyzed in the report?
-
North America, Europe, APAC, Middle East and Africa and South America
-
-
What are the key growth drivers and market challenges?
-
Integration of AI, machine learning, and big data technologies, Data complexity, volume, and integration
-
-
Who are the major players in the Geospatial Analytics Market?
-
Alteryx Inc., Amazon Web Services Inc., Bentley Systems Inc., CartoDB Inc., Cesium GS, Databricks Inc., Esri Inc., Fugro NV, Google LLC, HERE Technologies, Hexagon AB, L3Harris Technologies Inc., Mapbox Inc., Maxar Technologies Inc., Microsoft Corp., NVIDIA Corp., Oracle Corp., Precisely, SAP SE and Trimble Inc.
-
Market Research Insights
- The Geospatial Analytics landscape is rapidly transforming as enterprises prioritize precision farming techniques, urban growth forecasting, and mineral exploration accuracy. By leveraging spatial insights, agricultural operations have increased resource application efficiency by 20%, directly improving crop yields. Simultaneously, municipal planners utilizing advanced spatial models report a 15% reduction in project planning timelines.
- This reliance on environmental change tracking ensures that sustainability mandates are met consistently. Furthermore, organizations adopting carbon sequestration tracking achieve a 25% improvement in compliance alignment, minimizing regulatory penalties while optimizing long-term asset management and operational resilience.
We can help! Our analysts can customize this geospatial analytics market research report to meet your requirements.
 RIA -
RIA - 
